Free Statistics

of Irreproducible Research!

Author's title

Author*Unverified author*
R Software Modulerwasp_exponentialsmoothing.wasp
Title produced by softwareExponential Smoothing
Date of computationMon, 09 Jan 2017 11:21:45 +0000
Cite this page as followsStatistical Computations at FreeStatistics.org, Office for Research Development and Education, URL https://freestatistics.org/blog/index.php?v=date/2017/Jan/09/t14839614463zmh71gqrg3uadm.htm/, Retrieved Tue, 14 May 2024 06:22:54 +0200
Statistical Computations at FreeStatistics.org, Office for Research Development and Education, URL https://freestatistics.org/blog/index.php?pk=, Retrieved Tue, 14 May 2024 06:22:54 +0200
QR Codes:

Original text written by user:
IsPrivate?No (this computation is public)
User-defined keywords
Estimated Impact0
Dataseries X:
96.07
95
93.27
91.94
91.62
91.01
90.62
97.72
99.09
99.72
100.22
99.15
101.16
101.8
103.31
101.19
99.09
95.91
94.56
95.76
100.36
102.67
103.58
100.89
103.46
104.86
104.88
104.46
103.83
101
99.36
96.71
95.23
95.62
95.8
94.79
95.39
94.9
94.84
94.68
94.17
94.1
93.84
94.2
97.76
98.26
99.63
98.75
100.15
99.63
99.72
98.87
98.4
97.99
98.46
98.73
98.66
98.14
98.39
97.78


Summary of computational transaction
Raw Inputview raw input (R code)
Raw Outputview raw output of R engine
Computing time2 seconds
R Server'George Udny Yule' @ yule.wessa.net

\begin{tabular}{lllllllll}
\hline
Summary of computational transaction \tabularnewline
Raw Input & view raw input (R code)  \tabularnewline
Raw Output & view raw output of R engine  \tabularnewline
Computing time & 2 seconds \tabularnewline
R Server & 'George Udny Yule' @ yule.wessa.net \tabularnewline
\hline
\end{tabular}
%Source: https://freestatistics.org/blog/index.php?pk=&T=0

[TABLE]
[ROW][C]Summary of computational transaction[/C][/ROW]
[ROW][C]Raw Input[/C][C]view raw input (R code) [/C][/ROW]
[ROW][C]Raw Output[/C][C]view raw output of R engine [/C][/ROW]
[ROW][C]Computing time[/C][C]2 seconds[/C][/ROW]
[ROW][C]R Server[/C][C]'George Udny Yule' @ yule.wessa.net[/C][/ROW]
[/TABLE]
Source: https://freestatistics.org/blog/index.php?pk=&T=0

Globally Unique Identifier (entire table): ba.freestatistics.org/blog/index.php?pk=&T=0

As an alternative you can also use a QR Code:  

The GUIDs for individual cells are displayed in the table below:

Summary of computational transaction
Raw Inputview raw input (R code)
Raw Outputview raw output of R engine
Computing time2 seconds
R Server'George Udny Yule' @ yule.wessa.net


Estimated Parameters of Exponential Smoothing
ParameterValue
alpha0.845760865406144
beta0.00108226686615238
gamma1

\begin{tabular}{lllllllll}
\hline
Estimated Parameters of Exponential Smoothing \tabularnewline
Parameter & Value \tabularnewline
alpha & 0.845760865406144 \tabularnewline
beta & 0.00108226686615238 \tabularnewline
gamma & 1 \tabularnewline
\hline
\end{tabular}
%Source: https://freestatistics.org/blog/index.php?pk=&T=1

[TABLE]
[ROW][C]Estimated Parameters of Exponential Smoothing[/C][/ROW]
[ROW][C]Parameter[/C][C]Value[/C][/ROW]
[ROW][C]alpha[/C][C]0.845760865406144[/C][/ROW]
[ROW][C]beta[/C][C]0.00108226686615238[/C][/ROW]
[ROW][C]gamma[/C][C]1[/C][/ROW]
[/TABLE]
Source: https://freestatistics.org/blog/index.php?pk=&T=1

Globally Unique Identifier (entire table): ba.freestatistics.org/blog/index.php?pk=&T=1

As an alternative you can also use a QR Code:  

The GUIDs for individual cells are displayed in the table below:

Estimated Parameters of Exponential Smoothing
ParameterValue
alpha0.845760865406144
beta0.00108226686615238
gamma1


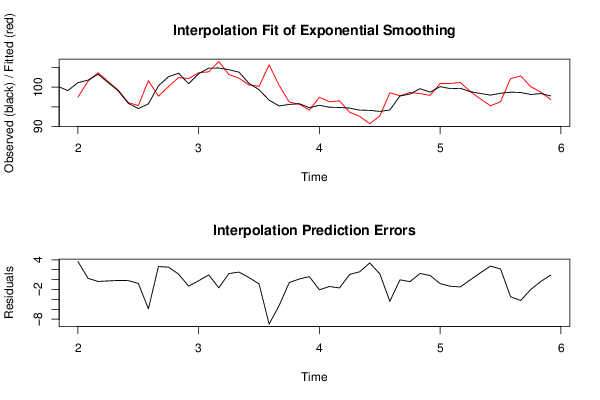
Interpolation Forecasts of Exponential Smoothing
tObservedFittedResiduals
13101.1697.50625267094023.65374732905981
14101.8101.5387198732780.261280126722426
15103.31103.683460238584-0.373460238583931
16101.19101.45643686718-0.266436867180389
1799.0999.2526024616152-0.162602461615194
1895.9196.1068549630581-0.196854963058087
1994.5695.3207078502209-0.760707850220882
2095.76101.665313059375-5.90531305937498
21100.3697.71715715153992.64284284846009
22102.67100.1590327456372.51096725436341
23103.58102.4687548426361.11124515736402
24100.89102.206913933537-1.31691393353714
25103.46103.680859827134-0.220859827133992
26104.86103.9106345305380.949365469462464
27104.88106.537608385503-1.65760838550334
28104.46103.2380141667541.2219858332459
29103.83102.3074113810521.52258861894839
30101100.5815586138440.418441386155649
3199.36100.229309238024-0.869309238024243
3296.71105.688937126656-8.97893712665609
3395.23100.457249967978-5.22724996797837
3495.6296.2129244013621-0.59292440136214
3595.895.66911909566320.13088090433682
3694.7994.1902245601650.599775439834971
3795.3997.4426574236907-2.0526574236907
3894.996.2903588978503-1.39035889785026
3994.8496.5209413691768-1.68094136917675
4094.6893.63029110202541.04970889797463
4194.1792.58472220397121.58527779602876
4294.190.72601842160883.37398157839118
4393.8492.66196470159581.17803529840415
4494.298.5913454708681-4.39134547086815
4597.7697.8115309642692-0.0515309642691477
4698.2698.6573680659352-0.397368065935225
4799.6398.38872247980611.24127752019393
4898.7597.92042294385340.829577056146633
49100.15100.9574575276-0.807457527599837
5099.63100.960945930705-1.33094593070463
5199.72101.197505994394-1.47750599439401
5298.8798.9008203710407-0.0308203710406474
5398.497.02373256722361.3762674327764
5497.9995.26369758781042.7263024121896
5598.4696.31212194108632.14787805891373
5698.73102.202589646825-3.47258964682464
5798.66102.869881421969-4.20988142196884
5898.14100.142289853516-2.00228985351616
5998.3998.7644214840007-0.374421484000706
6097.7896.86006170396640.919938296033607

\begin{tabular}{lllllllll}
\hline
Interpolation Forecasts of Exponential Smoothing \tabularnewline
t & Observed & Fitted & Residuals \tabularnewline
13 & 101.16 & 97.5062526709402 & 3.65374732905981 \tabularnewline
14 & 101.8 & 101.538719873278 & 0.261280126722426 \tabularnewline
15 & 103.31 & 103.683460238584 & -0.373460238583931 \tabularnewline
16 & 101.19 & 101.45643686718 & -0.266436867180389 \tabularnewline
17 & 99.09 & 99.2526024616152 & -0.162602461615194 \tabularnewline
18 & 95.91 & 96.1068549630581 & -0.196854963058087 \tabularnewline
19 & 94.56 & 95.3207078502209 & -0.760707850220882 \tabularnewline
20 & 95.76 & 101.665313059375 & -5.90531305937498 \tabularnewline
21 & 100.36 & 97.7171571515399 & 2.64284284846009 \tabularnewline
22 & 102.67 & 100.159032745637 & 2.51096725436341 \tabularnewline
23 & 103.58 & 102.468754842636 & 1.11124515736402 \tabularnewline
24 & 100.89 & 102.206913933537 & -1.31691393353714 \tabularnewline
25 & 103.46 & 103.680859827134 & -0.220859827133992 \tabularnewline
26 & 104.86 & 103.910634530538 & 0.949365469462464 \tabularnewline
27 & 104.88 & 106.537608385503 & -1.65760838550334 \tabularnewline
28 & 104.46 & 103.238014166754 & 1.2219858332459 \tabularnewline
29 & 103.83 & 102.307411381052 & 1.52258861894839 \tabularnewline
30 & 101 & 100.581558613844 & 0.418441386155649 \tabularnewline
31 & 99.36 & 100.229309238024 & -0.869309238024243 \tabularnewline
32 & 96.71 & 105.688937126656 & -8.97893712665609 \tabularnewline
33 & 95.23 & 100.457249967978 & -5.22724996797837 \tabularnewline
34 & 95.62 & 96.2129244013621 & -0.59292440136214 \tabularnewline
35 & 95.8 & 95.6691190956632 & 0.13088090433682 \tabularnewline
36 & 94.79 & 94.190224560165 & 0.599775439834971 \tabularnewline
37 & 95.39 & 97.4426574236907 & -2.0526574236907 \tabularnewline
38 & 94.9 & 96.2903588978503 & -1.39035889785026 \tabularnewline
39 & 94.84 & 96.5209413691768 & -1.68094136917675 \tabularnewline
40 & 94.68 & 93.6302911020254 & 1.04970889797463 \tabularnewline
41 & 94.17 & 92.5847222039712 & 1.58527779602876 \tabularnewline
42 & 94.1 & 90.7260184216088 & 3.37398157839118 \tabularnewline
43 & 93.84 & 92.6619647015958 & 1.17803529840415 \tabularnewline
44 & 94.2 & 98.5913454708681 & -4.39134547086815 \tabularnewline
45 & 97.76 & 97.8115309642692 & -0.0515309642691477 \tabularnewline
46 & 98.26 & 98.6573680659352 & -0.397368065935225 \tabularnewline
47 & 99.63 & 98.3887224798061 & 1.24127752019393 \tabularnewline
48 & 98.75 & 97.9204229438534 & 0.829577056146633 \tabularnewline
49 & 100.15 & 100.9574575276 & -0.807457527599837 \tabularnewline
50 & 99.63 & 100.960945930705 & -1.33094593070463 \tabularnewline
51 & 99.72 & 101.197505994394 & -1.47750599439401 \tabularnewline
52 & 98.87 & 98.9008203710407 & -0.0308203710406474 \tabularnewline
53 & 98.4 & 97.0237325672236 & 1.3762674327764 \tabularnewline
54 & 97.99 & 95.2636975878104 & 2.7263024121896 \tabularnewline
55 & 98.46 & 96.3121219410863 & 2.14787805891373 \tabularnewline
56 & 98.73 & 102.202589646825 & -3.47258964682464 \tabularnewline
57 & 98.66 & 102.869881421969 & -4.20988142196884 \tabularnewline
58 & 98.14 & 100.142289853516 & -2.00228985351616 \tabularnewline
59 & 98.39 & 98.7644214840007 & -0.374421484000706 \tabularnewline
60 & 97.78 & 96.8600617039664 & 0.919938296033607 \tabularnewline
\hline
\end{tabular}
%Source: https://freestatistics.org/blog/index.php?pk=&T=2

[TABLE]
[ROW][C]Interpolation Forecasts of Exponential Smoothing[/C][/ROW]
[ROW][C]t[/C][C]Observed[/C][C]Fitted[/C][C]Residuals[/C][/ROW]
[ROW][C]13[/C][C]101.16[/C][C]97.5062526709402[/C][C]3.65374732905981[/C][/ROW]
[ROW][C]14[/C][C]101.8[/C][C]101.538719873278[/C][C]0.261280126722426[/C][/ROW]
[ROW][C]15[/C][C]103.31[/C][C]103.683460238584[/C][C]-0.373460238583931[/C][/ROW]
[ROW][C]16[/C][C]101.19[/C][C]101.45643686718[/C][C]-0.266436867180389[/C][/ROW]
[ROW][C]17[/C][C]99.09[/C][C]99.2526024616152[/C][C]-0.162602461615194[/C][/ROW]
[ROW][C]18[/C][C]95.91[/C][C]96.1068549630581[/C][C]-0.196854963058087[/C][/ROW]
[ROW][C]19[/C][C]94.56[/C][C]95.3207078502209[/C][C]-0.760707850220882[/C][/ROW]
[ROW][C]20[/C][C]95.76[/C][C]101.665313059375[/C][C]-5.90531305937498[/C][/ROW]
[ROW][C]21[/C][C]100.36[/C][C]97.7171571515399[/C][C]2.64284284846009[/C][/ROW]
[ROW][C]22[/C][C]102.67[/C][C]100.159032745637[/C][C]2.51096725436341[/C][/ROW]
[ROW][C]23[/C][C]103.58[/C][C]102.468754842636[/C][C]1.11124515736402[/C][/ROW]
[ROW][C]24[/C][C]100.89[/C][C]102.206913933537[/C][C]-1.31691393353714[/C][/ROW]
[ROW][C]25[/C][C]103.46[/C][C]103.680859827134[/C][C]-0.220859827133992[/C][/ROW]
[ROW][C]26[/C][C]104.86[/C][C]103.910634530538[/C][C]0.949365469462464[/C][/ROW]
[ROW][C]27[/C][C]104.88[/C][C]106.537608385503[/C][C]-1.65760838550334[/C][/ROW]
[ROW][C]28[/C][C]104.46[/C][C]103.238014166754[/C][C]1.2219858332459[/C][/ROW]
[ROW][C]29[/C][C]103.83[/C][C]102.307411381052[/C][C]1.52258861894839[/C][/ROW]
[ROW][C]30[/C][C]101[/C][C]100.581558613844[/C][C]0.418441386155649[/C][/ROW]
[ROW][C]31[/C][C]99.36[/C][C]100.229309238024[/C][C]-0.869309238024243[/C][/ROW]
[ROW][C]32[/C][C]96.71[/C][C]105.688937126656[/C][C]-8.97893712665609[/C][/ROW]
[ROW][C]33[/C][C]95.23[/C][C]100.457249967978[/C][C]-5.22724996797837[/C][/ROW]
[ROW][C]34[/C][C]95.62[/C][C]96.2129244013621[/C][C]-0.59292440136214[/C][/ROW]
[ROW][C]35[/C][C]95.8[/C][C]95.6691190956632[/C][C]0.13088090433682[/C][/ROW]
[ROW][C]36[/C][C]94.79[/C][C]94.190224560165[/C][C]0.599775439834971[/C][/ROW]
[ROW][C]37[/C][C]95.39[/C][C]97.4426574236907[/C][C]-2.0526574236907[/C][/ROW]
[ROW][C]38[/C][C]94.9[/C][C]96.2903588978503[/C][C]-1.39035889785026[/C][/ROW]
[ROW][C]39[/C][C]94.84[/C][C]96.5209413691768[/C][C]-1.68094136917675[/C][/ROW]
[ROW][C]40[/C][C]94.68[/C][C]93.6302911020254[/C][C]1.04970889797463[/C][/ROW]
[ROW][C]41[/C][C]94.17[/C][C]92.5847222039712[/C][C]1.58527779602876[/C][/ROW]
[ROW][C]42[/C][C]94.1[/C][C]90.7260184216088[/C][C]3.37398157839118[/C][/ROW]
[ROW][C]43[/C][C]93.84[/C][C]92.6619647015958[/C][C]1.17803529840415[/C][/ROW]
[ROW][C]44[/C][C]94.2[/C][C]98.5913454708681[/C][C]-4.39134547086815[/C][/ROW]
[ROW][C]45[/C][C]97.76[/C][C]97.8115309642692[/C][C]-0.0515309642691477[/C][/ROW]
[ROW][C]46[/C][C]98.26[/C][C]98.6573680659352[/C][C]-0.397368065935225[/C][/ROW]
[ROW][C]47[/C][C]99.63[/C][C]98.3887224798061[/C][C]1.24127752019393[/C][/ROW]
[ROW][C]48[/C][C]98.75[/C][C]97.9204229438534[/C][C]0.829577056146633[/C][/ROW]
[ROW][C]49[/C][C]100.15[/C][C]100.9574575276[/C][C]-0.807457527599837[/C][/ROW]
[ROW][C]50[/C][C]99.63[/C][C]100.960945930705[/C][C]-1.33094593070463[/C][/ROW]
[ROW][C]51[/C][C]99.72[/C][C]101.197505994394[/C][C]-1.47750599439401[/C][/ROW]
[ROW][C]52[/C][C]98.87[/C][C]98.9008203710407[/C][C]-0.0308203710406474[/C][/ROW]
[ROW][C]53[/C][C]98.4[/C][C]97.0237325672236[/C][C]1.3762674327764[/C][/ROW]
[ROW][C]54[/C][C]97.99[/C][C]95.2636975878104[/C][C]2.7263024121896[/C][/ROW]
[ROW][C]55[/C][C]98.46[/C][C]96.3121219410863[/C][C]2.14787805891373[/C][/ROW]
[ROW][C]56[/C][C]98.73[/C][C]102.202589646825[/C][C]-3.47258964682464[/C][/ROW]
[ROW][C]57[/C][C]98.66[/C][C]102.869881421969[/C][C]-4.20988142196884[/C][/ROW]
[ROW][C]58[/C][C]98.14[/C][C]100.142289853516[/C][C]-2.00228985351616[/C][/ROW]
[ROW][C]59[/C][C]98.39[/C][C]98.7644214840007[/C][C]-0.374421484000706[/C][/ROW]
[ROW][C]60[/C][C]97.78[/C][C]96.8600617039664[/C][C]0.919938296033607[/C][/ROW]
[/TABLE]
Source: https://freestatistics.org/blog/index.php?pk=&T=2

Globally Unique Identifier (entire table): ba.freestatistics.org/blog/index.php?pk=&T=2

As an alternative you can also use a QR Code:  

The GUIDs for individual cells are displayed in the table below:

Interpolation Forecasts of Exponential Smoothing
tObservedFittedResiduals
13101.1697.50625267094023.65374732905981
14101.8101.5387198732780.261280126722426
15103.31103.683460238584-0.373460238583931
16101.19101.45643686718-0.266436867180389
1799.0999.2526024616152-0.162602461615194
1895.9196.1068549630581-0.196854963058087
1994.5695.3207078502209-0.760707850220882
2095.76101.665313059375-5.90531305937498
21100.3697.71715715153992.64284284846009
22102.67100.1590327456372.51096725436341
23103.58102.4687548426361.11124515736402
24100.89102.206913933537-1.31691393353714
25103.46103.680859827134-0.220859827133992
26104.86103.9106345305380.949365469462464
27104.88106.537608385503-1.65760838550334
28104.46103.2380141667541.2219858332459
29103.83102.3074113810521.52258861894839
30101100.5815586138440.418441386155649
3199.36100.229309238024-0.869309238024243
3296.71105.688937126656-8.97893712665609
3395.23100.457249967978-5.22724996797837
3495.6296.2129244013621-0.59292440136214
3595.895.66911909566320.13088090433682
3694.7994.1902245601650.599775439834971
3795.3997.4426574236907-2.0526574236907
3894.996.2903588978503-1.39035889785026
3994.8496.5209413691768-1.68094136917675
4094.6893.63029110202541.04970889797463
4194.1792.58472220397121.58527779602876
4294.190.72601842160883.37398157839118
4393.8492.66196470159581.17803529840415
4494.298.5913454708681-4.39134547086815
4597.7697.8115309642692-0.0515309642691477
4698.2698.6573680659352-0.397368065935225
4799.6398.38872247980611.24127752019393
4898.7597.92042294385340.829577056146633
49100.15100.9574575276-0.807457527599837
5099.63100.960945930705-1.33094593070463
5199.72101.197505994394-1.47750599439401
5298.8798.9008203710407-0.0308203710406474
5398.497.02373256722361.3762674327764
5497.9995.26369758781042.7263024121896
5598.4696.31212194108632.14787805891373
5698.73102.202589646825-3.47258964682464
5798.66102.869881421969-4.20988142196884
5898.14100.142289853516-2.00228985351616
5998.3998.7644214840007-0.374421484000706
6097.7896.86006170396640.919938296033607


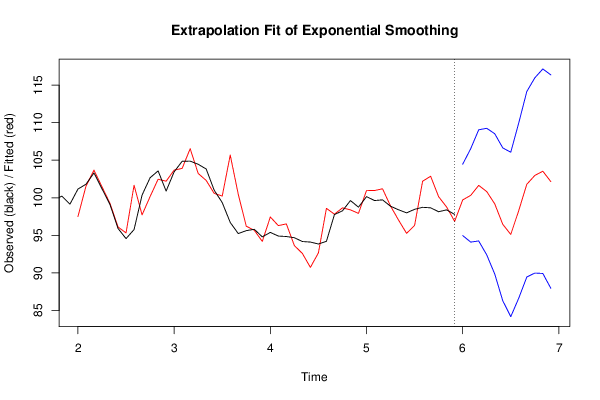
Extrapolation Forecasts of Exponential Smoothing
tForecast95% Lower Bound95% Upper Bound
6199.715043269053594.9693320606964104.460754477411
62100.31546212694294.0972029002705106.533721353613
63101.65105401779594.2452017255232109.056906310067
64100.82444824267392.3946490927959109.254247392551
6599.187810879979189.8437549005566108.531866859402
6696.468107013565386.2898806831873106.646333343943
6795.11511633793284.1644871914278106.065745484436
6898.313731256619786.6401978454494109.98726466779
69101.79909730171189.4434653970179114.154729206403
70102.97122225989289.9678731208641115.974571398919
71103.53839263101989.9168006813673117.159984580671
72102.1511868770187.9369787478918116.365395006127

\begin{tabular}{lllllllll}
\hline
Extrapolation Forecasts of Exponential Smoothing \tabularnewline
t & Forecast & 95% Lower Bound & 95% Upper Bound \tabularnewline
61 & 99.7150432690535 & 94.9693320606964 & 104.460754477411 \tabularnewline
62 & 100.315462126942 & 94.0972029002705 & 106.533721353613 \tabularnewline
63 & 101.651054017795 & 94.2452017255232 & 109.056906310067 \tabularnewline
64 & 100.824448242673 & 92.3946490927959 & 109.254247392551 \tabularnewline
65 & 99.1878108799791 & 89.8437549005566 & 108.531866859402 \tabularnewline
66 & 96.4681070135653 & 86.2898806831873 & 106.646333343943 \tabularnewline
67 & 95.115116337932 & 84.1644871914278 & 106.065745484436 \tabularnewline
68 & 98.3137312566197 & 86.6401978454494 & 109.98726466779 \tabularnewline
69 & 101.799097301711 & 89.4434653970179 & 114.154729206403 \tabularnewline
70 & 102.971222259892 & 89.9678731208641 & 115.974571398919 \tabularnewline
71 & 103.538392631019 & 89.9168006813673 & 117.159984580671 \tabularnewline
72 & 102.15118687701 & 87.9369787478918 & 116.365395006127 \tabularnewline
\hline
\end{tabular}
%Source: https://freestatistics.org/blog/index.php?pk=&T=3

[TABLE]
[ROW][C]Extrapolation Forecasts of Exponential Smoothing[/C][/ROW]
[ROW][C]t[/C][C]Forecast[/C][C]95% Lower Bound[/C][C]95% Upper Bound[/C][/ROW]
[ROW][C]61[/C][C]99.7150432690535[/C][C]94.9693320606964[/C][C]104.460754477411[/C][/ROW]
[ROW][C]62[/C][C]100.315462126942[/C][C]94.0972029002705[/C][C]106.533721353613[/C][/ROW]
[ROW][C]63[/C][C]101.651054017795[/C][C]94.2452017255232[/C][C]109.056906310067[/C][/ROW]
[ROW][C]64[/C][C]100.824448242673[/C][C]92.3946490927959[/C][C]109.254247392551[/C][/ROW]
[ROW][C]65[/C][C]99.1878108799791[/C][C]89.8437549005566[/C][C]108.531866859402[/C][/ROW]
[ROW][C]66[/C][C]96.4681070135653[/C][C]86.2898806831873[/C][C]106.646333343943[/C][/ROW]
[ROW][C]67[/C][C]95.115116337932[/C][C]84.1644871914278[/C][C]106.065745484436[/C][/ROW]
[ROW][C]68[/C][C]98.3137312566197[/C][C]86.6401978454494[/C][C]109.98726466779[/C][/ROW]
[ROW][C]69[/C][C]101.799097301711[/C][C]89.4434653970179[/C][C]114.154729206403[/C][/ROW]
[ROW][C]70[/C][C]102.971222259892[/C][C]89.9678731208641[/C][C]115.974571398919[/C][/ROW]
[ROW][C]71[/C][C]103.538392631019[/C][C]89.9168006813673[/C][C]117.159984580671[/C][/ROW]
[ROW][C]72[/C][C]102.15118687701[/C][C]87.9369787478918[/C][C]116.365395006127[/C][/ROW]
[/TABLE]
Source: https://freestatistics.org/blog/index.php?pk=&T=3

Globally Unique Identifier (entire table): ba.freestatistics.org/blog/index.php?pk=&T=3

As an alternative you can also use a QR Code:  

The GUIDs for individual cells are displayed in the table below:

Extrapolation Forecasts of Exponential Smoothing
tForecast95% Lower Bound95% Upper Bound
6199.715043269053594.9693320606964104.460754477411
62100.31546212694294.0972029002705106.533721353613
63101.65105401779594.2452017255232109.056906310067
64100.82444824267392.3946490927959109.254247392551
6599.187810879979189.8437549005566108.531866859402
6696.468107013565386.2898806831873106.646333343943
6795.11511633793284.1644871914278106.065745484436
6898.313731256619786.6401978454494109.98726466779
69101.79909730171189.4434653970179114.154729206403
70102.97122225989289.9678731208641115.974571398919
71103.53839263101989.9168006813673117.159984580671
72102.1511868770187.9369787478918116.365395006127


Parameters (Session):
par1 = 12 ; par2 = Triple ; par3 = additive ;
Parameters (R input):
par1 = 12 ; par2 = Triple ; par3 = additive ;
R code (references can be found in the software module):
par3 <- 'additive'
par2 <- 'Triple'
par1 <- '12'
par1 <- as.numeric(par1)
if (par2 == 'Single') K <- 1
if (par2 == 'Double') K <- 2
if (par2 == 'Triple') K <- par1
nx <- length(x)
nxmK <- nx - K
x <- ts(x, frequency = par1)
if (par2 == 'Single') fit <- HoltWinters(x, gamma=F, beta=F)
if (par2 == 'Double') fit <- HoltWinters(x, gamma=F)
if (par2 == 'Triple') fit <- HoltWinters(x, seasonal=par3)
fit
myresid <- x - fit$fitted[,'xhat']
bitmap(file='test1.png')
op <- par(mfrow=c(2,1))
plot(fit,ylab='Observed (black) / Fitted (red)',main='Interpolation Fit of Exponential Smoothing')
plot(myresid,ylab='Residuals',main='Interpolation Prediction Errors')
par(op)
dev.off()
bitmap(file='test2.png')
p <- predict(fit, par1, prediction.interval=TRUE)
np <- length(p[,1])
plot(fit,p,ylab='Observed (black) / Fitted (red)',main='Extrapolation Fit of Exponential Smoothing')
dev.off()
bitmap(file='test3.png')
op <- par(mfrow = c(2,2))
acf(as.numeric(myresid),lag.max = nx/2,main='Residual ACF')
spectrum(myresid,main='Residals Periodogram')
cpgram(myresid,main='Residal Cumulative Periodogram')
qqnorm(myresid,main='Residual Normal QQ Plot')
qqline(myresid)
par(op)
dev.off()
load(file='createtable')
a<-table.start()
a<-table.row.start(a)
a<-table.element(a,'Estimated Parameters of Exponential Smoothing',2,TRUE)
a<-table.row.end(a)
a<-table.row.start(a)
a<-table.element(a,'Parameter',header=TRUE)
a<-table.element(a,'Value',header=TRUE)
a<-table.row.end(a)
a<-table.row.start(a)
a<-table.element(a,'alpha',header=TRUE)
a<-table.element(a,fit$alpha)
a<-table.row.end(a)
a<-table.row.start(a)
a<-table.element(a,'beta',header=TRUE)
a<-table.element(a,fit$beta)
a<-table.row.end(a)
a<-table.row.start(a)
a<-table.element(a,'gamma',header=TRUE)
a<-table.element(a,fit$gamma)
a<-table.row.end(a)
a<-table.end(a)
table.save(a,file='mytable.tab')
a<-table.start()
a<-table.row.start(a)
a<-table.element(a,'Interpolation Forecasts of Exponential Smoothing',4,TRUE)
a<-table.row.end(a)
a<-table.row.start(a)
a<-table.element(a,'t',header=TRUE)
a<-table.element(a,'Observed',header=TRUE)
a<-table.element(a,'Fitted',header=TRUE)
a<-table.element(a,'Residuals',header=TRUE)
a<-table.row.end(a)
for (i in 1:nxmK) {
a<-table.row.start(a)
a<-table.element(a,i+K,header=TRUE)
a<-table.element(a,x[i+K])
a<-table.element(a,fit$fitted[i,'xhat'])
a<-table.element(a,myresid[i])
a<-table.row.end(a)
}
a<-table.end(a)
table.save(a,file='mytable1.tab')
a<-table.start()
a<-table.row.start(a)
a<-table.element(a,'Extrapolation Forecasts of Exponential Smoothing',4,TRUE)
a<-table.row.end(a)
a<-table.row.start(a)
a<-table.element(a,'t',header=TRUE)
a<-table.element(a,'Forecast',header=TRUE)
a<-table.element(a,'95% Lower Bound',header=TRUE)
a<-table.element(a,'95% Upper Bound',header=TRUE)
a<-table.row.end(a)
for (i in 1:np) {
a<-table.row.start(a)
a<-table.element(a,nx+i,header=TRUE)
a<-table.element(a,p[i,'fit'])
a<-table.element(a,p[i,'lwr'])
a<-table.element(a,p[i,'upr'])
a<-table.row.end(a)
}
a<-table.end(a)
table.save(a,file='mytable2.tab')