Free Statistics

of Irreproducible Research!

Author's title

Author*Unverified author*
R Software Modulerwasp_autocorrelation.wasp
Title produced by software(Partial) Autocorrelation Function
Date of computationThu, 05 Jan 2017 17:58:31 +0000
Cite this page as followsStatistical Computations at FreeStatistics.org, Office for Research Development and Education, URL https://freestatistics.org/blog/index.php?v=date/2017/Jan/05/t1483639181jttvhkiqxlsjns5.htm/, Retrieved Tue, 14 May 2024 06:23:31 +0200
Statistical Computations at FreeStatistics.org, Office for Research Development and Education, URL https://freestatistics.org/blog/index.php?pk=, Retrieved Tue, 14 May 2024 06:23:31 +0200
QR Codes:

Original text written by user:
IsPrivate?No (this computation is public)
User-defined keywords
Estimated Impact0
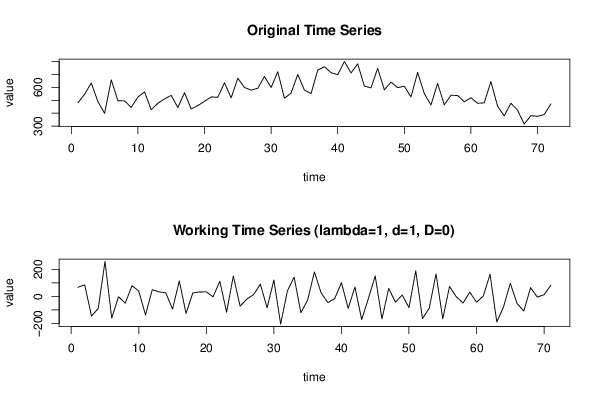
Dataseries X:
480
548
634
489
399
658
497
495
445
525
565
427
477
511
538
444
559
433
459
492
526
523
636
519
671
599
579
593
684
599
721
516
556
700
579
552
734
760
714
698
800
712
782
610
596
748
581
641
598
609
526
716
552
464
631
465
539
537
488
520
477
480
645
455
379
477
424
316
381
376
389
472


Summary of computational transaction
Raw Inputview raw input (R code)
Raw Outputview raw output of R engine
Computing time1 seconds
R Server'Sir Ronald Aylmer Fisher' @ fisher.wessa.net

\begin{tabular}{lllllllll}
\hline
Summary of computational transaction \tabularnewline
Raw Input & view raw input (R code)  \tabularnewline
Raw Output & view raw output of R engine  \tabularnewline
Computing time & 1 seconds \tabularnewline
R Server & 'Sir Ronald Aylmer Fisher' @ fisher.wessa.net \tabularnewline
\hline
\end{tabular}
%Source: https://freestatistics.org/blog/index.php?pk=&T=0

[TABLE]
[ROW][C]Summary of computational transaction[/C][/ROW]
[ROW][C]Raw Input[/C][C]view raw input (R code) [/C][/ROW]
[ROW][C]Raw Output[/C][C]view raw output of R engine [/C][/ROW]
[ROW][C]Computing time[/C][C]1 seconds[/C][/ROW]
[ROW][C]R Server[/C][C]'Sir Ronald Aylmer Fisher' @ fisher.wessa.net[/C][/ROW]
[/TABLE]
Source: https://freestatistics.org/blog/index.php?pk=&T=0

Globally Unique Identifier (entire table): ba.freestatistics.org/blog/index.php?pk=&T=0

As an alternative you can also use a QR Code:  

The GUIDs for individual cells are displayed in the table below:

Summary of computational transaction
Raw Inputview raw input (R code)
Raw Outputview raw output of R engine
Computing time1 seconds
R Server'Sir Ronald Aylmer Fisher' @ fisher.wessa.net


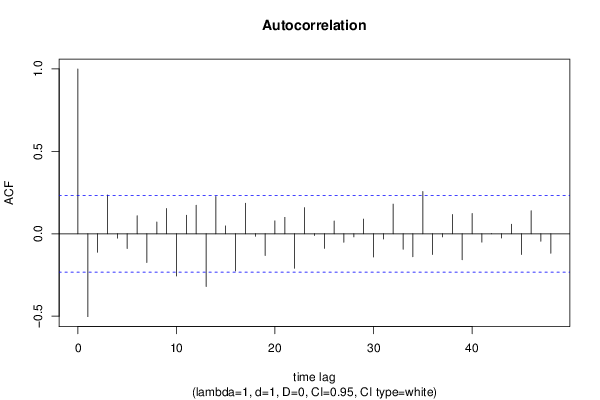
Autocorrelation Function
Time lag kACF(k)T-STATP-value
1-0.502552-4.23463.4e-05
2-0.111503-0.93950.17532
30.2353451.98310.025615
4-0.026309-0.22170.412597
5-0.089514-0.75430.226593
60.1096980.92430.179222
7-0.174008-1.46620.073503
80.0720770.60730.272786
90.1539771.29740.099342
10-0.255878-2.15610.017234
110.1121850.94530.173858
120.1732641.45990.074358
13-0.319984-2.69620.004376
140.2261341.90540.030386
150.0479650.40420.343654
16-0.225849-1.9030.030545
170.1854281.56240.061315
18-0.015227-0.12830.449136
19-0.131721-1.10990.135394
200.0783350.66010.255676
210.0997430.84040.201739
22-0.208918-1.76040.041326
230.1589721.33950.092336
24-0.010771-0.09080.463969
25-0.088452-0.74530.229272
260.0776780.65450.257443
27-0.051575-0.43460.332592
28-0.018849-0.15880.437129
290.0892790.75230.227186
30-0.141248-1.19020.11897
31-0.031957-0.26930.39425
320.180261.51890.066615
33-0.093716-0.78970.216175
34-0.139648-1.17670.121623
350.2569462.16510.016873
36-0.125797-1.060.146373
37-0.01867-0.15730.437722
380.1172110.98760.163341
39-0.157529-1.32740.094321
400.1230631.03690.15164
41-0.050622-0.42650.3355
420.000330.00280.498893
43-0.02579-0.21730.414295
440.0580920.48950.313
45-0.125276-1.05560.147367
460.1398871.17870.121225
47-0.045403-0.38260.351589
48-0.117862-0.99310.162012

\begin{tabular}{lllllllll}
\hline
Autocorrelation Function \tabularnewline
Time lag k & ACF(k) & T-STAT & P-value \tabularnewline
1 & -0.502552 & -4.2346 & 3.4e-05 \tabularnewline
2 & -0.111503 & -0.9395 & 0.17532 \tabularnewline
3 & 0.235345 & 1.9831 & 0.025615 \tabularnewline
4 & -0.026309 & -0.2217 & 0.412597 \tabularnewline
5 & -0.089514 & -0.7543 & 0.226593 \tabularnewline
6 & 0.109698 & 0.9243 & 0.179222 \tabularnewline
7 & -0.174008 & -1.4662 & 0.073503 \tabularnewline
8 & 0.072077 & 0.6073 & 0.272786 \tabularnewline
9 & 0.153977 & 1.2974 & 0.099342 \tabularnewline
10 & -0.255878 & -2.1561 & 0.017234 \tabularnewline
11 & 0.112185 & 0.9453 & 0.173858 \tabularnewline
12 & 0.173264 & 1.4599 & 0.074358 \tabularnewline
13 & -0.319984 & -2.6962 & 0.004376 \tabularnewline
14 & 0.226134 & 1.9054 & 0.030386 \tabularnewline
15 & 0.047965 & 0.4042 & 0.343654 \tabularnewline
16 & -0.225849 & -1.903 & 0.030545 \tabularnewline
17 & 0.185428 & 1.5624 & 0.061315 \tabularnewline
18 & -0.015227 & -0.1283 & 0.449136 \tabularnewline
19 & -0.131721 & -1.1099 & 0.135394 \tabularnewline
20 & 0.078335 & 0.6601 & 0.255676 \tabularnewline
21 & 0.099743 & 0.8404 & 0.201739 \tabularnewline
22 & -0.208918 & -1.7604 & 0.041326 \tabularnewline
23 & 0.158972 & 1.3395 & 0.092336 \tabularnewline
24 & -0.010771 & -0.0908 & 0.463969 \tabularnewline
25 & -0.088452 & -0.7453 & 0.229272 \tabularnewline
26 & 0.077678 & 0.6545 & 0.257443 \tabularnewline
27 & -0.051575 & -0.4346 & 0.332592 \tabularnewline
28 & -0.018849 & -0.1588 & 0.437129 \tabularnewline
29 & 0.089279 & 0.7523 & 0.227186 \tabularnewline
30 & -0.141248 & -1.1902 & 0.11897 \tabularnewline
31 & -0.031957 & -0.2693 & 0.39425 \tabularnewline
32 & 0.18026 & 1.5189 & 0.066615 \tabularnewline
33 & -0.093716 & -0.7897 & 0.216175 \tabularnewline
34 & -0.139648 & -1.1767 & 0.121623 \tabularnewline
35 & 0.256946 & 2.1651 & 0.016873 \tabularnewline
36 & -0.125797 & -1.06 & 0.146373 \tabularnewline
37 & -0.01867 & -0.1573 & 0.437722 \tabularnewline
38 & 0.117211 & 0.9876 & 0.163341 \tabularnewline
39 & -0.157529 & -1.3274 & 0.094321 \tabularnewline
40 & 0.123063 & 1.0369 & 0.15164 \tabularnewline
41 & -0.050622 & -0.4265 & 0.3355 \tabularnewline
42 & 0.00033 & 0.0028 & 0.498893 \tabularnewline
43 & -0.02579 & -0.2173 & 0.414295 \tabularnewline
44 & 0.058092 & 0.4895 & 0.313 \tabularnewline
45 & -0.125276 & -1.0556 & 0.147367 \tabularnewline
46 & 0.139887 & 1.1787 & 0.121225 \tabularnewline
47 & -0.045403 & -0.3826 & 0.351589 \tabularnewline
48 & -0.117862 & -0.9931 & 0.162012 \tabularnewline
\hline
\end{tabular}
%Source: https://freestatistics.org/blog/index.php?pk=&T=1

[TABLE]
[ROW][C]Autocorrelation Function[/C][/ROW]
[ROW][C]Time lag k[/C][C]ACF(k)[/C][C]T-STAT[/C][C]P-value[/C][/ROW]
[ROW][C]1[/C][C]-0.502552[/C][C]-4.2346[/C][C]3.4e-05[/C][/ROW]
[ROW][C]2[/C][C]-0.111503[/C][C]-0.9395[/C][C]0.17532[/C][/ROW]
[ROW][C]3[/C][C]0.235345[/C][C]1.9831[/C][C]0.025615[/C][/ROW]
[ROW][C]4[/C][C]-0.026309[/C][C]-0.2217[/C][C]0.412597[/C][/ROW]
[ROW][C]5[/C][C]-0.089514[/C][C]-0.7543[/C][C]0.226593[/C][/ROW]
[ROW][C]6[/C][C]0.109698[/C][C]0.9243[/C][C]0.179222[/C][/ROW]
[ROW][C]7[/C][C]-0.174008[/C][C]-1.4662[/C][C]0.073503[/C][/ROW]
[ROW][C]8[/C][C]0.072077[/C][C]0.6073[/C][C]0.272786[/C][/ROW]
[ROW][C]9[/C][C]0.153977[/C][C]1.2974[/C][C]0.099342[/C][/ROW]
[ROW][C]10[/C][C]-0.255878[/C][C]-2.1561[/C][C]0.017234[/C][/ROW]
[ROW][C]11[/C][C]0.112185[/C][C]0.9453[/C][C]0.173858[/C][/ROW]
[ROW][C]12[/C][C]0.173264[/C][C]1.4599[/C][C]0.074358[/C][/ROW]
[ROW][C]13[/C][C]-0.319984[/C][C]-2.6962[/C][C]0.004376[/C][/ROW]
[ROW][C]14[/C][C]0.226134[/C][C]1.9054[/C][C]0.030386[/C][/ROW]
[ROW][C]15[/C][C]0.047965[/C][C]0.4042[/C][C]0.343654[/C][/ROW]
[ROW][C]16[/C][C]-0.225849[/C][C]-1.903[/C][C]0.030545[/C][/ROW]
[ROW][C]17[/C][C]0.185428[/C][C]1.5624[/C][C]0.061315[/C][/ROW]
[ROW][C]18[/C][C]-0.015227[/C][C]-0.1283[/C][C]0.449136[/C][/ROW]
[ROW][C]19[/C][C]-0.131721[/C][C]-1.1099[/C][C]0.135394[/C][/ROW]
[ROW][C]20[/C][C]0.078335[/C][C]0.6601[/C][C]0.255676[/C][/ROW]
[ROW][C]21[/C][C]0.099743[/C][C]0.8404[/C][C]0.201739[/C][/ROW]
[ROW][C]22[/C][C]-0.208918[/C][C]-1.7604[/C][C]0.041326[/C][/ROW]
[ROW][C]23[/C][C]0.158972[/C][C]1.3395[/C][C]0.092336[/C][/ROW]
[ROW][C]24[/C][C]-0.010771[/C][C]-0.0908[/C][C]0.463969[/C][/ROW]
[ROW][C]25[/C][C]-0.088452[/C][C]-0.7453[/C][C]0.229272[/C][/ROW]
[ROW][C]26[/C][C]0.077678[/C][C]0.6545[/C][C]0.257443[/C][/ROW]
[ROW][C]27[/C][C]-0.051575[/C][C]-0.4346[/C][C]0.332592[/C][/ROW]
[ROW][C]28[/C][C]-0.018849[/C][C]-0.1588[/C][C]0.437129[/C][/ROW]
[ROW][C]29[/C][C]0.089279[/C][C]0.7523[/C][C]0.227186[/C][/ROW]
[ROW][C]30[/C][C]-0.141248[/C][C]-1.1902[/C][C]0.11897[/C][/ROW]
[ROW][C]31[/C][C]-0.031957[/C][C]-0.2693[/C][C]0.39425[/C][/ROW]
[ROW][C]32[/C][C]0.18026[/C][C]1.5189[/C][C]0.066615[/C][/ROW]
[ROW][C]33[/C][C]-0.093716[/C][C]-0.7897[/C][C]0.216175[/C][/ROW]
[ROW][C]34[/C][C]-0.139648[/C][C]-1.1767[/C][C]0.121623[/C][/ROW]
[ROW][C]35[/C][C]0.256946[/C][C]2.1651[/C][C]0.016873[/C][/ROW]
[ROW][C]36[/C][C]-0.125797[/C][C]-1.06[/C][C]0.146373[/C][/ROW]
[ROW][C]37[/C][C]-0.01867[/C][C]-0.1573[/C][C]0.437722[/C][/ROW]
[ROW][C]38[/C][C]0.117211[/C][C]0.9876[/C][C]0.163341[/C][/ROW]
[ROW][C]39[/C][C]-0.157529[/C][C]-1.3274[/C][C]0.094321[/C][/ROW]
[ROW][C]40[/C][C]0.123063[/C][C]1.0369[/C][C]0.15164[/C][/ROW]
[ROW][C]41[/C][C]-0.050622[/C][C]-0.4265[/C][C]0.3355[/C][/ROW]
[ROW][C]42[/C][C]0.00033[/C][C]0.0028[/C][C]0.498893[/C][/ROW]
[ROW][C]43[/C][C]-0.02579[/C][C]-0.2173[/C][C]0.414295[/C][/ROW]
[ROW][C]44[/C][C]0.058092[/C][C]0.4895[/C][C]0.313[/C][/ROW]
[ROW][C]45[/C][C]-0.125276[/C][C]-1.0556[/C][C]0.147367[/C][/ROW]
[ROW][C]46[/C][C]0.139887[/C][C]1.1787[/C][C]0.121225[/C][/ROW]
[ROW][C]47[/C][C]-0.045403[/C][C]-0.3826[/C][C]0.351589[/C][/ROW]
[ROW][C]48[/C][C]-0.117862[/C][C]-0.9931[/C][C]0.162012[/C][/ROW]
[/TABLE]
Source: https://freestatistics.org/blog/index.php?pk=&T=1

Globally Unique Identifier (entire table): ba.freestatistics.org/blog/index.php?pk=&T=1

As an alternative you can also use a QR Code:  

The GUIDs for individual cells are displayed in the table below:

Autocorrelation Function
Time lag kACF(k)T-STATP-value
1-0.502552-4.23463.4e-05
2-0.111503-0.93950.17532
30.2353451.98310.025615
4-0.026309-0.22170.412597
5-0.089514-0.75430.226593
60.1096980.92430.179222
7-0.174008-1.46620.073503
80.0720770.60730.272786
90.1539771.29740.099342
10-0.255878-2.15610.017234
110.1121850.94530.173858
120.1732641.45990.074358
13-0.319984-2.69620.004376
140.2261341.90540.030386
150.0479650.40420.343654
16-0.225849-1.9030.030545
170.1854281.56240.061315
18-0.015227-0.12830.449136
19-0.131721-1.10990.135394
200.0783350.66010.255676
210.0997430.84040.201739
22-0.208918-1.76040.041326
230.1589721.33950.092336
24-0.010771-0.09080.463969
25-0.088452-0.74530.229272
260.0776780.65450.257443
27-0.051575-0.43460.332592
28-0.018849-0.15880.437129
290.0892790.75230.227186
30-0.141248-1.19020.11897
31-0.031957-0.26930.39425
320.180261.51890.066615
33-0.093716-0.78970.216175
34-0.139648-1.17670.121623
350.2569462.16510.016873
36-0.125797-1.060.146373
37-0.01867-0.15730.437722
380.1172110.98760.163341
39-0.157529-1.32740.094321
400.1230631.03690.15164
41-0.050622-0.42650.3355
420.000330.00280.498893
43-0.02579-0.21730.414295
440.0580920.48950.313
45-0.125276-1.05560.147367
460.1398871.17870.121225
47-0.045403-0.38260.351589
48-0.117862-0.99310.162012


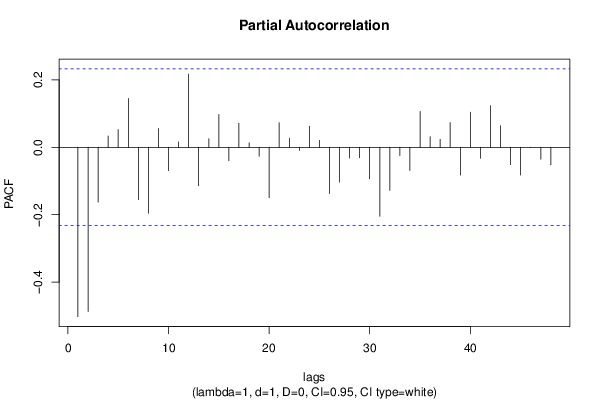
Partial Autocorrelation Function
Time lag kPACF(k)T-STATP-value
1-0.502552-4.23463.4e-05
2-0.487076-4.10425.3e-05
3-0.162712-1.3710.087341
40.0334820.28210.389334
50.0524970.44230.329791
60.1450251.2220.112874
7-0.155355-1.3090.097371
8-0.195785-1.64970.05171
90.0557030.46940.320126
10-0.06923-0.58330.280756
110.0156360.13170.447778
120.2172391.83050.035687
13-0.114092-0.96140.169817
140.0254880.21480.415282
150.0976680.8230.206641
16-0.039671-0.33430.369579
170.0711330.59940.275415
180.0135990.11460.454548
19-0.026745-0.22540.411176
20-0.14948-1.25950.10598
210.0732240.6170.269605
220.0267910.22570.411025
23-0.009416-0.07930.468492
240.0624710.52640.30013
250.020530.1730.431575
26-0.13717-1.15580.125816
27-0.103404-0.87130.193265
28-0.031943-0.26920.394296
29-0.030888-0.26030.397704
30-0.093366-0.78670.217032
31-0.204433-1.72260.044659
32-0.127803-1.07690.142587
33-0.024359-0.20520.418982
34-0.068659-0.57850.282368
350.1063350.8960.186641
360.0316550.26670.395227
370.0236820.19950.421203
380.0733990.61850.269121
39-0.08238-0.69410.244928
400.1042510.87840.191335
41-0.032433-0.27330.392713
420.1233221.03910.151135
430.0641120.54020.295369
44-0.051295-0.43220.333447
45-0.082194-0.69260.245417
46-0.000799-0.00670.497324
47-0.035597-0.29990.382548
48-0.051627-0.4350.332435

\begin{tabular}{lllllllll}
\hline
Partial Autocorrelation Function \tabularnewline
Time lag k & PACF(k) & T-STAT & P-value \tabularnewline
1 & -0.502552 & -4.2346 & 3.4e-05 \tabularnewline
2 & -0.487076 & -4.1042 & 5.3e-05 \tabularnewline
3 & -0.162712 & -1.371 & 0.087341 \tabularnewline
4 & 0.033482 & 0.2821 & 0.389334 \tabularnewline
5 & 0.052497 & 0.4423 & 0.329791 \tabularnewline
6 & 0.145025 & 1.222 & 0.112874 \tabularnewline
7 & -0.155355 & -1.309 & 0.097371 \tabularnewline
8 & -0.195785 & -1.6497 & 0.05171 \tabularnewline
9 & 0.055703 & 0.4694 & 0.320126 \tabularnewline
10 & -0.06923 & -0.5833 & 0.280756 \tabularnewline
11 & 0.015636 & 0.1317 & 0.447778 \tabularnewline
12 & 0.217239 & 1.8305 & 0.035687 \tabularnewline
13 & -0.114092 & -0.9614 & 0.169817 \tabularnewline
14 & 0.025488 & 0.2148 & 0.415282 \tabularnewline
15 & 0.097668 & 0.823 & 0.206641 \tabularnewline
16 & -0.039671 & -0.3343 & 0.369579 \tabularnewline
17 & 0.071133 & 0.5994 & 0.275415 \tabularnewline
18 & 0.013599 & 0.1146 & 0.454548 \tabularnewline
19 & -0.026745 & -0.2254 & 0.411176 \tabularnewline
20 & -0.14948 & -1.2595 & 0.10598 \tabularnewline
21 & 0.073224 & 0.617 & 0.269605 \tabularnewline
22 & 0.026791 & 0.2257 & 0.411025 \tabularnewline
23 & -0.009416 & -0.0793 & 0.468492 \tabularnewline
24 & 0.062471 & 0.5264 & 0.30013 \tabularnewline
25 & 0.02053 & 0.173 & 0.431575 \tabularnewline
26 & -0.13717 & -1.1558 & 0.125816 \tabularnewline
27 & -0.103404 & -0.8713 & 0.193265 \tabularnewline
28 & -0.031943 & -0.2692 & 0.394296 \tabularnewline
29 & -0.030888 & -0.2603 & 0.397704 \tabularnewline
30 & -0.093366 & -0.7867 & 0.217032 \tabularnewline
31 & -0.204433 & -1.7226 & 0.044659 \tabularnewline
32 & -0.127803 & -1.0769 & 0.142587 \tabularnewline
33 & -0.024359 & -0.2052 & 0.418982 \tabularnewline
34 & -0.068659 & -0.5785 & 0.282368 \tabularnewline
35 & 0.106335 & 0.896 & 0.186641 \tabularnewline
36 & 0.031655 & 0.2667 & 0.395227 \tabularnewline
37 & 0.023682 & 0.1995 & 0.421203 \tabularnewline
38 & 0.073399 & 0.6185 & 0.269121 \tabularnewline
39 & -0.08238 & -0.6941 & 0.244928 \tabularnewline
40 & 0.104251 & 0.8784 & 0.191335 \tabularnewline
41 & -0.032433 & -0.2733 & 0.392713 \tabularnewline
42 & 0.123322 & 1.0391 & 0.151135 \tabularnewline
43 & 0.064112 & 0.5402 & 0.295369 \tabularnewline
44 & -0.051295 & -0.4322 & 0.333447 \tabularnewline
45 & -0.082194 & -0.6926 & 0.245417 \tabularnewline
46 & -0.000799 & -0.0067 & 0.497324 \tabularnewline
47 & -0.035597 & -0.2999 & 0.382548 \tabularnewline
48 & -0.051627 & -0.435 & 0.332435 \tabularnewline
\hline
\end{tabular}
%Source: https://freestatistics.org/blog/index.php?pk=&T=2

[TABLE]
[ROW][C]Partial Autocorrelation Function[/C][/ROW]
[ROW][C]Time lag k[/C][C]PACF(k)[/C][C]T-STAT[/C][C]P-value[/C][/ROW]
[ROW][C]1[/C][C]-0.502552[/C][C]-4.2346[/C][C]3.4e-05[/C][/ROW]
[ROW][C]2[/C][C]-0.487076[/C][C]-4.1042[/C][C]5.3e-05[/C][/ROW]
[ROW][C]3[/C][C]-0.162712[/C][C]-1.371[/C][C]0.087341[/C][/ROW]
[ROW][C]4[/C][C]0.033482[/C][C]0.2821[/C][C]0.389334[/C][/ROW]
[ROW][C]5[/C][C]0.052497[/C][C]0.4423[/C][C]0.329791[/C][/ROW]
[ROW][C]6[/C][C]0.145025[/C][C]1.222[/C][C]0.112874[/C][/ROW]
[ROW][C]7[/C][C]-0.155355[/C][C]-1.309[/C][C]0.097371[/C][/ROW]
[ROW][C]8[/C][C]-0.195785[/C][C]-1.6497[/C][C]0.05171[/C][/ROW]
[ROW][C]9[/C][C]0.055703[/C][C]0.4694[/C][C]0.320126[/C][/ROW]
[ROW][C]10[/C][C]-0.06923[/C][C]-0.5833[/C][C]0.280756[/C][/ROW]
[ROW][C]11[/C][C]0.015636[/C][C]0.1317[/C][C]0.447778[/C][/ROW]
[ROW][C]12[/C][C]0.217239[/C][C]1.8305[/C][C]0.035687[/C][/ROW]
[ROW][C]13[/C][C]-0.114092[/C][C]-0.9614[/C][C]0.169817[/C][/ROW]
[ROW][C]14[/C][C]0.025488[/C][C]0.2148[/C][C]0.415282[/C][/ROW]
[ROW][C]15[/C][C]0.097668[/C][C]0.823[/C][C]0.206641[/C][/ROW]
[ROW][C]16[/C][C]-0.039671[/C][C]-0.3343[/C][C]0.369579[/C][/ROW]
[ROW][C]17[/C][C]0.071133[/C][C]0.5994[/C][C]0.275415[/C][/ROW]
[ROW][C]18[/C][C]0.013599[/C][C]0.1146[/C][C]0.454548[/C][/ROW]
[ROW][C]19[/C][C]-0.026745[/C][C]-0.2254[/C][C]0.411176[/C][/ROW]
[ROW][C]20[/C][C]-0.14948[/C][C]-1.2595[/C][C]0.10598[/C][/ROW]
[ROW][C]21[/C][C]0.073224[/C][C]0.617[/C][C]0.269605[/C][/ROW]
[ROW][C]22[/C][C]0.026791[/C][C]0.2257[/C][C]0.411025[/C][/ROW]
[ROW][C]23[/C][C]-0.009416[/C][C]-0.0793[/C][C]0.468492[/C][/ROW]
[ROW][C]24[/C][C]0.062471[/C][C]0.5264[/C][C]0.30013[/C][/ROW]
[ROW][C]25[/C][C]0.02053[/C][C]0.173[/C][C]0.431575[/C][/ROW]
[ROW][C]26[/C][C]-0.13717[/C][C]-1.1558[/C][C]0.125816[/C][/ROW]
[ROW][C]27[/C][C]-0.103404[/C][C]-0.8713[/C][C]0.193265[/C][/ROW]
[ROW][C]28[/C][C]-0.031943[/C][C]-0.2692[/C][C]0.394296[/C][/ROW]
[ROW][C]29[/C][C]-0.030888[/C][C]-0.2603[/C][C]0.397704[/C][/ROW]
[ROW][C]30[/C][C]-0.093366[/C][C]-0.7867[/C][C]0.217032[/C][/ROW]
[ROW][C]31[/C][C]-0.204433[/C][C]-1.7226[/C][C]0.044659[/C][/ROW]
[ROW][C]32[/C][C]-0.127803[/C][C]-1.0769[/C][C]0.142587[/C][/ROW]
[ROW][C]33[/C][C]-0.024359[/C][C]-0.2052[/C][C]0.418982[/C][/ROW]
[ROW][C]34[/C][C]-0.068659[/C][C]-0.5785[/C][C]0.282368[/C][/ROW]
[ROW][C]35[/C][C]0.106335[/C][C]0.896[/C][C]0.186641[/C][/ROW]
[ROW][C]36[/C][C]0.031655[/C][C]0.2667[/C][C]0.395227[/C][/ROW]
[ROW][C]37[/C][C]0.023682[/C][C]0.1995[/C][C]0.421203[/C][/ROW]
[ROW][C]38[/C][C]0.073399[/C][C]0.6185[/C][C]0.269121[/C][/ROW]
[ROW][C]39[/C][C]-0.08238[/C][C]-0.6941[/C][C]0.244928[/C][/ROW]
[ROW][C]40[/C][C]0.104251[/C][C]0.8784[/C][C]0.191335[/C][/ROW]
[ROW][C]41[/C][C]-0.032433[/C][C]-0.2733[/C][C]0.392713[/C][/ROW]
[ROW][C]42[/C][C]0.123322[/C][C]1.0391[/C][C]0.151135[/C][/ROW]
[ROW][C]43[/C][C]0.064112[/C][C]0.5402[/C][C]0.295369[/C][/ROW]
[ROW][C]44[/C][C]-0.051295[/C][C]-0.4322[/C][C]0.333447[/C][/ROW]
[ROW][C]45[/C][C]-0.082194[/C][C]-0.6926[/C][C]0.245417[/C][/ROW]
[ROW][C]46[/C][C]-0.000799[/C][C]-0.0067[/C][C]0.497324[/C][/ROW]
[ROW][C]47[/C][C]-0.035597[/C][C]-0.2999[/C][C]0.382548[/C][/ROW]
[ROW][C]48[/C][C]-0.051627[/C][C]-0.435[/C][C]0.332435[/C][/ROW]
[/TABLE]
Source: https://freestatistics.org/blog/index.php?pk=&T=2

Globally Unique Identifier (entire table): ba.freestatistics.org/blog/index.php?pk=&T=2

As an alternative you can also use a QR Code:  

The GUIDs for individual cells are displayed in the table below:

Partial Autocorrelation Function
Time lag kPACF(k)T-STATP-value
1-0.502552-4.23463.4e-05
2-0.487076-4.10425.3e-05
3-0.162712-1.3710.087341
40.0334820.28210.389334
50.0524970.44230.329791
60.1450251.2220.112874
7-0.155355-1.3090.097371
8-0.195785-1.64970.05171
90.0557030.46940.320126
10-0.06923-0.58330.280756
110.0156360.13170.447778
120.2172391.83050.035687
13-0.114092-0.96140.169817
140.0254880.21480.415282
150.0976680.8230.206641
16-0.039671-0.33430.369579
170.0711330.59940.275415
180.0135990.11460.454548
19-0.026745-0.22540.411176
20-0.14948-1.25950.10598
210.0732240.6170.269605
220.0267910.22570.411025
23-0.009416-0.07930.468492
240.0624710.52640.30013
250.020530.1730.431575
26-0.13717-1.15580.125816
27-0.103404-0.87130.193265
28-0.031943-0.26920.394296
29-0.030888-0.26030.397704
30-0.093366-0.78670.217032
31-0.204433-1.72260.044659
32-0.127803-1.07690.142587
33-0.024359-0.20520.418982
34-0.068659-0.57850.282368
350.1063350.8960.186641
360.0316550.26670.395227
370.0236820.19950.421203
380.0733990.61850.269121
39-0.08238-0.69410.244928
400.1042510.87840.191335
41-0.032433-0.27330.392713
420.1233221.03910.151135
430.0641120.54020.295369
44-0.051295-0.43220.333447
45-0.082194-0.69260.245417
46-0.000799-0.00670.497324
47-0.035597-0.29990.382548
48-0.051627-0.4350.332435


Parameters (Session):
par1 = 48 ; par2 = 1 ; par3 = 1 ; par4 = 0 ; par5 = 12 ; par6 = White Noise ; par7 = 0.95 ;
Parameters (R input):
par1 = 48 ; par2 = 1 ; par3 = 1 ; par4 = 0 ; par5 = 12 ; par6 = White Noise ; par7 = 0.95 ; par8 = ;
R code (references can be found in the software module):
if (par1 == 'Default') {
par1 = 10*log10(length(x))
} else {
par1 <- as.numeric(par1)
}
par2 <- as.numeric(par2)
par3 <- as.numeric(par3)
par4 <- as.numeric(par4)
par5 <- as.numeric(par5)
if (par6 == 'White Noise') par6 <- 'white' else par6 <- 'ma'
par7 <- as.numeric(par7)
if (par8 != '') par8 <- as.numeric(par8)
x <- na.omit(x)
ox <- x
if (par8 == '') {
if (par2 == 0) {
x <- log(x)
} else {
x <- (x ^ par2 - 1) / par2
}
} else {
x <- log(x,base=par8)
}
if (par3 > 0) x <- diff(x,lag=1,difference=par3)
if (par4 > 0) x <- diff(x,lag=par5,difference=par4)
bitmap(file='picts.png')
op <- par(mfrow=c(2,1))
plot(ox,type='l',main='Original Time Series',xlab='time',ylab='value')
if (par8=='') {
mytitle <- paste('Working Time Series (lambda=',par2,', d=',par3,', D=',par4,')',sep='')
mysub <- paste('(lambda=',par2,', d=',par3,', D=',par4,', CI=', par7, ', CI type=',par6,')',sep='')
} else {
mytitle <- paste('Working Time Series (base=',par8,', d=',par3,', D=',par4,')',sep='')
mysub <- paste('(base=',par8,', d=',par3,', D=',par4,', CI=', par7, ', CI type=',par6,')',sep='')
}
plot(x,type='l', main=mytitle,xlab='time',ylab='value')
par(op)
dev.off()
bitmap(file='pic1.png')
racf <- acf(x, par1, main='Autocorrelation', xlab='time lag', ylab='ACF', ci.type=par6, ci=par7, sub=mysub)
dev.off()
bitmap(file='pic2.png')
rpacf <- pacf(x,par1,main='Partial Autocorrelation',xlab='lags',ylab='PACF',sub=mysub)
dev.off()
(myacf <- c(racf$acf))
(mypacf <- c(rpacf$acf))
lengthx <- length(x)
sqrtn <- sqrt(lengthx)
load(file='createtable')
a<-table.start()
a<-table.row.start(a)
a<-table.element(a,'Autocorrelation Function',4,TRUE)
a<-table.row.end(a)
a<-table.row.start(a)
a<-table.element(a,'Time lag k',header=TRUE)
a<-table.element(a,hyperlink('basics.htm','ACF(k)','click here for more information about the Autocorrelation Function'),header=TRUE)
a<-table.element(a,'T-STAT',header=TRUE)
a<-table.element(a,'P-value',header=TRUE)
a<-table.row.end(a)
for (i in 2:(par1+1)) {
a<-table.row.start(a)
a<-table.element(a,i-1,header=TRUE)
a<-table.element(a,round(myacf[i],6))
mytstat <- myacf[i]*sqrtn
a<-table.element(a,round(mytstat,4))
a<-table.element(a,round(1-pt(abs(mytstat),lengthx),6))
a<-table.row.end(a)
}
a<-table.end(a)
table.save(a,file='mytable.tab')
a<-table.start()
a<-table.row.start(a)
a<-table.element(a,'Partial Autocorrelation Function',4,TRUE)
a<-table.row.end(a)
a<-table.row.start(a)
a<-table.element(a,'Time lag k',header=TRUE)
a<-table.element(a,hyperlink('basics.htm','PACF(k)','click here for more information about the Partial Autocorrelation Function'),header=TRUE)
a<-table.element(a,'T-STAT',header=TRUE)
a<-table.element(a,'P-value',header=TRUE)
a<-table.row.end(a)
for (i in 1:par1) {
a<-table.row.start(a)
a<-table.element(a,i,header=TRUE)
a<-table.element(a,round(mypacf[i],6))
mytstat <- mypacf[i]*sqrtn
a<-table.element(a,round(mytstat,4))
a<-table.element(a,round(1-pt(abs(mytstat),lengthx),6))
a<-table.row.end(a)
}
a<-table.end(a)
table.save(a,file='mytable1.tab')