Free Statistics

of Irreproducible Research!

Author's title

Author*Unverified author*
R Software Modulerwasp_autocorrelation.wasp
Title produced by software(Partial) Autocorrelation Function
Date of computationThu, 05 Jan 2017 15:11:49 +0000
Cite this page as followsStatistical Computations at FreeStatistics.org, Office for Research Development and Education, URL https://freestatistics.org/blog/index.php?v=date/2017/Jan/05/t1483629178z10bv9j63s48yj4.htm/, Retrieved Tue, 14 May 2024 11:54:11 +0200
Statistical Computations at FreeStatistics.org, Office for Research Development and Education, URL https://freestatistics.org/blog/index.php?pk=, Retrieved Tue, 14 May 2024 11:54:11 +0200
QR Codes:

Original text written by user:
IsPrivate?No (this computation is public)
User-defined keywords
Estimated Impact0
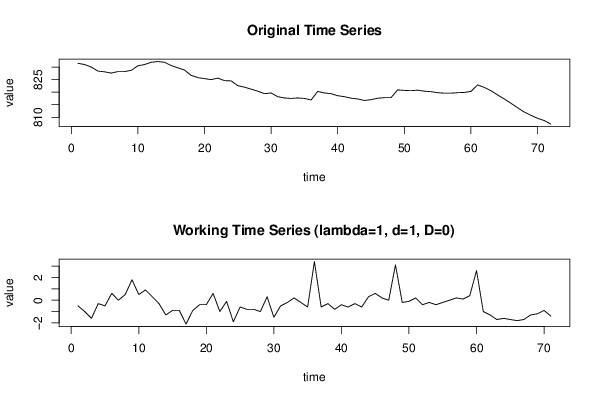
Dataseries X:
831.5
831
830
828.4
828.1
827.6
828.2
828.2
828.7
830.5
831
831.9
832.2
831.9
830.6
829.7
828.8
826.7
825.8
825.4
825
825.6
824.6
824.5
822.6
822
821.2
820.4
819.4
819.7
818.2
817.7
817.5
817.7
817.5
816.9
820.3
819.7
819.4
818.6
818.2
817.6
817.3
816.7
817
817.6
817.8
817.8
820.9
820.7
820.6
820.8
820.4
820.2
819.8
819.6
819.6
819.8
819.9
820.3
822.9
821.9
820.6
818.9
817.3
815.6
813.8
812.1
810.8
809.6
808.7
807.3


Summary of computational transaction
Raw Inputview raw input (R code)
Raw Outputview raw output of R engine
Computing time2 seconds
R Server'Herman Ole Andreas Wold' @ wold.wessa.net

\begin{tabular}{lllllllll}
\hline
Summary of computational transaction \tabularnewline
Raw Input & view raw input (R code)  \tabularnewline
Raw Output & view raw output of R engine  \tabularnewline
Computing time & 2 seconds \tabularnewline
R Server & 'Herman Ole Andreas Wold' @ wold.wessa.net \tabularnewline
\hline
\end{tabular}
%Source: https://freestatistics.org/blog/index.php?pk=&T=0

[TABLE]
[ROW][C]Summary of computational transaction[/C][/ROW]
[ROW][C]Raw Input[/C][C]view raw input (R code) [/C][/ROW]
[ROW][C]Raw Output[/C][C]view raw output of R engine [/C][/ROW]
[ROW][C]Computing time[/C][C]2 seconds[/C][/ROW]
[ROW][C]R Server[/C][C]'Herman Ole Andreas Wold' @ wold.wessa.net[/C][/ROW]
[/TABLE]
Source: https://freestatistics.org/blog/index.php?pk=&T=0

Globally Unique Identifier (entire table): ba.freestatistics.org/blog/index.php?pk=&T=0

As an alternative you can also use a QR Code:  

The GUIDs for individual cells are displayed in the table below:

Summary of computational transaction
Raw Inputview raw input (R code)
Raw Outputview raw output of R engine
Computing time2 seconds
R Server'Herman Ole Andreas Wold' @ wold.wessa.net


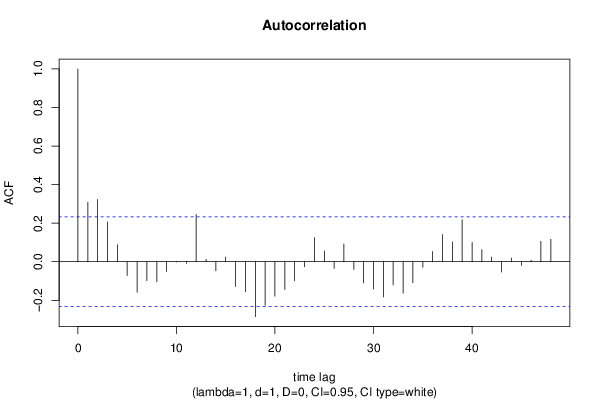
Autocorrelation Function
Time lag kACF(k)T-STATP-value
10.3084462.5990.005682
20.3225082.71750.004129
30.2055941.73240.043775
40.0882930.7440.229676
5-0.071211-0.60.275197
6-0.158238-1.33330.093342
7-0.097877-0.82470.206144
8-0.104314-0.8790.191194
9-0.050821-0.42820.334892
10-0.001785-0.0150.494022
11-0.008767-0.07390.470659
120.2450112.06450.021312
130.0124320.10480.458432
14-0.046911-0.39530.346912
150.0238710.20110.420584
16-0.128854-1.08570.140633
17-0.155632-1.31140.096978
18-0.284866-2.40030.009502
19-0.226176-1.90580.030363
20-0.178344-1.50280.068669
21-0.144358-1.21640.113933
22-0.099037-0.83450.203399
23-0.026335-0.22190.412515
240.1256591.05880.146635
250.0555570.46810.320563
26-0.034607-0.29160.385721
270.0922060.77690.219887
28-0.039764-0.33510.369286
29-0.109896-0.9260.178791
30-0.141628-1.19340.118346
31-0.182302-1.53610.064479
32-0.120001-1.01110.157689
33-0.162821-1.3720.087199
34-0.109401-0.92180.179869
35-0.028718-0.2420.404747
360.0533470.44950.327218
370.1413861.19130.118744
380.1027920.86610.194666
390.2176531.8340.035424
400.0995370.83870.202222
410.0620730.5230.301288
420.0239220.20160.420415
43-0.0537-0.45250.326149
440.0186860.15740.437669
45-0.018869-0.1590.437064
460.0077230.06510.474148
470.1055990.88980.188291
480.1167640.98390.16426

\begin{tabular}{lllllllll}
\hline
Autocorrelation Function \tabularnewline
Time lag k & ACF(k) & T-STAT & P-value \tabularnewline
1 & 0.308446 & 2.599 & 0.005682 \tabularnewline
2 & 0.322508 & 2.7175 & 0.004129 \tabularnewline
3 & 0.205594 & 1.7324 & 0.043775 \tabularnewline
4 & 0.088293 & 0.744 & 0.229676 \tabularnewline
5 & -0.071211 & -0.6 & 0.275197 \tabularnewline
6 & -0.158238 & -1.3333 & 0.093342 \tabularnewline
7 & -0.097877 & -0.8247 & 0.206144 \tabularnewline
8 & -0.104314 & -0.879 & 0.191194 \tabularnewline
9 & -0.050821 & -0.4282 & 0.334892 \tabularnewline
10 & -0.001785 & -0.015 & 0.494022 \tabularnewline
11 & -0.008767 & -0.0739 & 0.470659 \tabularnewline
12 & 0.245011 & 2.0645 & 0.021312 \tabularnewline
13 & 0.012432 & 0.1048 & 0.458432 \tabularnewline
14 & -0.046911 & -0.3953 & 0.346912 \tabularnewline
15 & 0.023871 & 0.2011 & 0.420584 \tabularnewline
16 & -0.128854 & -1.0857 & 0.140633 \tabularnewline
17 & -0.155632 & -1.3114 & 0.096978 \tabularnewline
18 & -0.284866 & -2.4003 & 0.009502 \tabularnewline
19 & -0.226176 & -1.9058 & 0.030363 \tabularnewline
20 & -0.178344 & -1.5028 & 0.068669 \tabularnewline
21 & -0.144358 & -1.2164 & 0.113933 \tabularnewline
22 & -0.099037 & -0.8345 & 0.203399 \tabularnewline
23 & -0.026335 & -0.2219 & 0.412515 \tabularnewline
24 & 0.125659 & 1.0588 & 0.146635 \tabularnewline
25 & 0.055557 & 0.4681 & 0.320563 \tabularnewline
26 & -0.034607 & -0.2916 & 0.385721 \tabularnewline
27 & 0.092206 & 0.7769 & 0.219887 \tabularnewline
28 & -0.039764 & -0.3351 & 0.369286 \tabularnewline
29 & -0.109896 & -0.926 & 0.178791 \tabularnewline
30 & -0.141628 & -1.1934 & 0.118346 \tabularnewline
31 & -0.182302 & -1.5361 & 0.064479 \tabularnewline
32 & -0.120001 & -1.0111 & 0.157689 \tabularnewline
33 & -0.162821 & -1.372 & 0.087199 \tabularnewline
34 & -0.109401 & -0.9218 & 0.179869 \tabularnewline
35 & -0.028718 & -0.242 & 0.404747 \tabularnewline
36 & 0.053347 & 0.4495 & 0.327218 \tabularnewline
37 & 0.141386 & 1.1913 & 0.118744 \tabularnewline
38 & 0.102792 & 0.8661 & 0.194666 \tabularnewline
39 & 0.217653 & 1.834 & 0.035424 \tabularnewline
40 & 0.099537 & 0.8387 & 0.202222 \tabularnewline
41 & 0.062073 & 0.523 & 0.301288 \tabularnewline
42 & 0.023922 & 0.2016 & 0.420415 \tabularnewline
43 & -0.0537 & -0.4525 & 0.326149 \tabularnewline
44 & 0.018686 & 0.1574 & 0.437669 \tabularnewline
45 & -0.018869 & -0.159 & 0.437064 \tabularnewline
46 & 0.007723 & 0.0651 & 0.474148 \tabularnewline
47 & 0.105599 & 0.8898 & 0.188291 \tabularnewline
48 & 0.116764 & 0.9839 & 0.16426 \tabularnewline
\hline
\end{tabular}
%Source: https://freestatistics.org/blog/index.php?pk=&T=1

[TABLE]
[ROW][C]Autocorrelation Function[/C][/ROW]
[ROW][C]Time lag k[/C][C]ACF(k)[/C][C]T-STAT[/C][C]P-value[/C][/ROW]
[ROW][C]1[/C][C]0.308446[/C][C]2.599[/C][C]0.005682[/C][/ROW]
[ROW][C]2[/C][C]0.322508[/C][C]2.7175[/C][C]0.004129[/C][/ROW]
[ROW][C]3[/C][C]0.205594[/C][C]1.7324[/C][C]0.043775[/C][/ROW]
[ROW][C]4[/C][C]0.088293[/C][C]0.744[/C][C]0.229676[/C][/ROW]
[ROW][C]5[/C][C]-0.071211[/C][C]-0.6[/C][C]0.275197[/C][/ROW]
[ROW][C]6[/C][C]-0.158238[/C][C]-1.3333[/C][C]0.093342[/C][/ROW]
[ROW][C]7[/C][C]-0.097877[/C][C]-0.8247[/C][C]0.206144[/C][/ROW]
[ROW][C]8[/C][C]-0.104314[/C][C]-0.879[/C][C]0.191194[/C][/ROW]
[ROW][C]9[/C][C]-0.050821[/C][C]-0.4282[/C][C]0.334892[/C][/ROW]
[ROW][C]10[/C][C]-0.001785[/C][C]-0.015[/C][C]0.494022[/C][/ROW]
[ROW][C]11[/C][C]-0.008767[/C][C]-0.0739[/C][C]0.470659[/C][/ROW]
[ROW][C]12[/C][C]0.245011[/C][C]2.0645[/C][C]0.021312[/C][/ROW]
[ROW][C]13[/C][C]0.012432[/C][C]0.1048[/C][C]0.458432[/C][/ROW]
[ROW][C]14[/C][C]-0.046911[/C][C]-0.3953[/C][C]0.346912[/C][/ROW]
[ROW][C]15[/C][C]0.023871[/C][C]0.2011[/C][C]0.420584[/C][/ROW]
[ROW][C]16[/C][C]-0.128854[/C][C]-1.0857[/C][C]0.140633[/C][/ROW]
[ROW][C]17[/C][C]-0.155632[/C][C]-1.3114[/C][C]0.096978[/C][/ROW]
[ROW][C]18[/C][C]-0.284866[/C][C]-2.4003[/C][C]0.009502[/C][/ROW]
[ROW][C]19[/C][C]-0.226176[/C][C]-1.9058[/C][C]0.030363[/C][/ROW]
[ROW][C]20[/C][C]-0.178344[/C][C]-1.5028[/C][C]0.068669[/C][/ROW]
[ROW][C]21[/C][C]-0.144358[/C][C]-1.2164[/C][C]0.113933[/C][/ROW]
[ROW][C]22[/C][C]-0.099037[/C][C]-0.8345[/C][C]0.203399[/C][/ROW]
[ROW][C]23[/C][C]-0.026335[/C][C]-0.2219[/C][C]0.412515[/C][/ROW]
[ROW][C]24[/C][C]0.125659[/C][C]1.0588[/C][C]0.146635[/C][/ROW]
[ROW][C]25[/C][C]0.055557[/C][C]0.4681[/C][C]0.320563[/C][/ROW]
[ROW][C]26[/C][C]-0.034607[/C][C]-0.2916[/C][C]0.385721[/C][/ROW]
[ROW][C]27[/C][C]0.092206[/C][C]0.7769[/C][C]0.219887[/C][/ROW]
[ROW][C]28[/C][C]-0.039764[/C][C]-0.3351[/C][C]0.369286[/C][/ROW]
[ROW][C]29[/C][C]-0.109896[/C][C]-0.926[/C][C]0.178791[/C][/ROW]
[ROW][C]30[/C][C]-0.141628[/C][C]-1.1934[/C][C]0.118346[/C][/ROW]
[ROW][C]31[/C][C]-0.182302[/C][C]-1.5361[/C][C]0.064479[/C][/ROW]
[ROW][C]32[/C][C]-0.120001[/C][C]-1.0111[/C][C]0.157689[/C][/ROW]
[ROW][C]33[/C][C]-0.162821[/C][C]-1.372[/C][C]0.087199[/C][/ROW]
[ROW][C]34[/C][C]-0.109401[/C][C]-0.9218[/C][C]0.179869[/C][/ROW]
[ROW][C]35[/C][C]-0.028718[/C][C]-0.242[/C][C]0.404747[/C][/ROW]
[ROW][C]36[/C][C]0.053347[/C][C]0.4495[/C][C]0.327218[/C][/ROW]
[ROW][C]37[/C][C]0.141386[/C][C]1.1913[/C][C]0.118744[/C][/ROW]
[ROW][C]38[/C][C]0.102792[/C][C]0.8661[/C][C]0.194666[/C][/ROW]
[ROW][C]39[/C][C]0.217653[/C][C]1.834[/C][C]0.035424[/C][/ROW]
[ROW][C]40[/C][C]0.099537[/C][C]0.8387[/C][C]0.202222[/C][/ROW]
[ROW][C]41[/C][C]0.062073[/C][C]0.523[/C][C]0.301288[/C][/ROW]
[ROW][C]42[/C][C]0.023922[/C][C]0.2016[/C][C]0.420415[/C][/ROW]
[ROW][C]43[/C][C]-0.0537[/C][C]-0.4525[/C][C]0.326149[/C][/ROW]
[ROW][C]44[/C][C]0.018686[/C][C]0.1574[/C][C]0.437669[/C][/ROW]
[ROW][C]45[/C][C]-0.018869[/C][C]-0.159[/C][C]0.437064[/C][/ROW]
[ROW][C]46[/C][C]0.007723[/C][C]0.0651[/C][C]0.474148[/C][/ROW]
[ROW][C]47[/C][C]0.105599[/C][C]0.8898[/C][C]0.188291[/C][/ROW]
[ROW][C]48[/C][C]0.116764[/C][C]0.9839[/C][C]0.16426[/C][/ROW]
[/TABLE]
Source: https://freestatistics.org/blog/index.php?pk=&T=1

Globally Unique Identifier (entire table): ba.freestatistics.org/blog/index.php?pk=&T=1

As an alternative you can also use a QR Code:  

The GUIDs for individual cells are displayed in the table below:

Autocorrelation Function
Time lag kACF(k)T-STATP-value
10.3084462.5990.005682
20.3225082.71750.004129
30.2055941.73240.043775
40.0882930.7440.229676
5-0.071211-0.60.275197
6-0.158238-1.33330.093342
7-0.097877-0.82470.206144
8-0.104314-0.8790.191194
9-0.050821-0.42820.334892
10-0.001785-0.0150.494022
11-0.008767-0.07390.470659
120.2450112.06450.021312
130.0124320.10480.458432
14-0.046911-0.39530.346912
150.0238710.20110.420584
16-0.128854-1.08570.140633
17-0.155632-1.31140.096978
18-0.284866-2.40030.009502
19-0.226176-1.90580.030363
20-0.178344-1.50280.068669
21-0.144358-1.21640.113933
22-0.099037-0.83450.203399
23-0.026335-0.22190.412515
240.1256591.05880.146635
250.0555570.46810.320563
26-0.034607-0.29160.385721
270.0922060.77690.219887
28-0.039764-0.33510.369286
29-0.109896-0.9260.178791
30-0.141628-1.19340.118346
31-0.182302-1.53610.064479
32-0.120001-1.01110.157689
33-0.162821-1.3720.087199
34-0.109401-0.92180.179869
35-0.028718-0.2420.404747
360.0533470.44950.327218
370.1413861.19130.118744
380.1027920.86610.194666
390.2176531.8340.035424
400.0995370.83870.202222
410.0620730.5230.301288
420.0239220.20160.420415
43-0.0537-0.45250.326149
440.0186860.15740.437669
45-0.018869-0.1590.437064
460.0077230.06510.474148
470.1055990.88980.188291
480.1167640.98390.16426


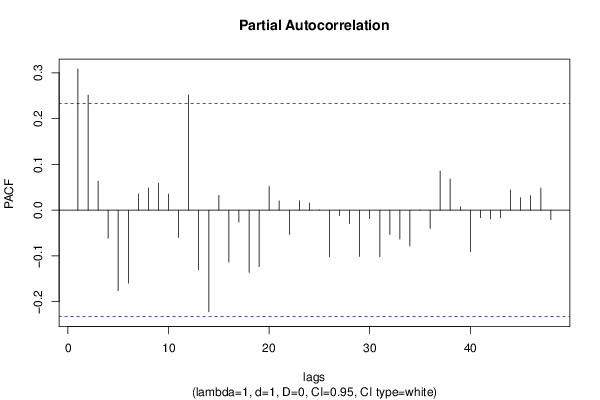
Partial Autocorrelation Function
Time lag kPACF(k)T-STATP-value
10.3084462.5990.005682
20.2512752.11730.01887
30.0632390.53290.297898
4-0.061296-0.51650.30356
5-0.175852-1.48180.071415
6-0.159453-1.34360.091682
70.0353290.29770.383404
80.0483950.40780.34233
90.0589690.49690.310405
100.0350780.29560.384209
11-0.059799-0.50390.307956
120.2516622.12050.018727
13-0.129997-1.09540.138527
14-0.22191-1.86990.032814
150.0323470.27260.392991
16-0.113451-0.9560.17117
17-0.025774-0.21720.414348
18-0.136079-1.14660.127694
19-0.123312-1.0390.151155
200.0518550.43690.331743
210.0203270.17130.432247
22-0.053297-0.44910.327367
230.0206220.17380.431272
240.0153680.12950.448666
25-9.5e-05-8e-040.499681
26-0.101683-0.85680.19722
27-0.012137-0.10230.459415
28-0.02906-0.24490.403633
29-0.101403-0.85440.197868
30-0.018511-0.1560.438248
31-0.101796-0.85770.196959
32-0.05317-0.4480.327753
33-0.062888-0.52990.298917
34-0.078379-0.66040.255556
35-0.000288-0.00240.499036
36-0.039902-0.33620.368848
370.0852880.71860.237358
380.0681270.5740.283875
390.0071840.06050.475949
40-0.090842-0.76550.22327
41-0.016317-0.13750.445516
42-0.019494-0.16430.434998
43-0.016711-0.14080.444209
440.0439590.37040.35609
450.0272070.22920.409668
460.0317690.26770.394856
470.0482710.40670.342712
48-0.020748-0.17480.430857

\begin{tabular}{lllllllll}
\hline
Partial Autocorrelation Function \tabularnewline
Time lag k & PACF(k) & T-STAT & P-value \tabularnewline
1 & 0.308446 & 2.599 & 0.005682 \tabularnewline
2 & 0.251275 & 2.1173 & 0.01887 \tabularnewline
3 & 0.063239 & 0.5329 & 0.297898 \tabularnewline
4 & -0.061296 & -0.5165 & 0.30356 \tabularnewline
5 & -0.175852 & -1.4818 & 0.071415 \tabularnewline
6 & -0.159453 & -1.3436 & 0.091682 \tabularnewline
7 & 0.035329 & 0.2977 & 0.383404 \tabularnewline
8 & 0.048395 & 0.4078 & 0.34233 \tabularnewline
9 & 0.058969 & 0.4969 & 0.310405 \tabularnewline
10 & 0.035078 & 0.2956 & 0.384209 \tabularnewline
11 & -0.059799 & -0.5039 & 0.307956 \tabularnewline
12 & 0.251662 & 2.1205 & 0.018727 \tabularnewline
13 & -0.129997 & -1.0954 & 0.138527 \tabularnewline
14 & -0.22191 & -1.8699 & 0.032814 \tabularnewline
15 & 0.032347 & 0.2726 & 0.392991 \tabularnewline
16 & -0.113451 & -0.956 & 0.17117 \tabularnewline
17 & -0.025774 & -0.2172 & 0.414348 \tabularnewline
18 & -0.136079 & -1.1466 & 0.127694 \tabularnewline
19 & -0.123312 & -1.039 & 0.151155 \tabularnewline
20 & 0.051855 & 0.4369 & 0.331743 \tabularnewline
21 & 0.020327 & 0.1713 & 0.432247 \tabularnewline
22 & -0.053297 & -0.4491 & 0.327367 \tabularnewline
23 & 0.020622 & 0.1738 & 0.431272 \tabularnewline
24 & 0.015368 & 0.1295 & 0.448666 \tabularnewline
25 & -9.5e-05 & -8e-04 & 0.499681 \tabularnewline
26 & -0.101683 & -0.8568 & 0.19722 \tabularnewline
27 & -0.012137 & -0.1023 & 0.459415 \tabularnewline
28 & -0.02906 & -0.2449 & 0.403633 \tabularnewline
29 & -0.101403 & -0.8544 & 0.197868 \tabularnewline
30 & -0.018511 & -0.156 & 0.438248 \tabularnewline
31 & -0.101796 & -0.8577 & 0.196959 \tabularnewline
32 & -0.05317 & -0.448 & 0.327753 \tabularnewline
33 & -0.062888 & -0.5299 & 0.298917 \tabularnewline
34 & -0.078379 & -0.6604 & 0.255556 \tabularnewline
35 & -0.000288 & -0.0024 & 0.499036 \tabularnewline
36 & -0.039902 & -0.3362 & 0.368848 \tabularnewline
37 & 0.085288 & 0.7186 & 0.237358 \tabularnewline
38 & 0.068127 & 0.574 & 0.283875 \tabularnewline
39 & 0.007184 & 0.0605 & 0.475949 \tabularnewline
40 & -0.090842 & -0.7655 & 0.22327 \tabularnewline
41 & -0.016317 & -0.1375 & 0.445516 \tabularnewline
42 & -0.019494 & -0.1643 & 0.434998 \tabularnewline
43 & -0.016711 & -0.1408 & 0.444209 \tabularnewline
44 & 0.043959 & 0.3704 & 0.35609 \tabularnewline
45 & 0.027207 & 0.2292 & 0.409668 \tabularnewline
46 & 0.031769 & 0.2677 & 0.394856 \tabularnewline
47 & 0.048271 & 0.4067 & 0.342712 \tabularnewline
48 & -0.020748 & -0.1748 & 0.430857 \tabularnewline
\hline
\end{tabular}
%Source: https://freestatistics.org/blog/index.php?pk=&T=2

[TABLE]
[ROW][C]Partial Autocorrelation Function[/C][/ROW]
[ROW][C]Time lag k[/C][C]PACF(k)[/C][C]T-STAT[/C][C]P-value[/C][/ROW]
[ROW][C]1[/C][C]0.308446[/C][C]2.599[/C][C]0.005682[/C][/ROW]
[ROW][C]2[/C][C]0.251275[/C][C]2.1173[/C][C]0.01887[/C][/ROW]
[ROW][C]3[/C][C]0.063239[/C][C]0.5329[/C][C]0.297898[/C][/ROW]
[ROW][C]4[/C][C]-0.061296[/C][C]-0.5165[/C][C]0.30356[/C][/ROW]
[ROW][C]5[/C][C]-0.175852[/C][C]-1.4818[/C][C]0.071415[/C][/ROW]
[ROW][C]6[/C][C]-0.159453[/C][C]-1.3436[/C][C]0.091682[/C][/ROW]
[ROW][C]7[/C][C]0.035329[/C][C]0.2977[/C][C]0.383404[/C][/ROW]
[ROW][C]8[/C][C]0.048395[/C][C]0.4078[/C][C]0.34233[/C][/ROW]
[ROW][C]9[/C][C]0.058969[/C][C]0.4969[/C][C]0.310405[/C][/ROW]
[ROW][C]10[/C][C]0.035078[/C][C]0.2956[/C][C]0.384209[/C][/ROW]
[ROW][C]11[/C][C]-0.059799[/C][C]-0.5039[/C][C]0.307956[/C][/ROW]
[ROW][C]12[/C][C]0.251662[/C][C]2.1205[/C][C]0.018727[/C][/ROW]
[ROW][C]13[/C][C]-0.129997[/C][C]-1.0954[/C][C]0.138527[/C][/ROW]
[ROW][C]14[/C][C]-0.22191[/C][C]-1.8699[/C][C]0.032814[/C][/ROW]
[ROW][C]15[/C][C]0.032347[/C][C]0.2726[/C][C]0.392991[/C][/ROW]
[ROW][C]16[/C][C]-0.113451[/C][C]-0.956[/C][C]0.17117[/C][/ROW]
[ROW][C]17[/C][C]-0.025774[/C][C]-0.2172[/C][C]0.414348[/C][/ROW]
[ROW][C]18[/C][C]-0.136079[/C][C]-1.1466[/C][C]0.127694[/C][/ROW]
[ROW][C]19[/C][C]-0.123312[/C][C]-1.039[/C][C]0.151155[/C][/ROW]
[ROW][C]20[/C][C]0.051855[/C][C]0.4369[/C][C]0.331743[/C][/ROW]
[ROW][C]21[/C][C]0.020327[/C][C]0.1713[/C][C]0.432247[/C][/ROW]
[ROW][C]22[/C][C]-0.053297[/C][C]-0.4491[/C][C]0.327367[/C][/ROW]
[ROW][C]23[/C][C]0.020622[/C][C]0.1738[/C][C]0.431272[/C][/ROW]
[ROW][C]24[/C][C]0.015368[/C][C]0.1295[/C][C]0.448666[/C][/ROW]
[ROW][C]25[/C][C]-9.5e-05[/C][C]-8e-04[/C][C]0.499681[/C][/ROW]
[ROW][C]26[/C][C]-0.101683[/C][C]-0.8568[/C][C]0.19722[/C][/ROW]
[ROW][C]27[/C][C]-0.012137[/C][C]-0.1023[/C][C]0.459415[/C][/ROW]
[ROW][C]28[/C][C]-0.02906[/C][C]-0.2449[/C][C]0.403633[/C][/ROW]
[ROW][C]29[/C][C]-0.101403[/C][C]-0.8544[/C][C]0.197868[/C][/ROW]
[ROW][C]30[/C][C]-0.018511[/C][C]-0.156[/C][C]0.438248[/C][/ROW]
[ROW][C]31[/C][C]-0.101796[/C][C]-0.8577[/C][C]0.196959[/C][/ROW]
[ROW][C]32[/C][C]-0.05317[/C][C]-0.448[/C][C]0.327753[/C][/ROW]
[ROW][C]33[/C][C]-0.062888[/C][C]-0.5299[/C][C]0.298917[/C][/ROW]
[ROW][C]34[/C][C]-0.078379[/C][C]-0.6604[/C][C]0.255556[/C][/ROW]
[ROW][C]35[/C][C]-0.000288[/C][C]-0.0024[/C][C]0.499036[/C][/ROW]
[ROW][C]36[/C][C]-0.039902[/C][C]-0.3362[/C][C]0.368848[/C][/ROW]
[ROW][C]37[/C][C]0.085288[/C][C]0.7186[/C][C]0.237358[/C][/ROW]
[ROW][C]38[/C][C]0.068127[/C][C]0.574[/C][C]0.283875[/C][/ROW]
[ROW][C]39[/C][C]0.007184[/C][C]0.0605[/C][C]0.475949[/C][/ROW]
[ROW][C]40[/C][C]-0.090842[/C][C]-0.7655[/C][C]0.22327[/C][/ROW]
[ROW][C]41[/C][C]-0.016317[/C][C]-0.1375[/C][C]0.445516[/C][/ROW]
[ROW][C]42[/C][C]-0.019494[/C][C]-0.1643[/C][C]0.434998[/C][/ROW]
[ROW][C]43[/C][C]-0.016711[/C][C]-0.1408[/C][C]0.444209[/C][/ROW]
[ROW][C]44[/C][C]0.043959[/C][C]0.3704[/C][C]0.35609[/C][/ROW]
[ROW][C]45[/C][C]0.027207[/C][C]0.2292[/C][C]0.409668[/C][/ROW]
[ROW][C]46[/C][C]0.031769[/C][C]0.2677[/C][C]0.394856[/C][/ROW]
[ROW][C]47[/C][C]0.048271[/C][C]0.4067[/C][C]0.342712[/C][/ROW]
[ROW][C]48[/C][C]-0.020748[/C][C]-0.1748[/C][C]0.430857[/C][/ROW]
[/TABLE]
Source: https://freestatistics.org/blog/index.php?pk=&T=2

Globally Unique Identifier (entire table): ba.freestatistics.org/blog/index.php?pk=&T=2

As an alternative you can also use a QR Code:  

The GUIDs for individual cells are displayed in the table below:

Partial Autocorrelation Function
Time lag kPACF(k)T-STATP-value
10.3084462.5990.005682
20.2512752.11730.01887
30.0632390.53290.297898
4-0.061296-0.51650.30356
5-0.175852-1.48180.071415
6-0.159453-1.34360.091682
70.0353290.29770.383404
80.0483950.40780.34233
90.0589690.49690.310405
100.0350780.29560.384209
11-0.059799-0.50390.307956
120.2516622.12050.018727
13-0.129997-1.09540.138527
14-0.22191-1.86990.032814
150.0323470.27260.392991
16-0.113451-0.9560.17117
17-0.025774-0.21720.414348
18-0.136079-1.14660.127694
19-0.123312-1.0390.151155
200.0518550.43690.331743
210.0203270.17130.432247
22-0.053297-0.44910.327367
230.0206220.17380.431272
240.0153680.12950.448666
25-9.5e-05-8e-040.499681
26-0.101683-0.85680.19722
27-0.012137-0.10230.459415
28-0.02906-0.24490.403633
29-0.101403-0.85440.197868
30-0.018511-0.1560.438248
31-0.101796-0.85770.196959
32-0.05317-0.4480.327753
33-0.062888-0.52990.298917
34-0.078379-0.66040.255556
35-0.000288-0.00240.499036
36-0.039902-0.33620.368848
370.0852880.71860.237358
380.0681270.5740.283875
390.0071840.06050.475949
40-0.090842-0.76550.22327
41-0.016317-0.13750.445516
42-0.019494-0.16430.434998
43-0.016711-0.14080.444209
440.0439590.37040.35609
450.0272070.22920.409668
460.0317690.26770.394856
470.0482710.40670.342712
48-0.020748-0.17480.430857


Parameters (Session):
par1 = 48 ; par2 = 1 ; par3 = 1 ; par4 = 0 ; par5 = 12 ; par6 = White Noise ; par7 = 0.95 ;
Parameters (R input):
par1 = 48 ; par2 = 1 ; par3 = 1 ; par4 = 0 ; par5 = 12 ; par6 = White Noise ; par7 = 0.95 ; par8 = ;
R code (references can be found in the software module):
par8 <- ''
par7 <- '0.95'
par6 <- 'White Noise'
par5 <- '12'
par4 <- '0'
par3 <- '0'
par2 <- '1'
par1 <- '48'
if (par1 == 'Default') {
par1 = 10*log10(length(x))
} else {
par1 <- as.numeric(par1)
}
par2 <- as.numeric(par2)
par3 <- as.numeric(par3)
par4 <- as.numeric(par4)
par5 <- as.numeric(par5)
if (par6 == 'White Noise') par6 <- 'white' else par6 <- 'ma'
par7 <- as.numeric(par7)
if (par8 != '') par8 <- as.numeric(par8)
x <- na.omit(x)
ox <- x
if (par8 == '') {
if (par2 == 0) {
x <- log(x)
} else {
x <- (x ^ par2 - 1) / par2
}
} else {
x <- log(x,base=par8)
}
if (par3 > 0) x <- diff(x,lag=1,difference=par3)
if (par4 > 0) x <- diff(x,lag=par5,difference=par4)
bitmap(file='picts.png')
op <- par(mfrow=c(2,1))
plot(ox,type='l',main='Original Time Series',xlab='time',ylab='value')
if (par8=='') {
mytitle <- paste('Working Time Series (lambda=',par2,', d=',par3,', D=',par4,')',sep='')
mysub <- paste('(lambda=',par2,', d=',par3,', D=',par4,', CI=', par7, ', CI type=',par6,')',sep='')
} else {
mytitle <- paste('Working Time Series (base=',par8,', d=',par3,', D=',par4,')',sep='')
mysub <- paste('(base=',par8,', d=',par3,', D=',par4,', CI=', par7, ', CI type=',par6,')',sep='')
}
plot(x,type='l', main=mytitle,xlab='time',ylab='value')
par(op)
dev.off()
bitmap(file='pic1.png')
racf <- acf(x, par1, main='Autocorrelation', xlab='time lag', ylab='ACF', ci.type=par6, ci=par7, sub=mysub)
dev.off()
bitmap(file='pic2.png')
rpacf <- pacf(x,par1,main='Partial Autocorrelation',xlab='lags',ylab='PACF',sub=mysub)
dev.off()
(myacf <- c(racf$acf))
(mypacf <- c(rpacf$acf))
lengthx <- length(x)
sqrtn <- sqrt(lengthx)
load(file='createtable')
a<-table.start()
a<-table.row.start(a)
a<-table.element(a,'Autocorrelation Function',4,TRUE)
a<-table.row.end(a)
a<-table.row.start(a)
a<-table.element(a,'Time lag k',header=TRUE)
a<-table.element(a,hyperlink('basics.htm','ACF(k)','click here for more information about the Autocorrelation Function'),header=TRUE)
a<-table.element(a,'T-STAT',header=TRUE)
a<-table.element(a,'P-value',header=TRUE)
a<-table.row.end(a)
for (i in 2:(par1+1)) {
a<-table.row.start(a)
a<-table.element(a,i-1,header=TRUE)
a<-table.element(a,round(myacf[i],6))
mytstat <- myacf[i]*sqrtn
a<-table.element(a,round(mytstat,4))
a<-table.element(a,round(1-pt(abs(mytstat),lengthx),6))
a<-table.row.end(a)
}
a<-table.end(a)
table.save(a,file='mytable.tab')
a<-table.start()
a<-table.row.start(a)
a<-table.element(a,'Partial Autocorrelation Function',4,TRUE)
a<-table.row.end(a)
a<-table.row.start(a)
a<-table.element(a,'Time lag k',header=TRUE)
a<-table.element(a,hyperlink('basics.htm','PACF(k)','click here for more information about the Partial Autocorrelation Function'),header=TRUE)
a<-table.element(a,'T-STAT',header=TRUE)
a<-table.element(a,'P-value',header=TRUE)
a<-table.row.end(a)
for (i in 1:par1) {
a<-table.row.start(a)
a<-table.element(a,i,header=TRUE)
a<-table.element(a,round(mypacf[i],6))
mytstat <- mypacf[i]*sqrtn
a<-table.element(a,round(mytstat,4))
a<-table.element(a,round(1-pt(abs(mytstat),lengthx),6))
a<-table.row.end(a)
}
a<-table.end(a)
table.save(a,file='mytable1.tab')