Free Statistics

of Irreproducible Research!

Author's title

Author*Unverified author*
R Software Modulerwasp_exponentialsmoothing.wasp
Title produced by softwareExponential Smoothing
Date of computationTue, 03 Jan 2017 19:56:09 +0000
Cite this page as followsStatistical Computations at FreeStatistics.org, Office for Research Development and Education, URL https://freestatistics.org/blog/index.php?v=date/2017/Jan/03/t14834734025r0jkwz26rhonfd.htm/, Retrieved Tue, 14 May 2024 04:41:46 +0200
Statistical Computations at FreeStatistics.org, Office for Research Development and Education, URL https://freestatistics.org/blog/index.php?pk=, Retrieved Tue, 14 May 2024 04:41:46 +0200
QR Codes:

Original text written by user:
IsPrivate?No (this computation is public)
User-defined keywords
Estimated Impact0
Dataseries X:
103,75
103,89
104,01
104,28
104,34
104,48
104,56
104,71
104,79
104,87
104,95
105
105,05
105,57
105,98
106,45
107,13
107,87
108,56
109,04
109,98
110,4
110,99
111,23
111,76
112,18
112,88
113,54
114,11
114,8
115,56
116,03
116,98
117,65
118,12
118,6
119,03
119,82
120,76
121,4
122,12
123,08
123,86
124,46
125,14
125,89
126,32
126,93
127,48
128,28
129,11
130,23
131,04
132,2
133,12
134,48
135,74
136,88
138,12
139,99


Summary of computational transaction
Raw Inputview raw input (R code)
Raw Outputview raw output of R engine
Computing time2 seconds
R Server'Gertrude Mary Cox' @ cox.wessa.net

\begin{tabular}{lllllllll}
\hline
Summary of computational transaction \tabularnewline
Raw Input & view raw input (R code)  \tabularnewline
Raw Output & view raw output of R engine  \tabularnewline
Computing time & 2 seconds \tabularnewline
R Server & 'Gertrude Mary Cox' @ cox.wessa.net \tabularnewline
\hline
\end{tabular}
%Source: https://freestatistics.org/blog/index.php?pk=&T=0

[TABLE]
[ROW][C]Summary of computational transaction[/C][/ROW]
[ROW][C]Raw Input[/C][C]view raw input (R code) [/C][/ROW]
[ROW][C]Raw Output[/C][C]view raw output of R engine [/C][/ROW]
[ROW][C]Computing time[/C][C]2 seconds[/C][/ROW]
[ROW][C]R Server[/C][C]'Gertrude Mary Cox' @ cox.wessa.net[/C][/ROW]
[/TABLE]
Source: https://freestatistics.org/blog/index.php?pk=&T=0

Globally Unique Identifier (entire table): ba.freestatistics.org/blog/index.php?pk=&T=0

As an alternative you can also use a QR Code:  

The GUIDs for individual cells are displayed in the table below:

Summary of computational transaction
Raw Inputview raw input (R code)
Raw Outputview raw output of R engine
Computing time2 seconds
R Server'Gertrude Mary Cox' @ cox.wessa.net


Estimated Parameters of Exponential Smoothing
ParameterValue
alpha0.76782294956134
beta0.785819347936031
gammaFALSE

\begin{tabular}{lllllllll}
\hline
Estimated Parameters of Exponential Smoothing \tabularnewline
Parameter & Value \tabularnewline
alpha & 0.76782294956134 \tabularnewline
beta & 0.785819347936031 \tabularnewline
gamma & FALSE \tabularnewline
\hline
\end{tabular}
%Source: https://freestatistics.org/blog/index.php?pk=&T=1

[TABLE]
[ROW][C]Estimated Parameters of Exponential Smoothing[/C][/ROW]
[ROW][C]Parameter[/C][C]Value[/C][/ROW]
[ROW][C]alpha[/C][C]0.76782294956134[/C][/ROW]
[ROW][C]beta[/C][C]0.785819347936031[/C][/ROW]
[ROW][C]gamma[/C][C]FALSE[/C][/ROW]
[/TABLE]
Source: https://freestatistics.org/blog/index.php?pk=&T=1

Globally Unique Identifier (entire table): ba.freestatistics.org/blog/index.php?pk=&T=1

As an alternative you can also use a QR Code:  

The GUIDs for individual cells are displayed in the table below:

Estimated Parameters of Exponential Smoothing
ParameterValue
alpha0.76782294956134
beta0.785819347936031
gammaFALSE


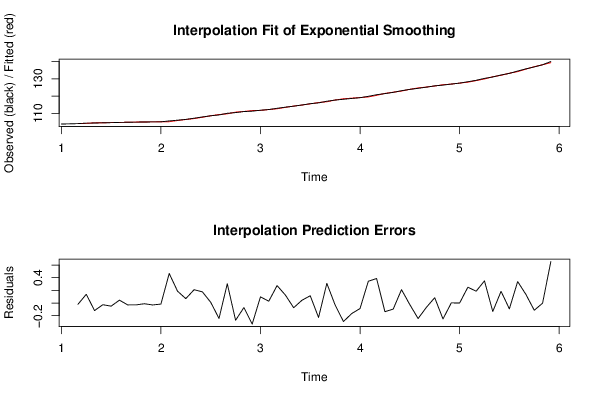
Interpolation Forecasts of Exponential Smoothing
tObservedFittedResiduals
3104.01104.03-0.019999999999996
4104.28104.1425761384180.137423861582306
5104.34104.458943383734-0.118943383733665
6104.48104.506699089727-0.0266990897271597
7104.56104.609172648397-0.0491726483972599
8104.71104.6647211857280.0452788142718248
9104.79104.820111607749-0.0301116077492765
10104.87104.899447088897-0.0294470888967169
11104.95104.961525309027-0.0115253090269505
12105105.030410255837-0.030410255837424
13105.05105.066446267081-0.0164462670811503
14105.57105.103280963060.466719036940077
15105.98105.7927053936820.187294606317892
16106.45106.3805893046830.069410695316634
17107.13106.9198395836590.2101604163405
18107.87107.6939652462170.176034753783298
19108.56108.548102554090.0118974459101509
20109.04109.283390033579-0.243390033578962
21109.98109.6758076514880.304192348512174
22110.4110.672212165873-0.272212165873029
23110.99111.061795376093-0.0717953760933909
24111.23111.561944011609-0.331944011609039
25111.76111.6620594531890.0979405468107046
26112.18112.1513445248040.0286554751959045
27112.88112.6047207861520.275279213847554
28113.54113.4135556688670.126444331132959
29114.11114.184404445395-0.0744044453952313
30114.8114.7561435020560.0438564979437928
31115.56115.4451477258960.114852274104194
32116.03116.257962567499-0.227962567499191
33116.98116.6700105023840.309989497616328
34117.65117.682148781965-0.032148781965077
35118.12118.412187823821-0.292187823821166
36118.6118.766265516445-0.16626551644498
37119.03119.116709600336-0.0867096003360217
38119.82119.4759205596010.34407944039944
39120.76120.3735084872920.386491512707849
40121.4121.536858811535-0.136858811534907
41122.12122.215792227317-0.0957922273172187
42123.08122.8684593403150.211540659684744
43123.86123.884741012348-0.024741012348386
44124.46124.704672206208-0.244672206207809
45125.14125.208107281339-0.0681072813394934
46125.89125.8060190587070.083980941292765
47126.32126.571379255198-0.251379255197975
48126.93126.9275674626780.00243253732244852
49127.48127.480105909683-0.000105909683028926
50128.28128.0306313760820.249368623917718
51129.11128.9231706936310.186829306368622
52130.23129.8804181107050.349581889295365
53131.04131.173557965884-0.133557965883512
54132.2132.015147065230.184852934769907
55133.12133.21275410069-0.0927541006895183
56134.48134.1412430296140.338756970386214
57135.74135.6054518990090.134548100990799
58136.88136.994046817105-0.114046817105049
59138.12138.122952409131-0.00295240913058592
60139.99139.3353774416870.654622558312752

\begin{tabular}{lllllllll}
\hline
Interpolation Forecasts of Exponential Smoothing \tabularnewline
t & Observed & Fitted & Residuals \tabularnewline
3 & 104.01 & 104.03 & -0.019999999999996 \tabularnewline
4 & 104.28 & 104.142576138418 & 0.137423861582306 \tabularnewline
5 & 104.34 & 104.458943383734 & -0.118943383733665 \tabularnewline
6 & 104.48 & 104.506699089727 & -0.0266990897271597 \tabularnewline
7 & 104.56 & 104.609172648397 & -0.0491726483972599 \tabularnewline
8 & 104.71 & 104.664721185728 & 0.0452788142718248 \tabularnewline
9 & 104.79 & 104.820111607749 & -0.0301116077492765 \tabularnewline
10 & 104.87 & 104.899447088897 & -0.0294470888967169 \tabularnewline
11 & 104.95 & 104.961525309027 & -0.0115253090269505 \tabularnewline
12 & 105 & 105.030410255837 & -0.030410255837424 \tabularnewline
13 & 105.05 & 105.066446267081 & -0.0164462670811503 \tabularnewline
14 & 105.57 & 105.10328096306 & 0.466719036940077 \tabularnewline
15 & 105.98 & 105.792705393682 & 0.187294606317892 \tabularnewline
16 & 106.45 & 106.380589304683 & 0.069410695316634 \tabularnewline
17 & 107.13 & 106.919839583659 & 0.2101604163405 \tabularnewline
18 & 107.87 & 107.693965246217 & 0.176034753783298 \tabularnewline
19 & 108.56 & 108.54810255409 & 0.0118974459101509 \tabularnewline
20 & 109.04 & 109.283390033579 & -0.243390033578962 \tabularnewline
21 & 109.98 & 109.675807651488 & 0.304192348512174 \tabularnewline
22 & 110.4 & 110.672212165873 & -0.272212165873029 \tabularnewline
23 & 110.99 & 111.061795376093 & -0.0717953760933909 \tabularnewline
24 & 111.23 & 111.561944011609 & -0.331944011609039 \tabularnewline
25 & 111.76 & 111.662059453189 & 0.0979405468107046 \tabularnewline
26 & 112.18 & 112.151344524804 & 0.0286554751959045 \tabularnewline
27 & 112.88 & 112.604720786152 & 0.275279213847554 \tabularnewline
28 & 113.54 & 113.413555668867 & 0.126444331132959 \tabularnewline
29 & 114.11 & 114.184404445395 & -0.0744044453952313 \tabularnewline
30 & 114.8 & 114.756143502056 & 0.0438564979437928 \tabularnewline
31 & 115.56 & 115.445147725896 & 0.114852274104194 \tabularnewline
32 & 116.03 & 116.257962567499 & -0.227962567499191 \tabularnewline
33 & 116.98 & 116.670010502384 & 0.309989497616328 \tabularnewline
34 & 117.65 & 117.682148781965 & -0.032148781965077 \tabularnewline
35 & 118.12 & 118.412187823821 & -0.292187823821166 \tabularnewline
36 & 118.6 & 118.766265516445 & -0.16626551644498 \tabularnewline
37 & 119.03 & 119.116709600336 & -0.0867096003360217 \tabularnewline
38 & 119.82 & 119.475920559601 & 0.34407944039944 \tabularnewline
39 & 120.76 & 120.373508487292 & 0.386491512707849 \tabularnewline
40 & 121.4 & 121.536858811535 & -0.136858811534907 \tabularnewline
41 & 122.12 & 122.215792227317 & -0.0957922273172187 \tabularnewline
42 & 123.08 & 122.868459340315 & 0.211540659684744 \tabularnewline
43 & 123.86 & 123.884741012348 & -0.024741012348386 \tabularnewline
44 & 124.46 & 124.704672206208 & -0.244672206207809 \tabularnewline
45 & 125.14 & 125.208107281339 & -0.0681072813394934 \tabularnewline
46 & 125.89 & 125.806019058707 & 0.083980941292765 \tabularnewline
47 & 126.32 & 126.571379255198 & -0.251379255197975 \tabularnewline
48 & 126.93 & 126.927567462678 & 0.00243253732244852 \tabularnewline
49 & 127.48 & 127.480105909683 & -0.000105909683028926 \tabularnewline
50 & 128.28 & 128.030631376082 & 0.249368623917718 \tabularnewline
51 & 129.11 & 128.923170693631 & 0.186829306368622 \tabularnewline
52 & 130.23 & 129.880418110705 & 0.349581889295365 \tabularnewline
53 & 131.04 & 131.173557965884 & -0.133557965883512 \tabularnewline
54 & 132.2 & 132.01514706523 & 0.184852934769907 \tabularnewline
55 & 133.12 & 133.21275410069 & -0.0927541006895183 \tabularnewline
56 & 134.48 & 134.141243029614 & 0.338756970386214 \tabularnewline
57 & 135.74 & 135.605451899009 & 0.134548100990799 \tabularnewline
58 & 136.88 & 136.994046817105 & -0.114046817105049 \tabularnewline
59 & 138.12 & 138.122952409131 & -0.00295240913058592 \tabularnewline
60 & 139.99 & 139.335377441687 & 0.654622558312752 \tabularnewline
\hline
\end{tabular}
%Source: https://freestatistics.org/blog/index.php?pk=&T=2

[TABLE]
[ROW][C]Interpolation Forecasts of Exponential Smoothing[/C][/ROW]
[ROW][C]t[/C][C]Observed[/C][C]Fitted[/C][C]Residuals[/C][/ROW]
[ROW][C]3[/C][C]104.01[/C][C]104.03[/C][C]-0.019999999999996[/C][/ROW]
[ROW][C]4[/C][C]104.28[/C][C]104.142576138418[/C][C]0.137423861582306[/C][/ROW]
[ROW][C]5[/C][C]104.34[/C][C]104.458943383734[/C][C]-0.118943383733665[/C][/ROW]
[ROW][C]6[/C][C]104.48[/C][C]104.506699089727[/C][C]-0.0266990897271597[/C][/ROW]
[ROW][C]7[/C][C]104.56[/C][C]104.609172648397[/C][C]-0.0491726483972599[/C][/ROW]
[ROW][C]8[/C][C]104.71[/C][C]104.664721185728[/C][C]0.0452788142718248[/C][/ROW]
[ROW][C]9[/C][C]104.79[/C][C]104.820111607749[/C][C]-0.0301116077492765[/C][/ROW]
[ROW][C]10[/C][C]104.87[/C][C]104.899447088897[/C][C]-0.0294470888967169[/C][/ROW]
[ROW][C]11[/C][C]104.95[/C][C]104.961525309027[/C][C]-0.0115253090269505[/C][/ROW]
[ROW][C]12[/C][C]105[/C][C]105.030410255837[/C][C]-0.030410255837424[/C][/ROW]
[ROW][C]13[/C][C]105.05[/C][C]105.066446267081[/C][C]-0.0164462670811503[/C][/ROW]
[ROW][C]14[/C][C]105.57[/C][C]105.10328096306[/C][C]0.466719036940077[/C][/ROW]
[ROW][C]15[/C][C]105.98[/C][C]105.792705393682[/C][C]0.187294606317892[/C][/ROW]
[ROW][C]16[/C][C]106.45[/C][C]106.380589304683[/C][C]0.069410695316634[/C][/ROW]
[ROW][C]17[/C][C]107.13[/C][C]106.919839583659[/C][C]0.2101604163405[/C][/ROW]
[ROW][C]18[/C][C]107.87[/C][C]107.693965246217[/C][C]0.176034753783298[/C][/ROW]
[ROW][C]19[/C][C]108.56[/C][C]108.54810255409[/C][C]0.0118974459101509[/C][/ROW]
[ROW][C]20[/C][C]109.04[/C][C]109.283390033579[/C][C]-0.243390033578962[/C][/ROW]
[ROW][C]21[/C][C]109.98[/C][C]109.675807651488[/C][C]0.304192348512174[/C][/ROW]
[ROW][C]22[/C][C]110.4[/C][C]110.672212165873[/C][C]-0.272212165873029[/C][/ROW]
[ROW][C]23[/C][C]110.99[/C][C]111.061795376093[/C][C]-0.0717953760933909[/C][/ROW]
[ROW][C]24[/C][C]111.23[/C][C]111.561944011609[/C][C]-0.331944011609039[/C][/ROW]
[ROW][C]25[/C][C]111.76[/C][C]111.662059453189[/C][C]0.0979405468107046[/C][/ROW]
[ROW][C]26[/C][C]112.18[/C][C]112.151344524804[/C][C]0.0286554751959045[/C][/ROW]
[ROW][C]27[/C][C]112.88[/C][C]112.604720786152[/C][C]0.275279213847554[/C][/ROW]
[ROW][C]28[/C][C]113.54[/C][C]113.413555668867[/C][C]0.126444331132959[/C][/ROW]
[ROW][C]29[/C][C]114.11[/C][C]114.184404445395[/C][C]-0.0744044453952313[/C][/ROW]
[ROW][C]30[/C][C]114.8[/C][C]114.756143502056[/C][C]0.0438564979437928[/C][/ROW]
[ROW][C]31[/C][C]115.56[/C][C]115.445147725896[/C][C]0.114852274104194[/C][/ROW]
[ROW][C]32[/C][C]116.03[/C][C]116.257962567499[/C][C]-0.227962567499191[/C][/ROW]
[ROW][C]33[/C][C]116.98[/C][C]116.670010502384[/C][C]0.309989497616328[/C][/ROW]
[ROW][C]34[/C][C]117.65[/C][C]117.682148781965[/C][C]-0.032148781965077[/C][/ROW]
[ROW][C]35[/C][C]118.12[/C][C]118.412187823821[/C][C]-0.292187823821166[/C][/ROW]
[ROW][C]36[/C][C]118.6[/C][C]118.766265516445[/C][C]-0.16626551644498[/C][/ROW]
[ROW][C]37[/C][C]119.03[/C][C]119.116709600336[/C][C]-0.0867096003360217[/C][/ROW]
[ROW][C]38[/C][C]119.82[/C][C]119.475920559601[/C][C]0.34407944039944[/C][/ROW]
[ROW][C]39[/C][C]120.76[/C][C]120.373508487292[/C][C]0.386491512707849[/C][/ROW]
[ROW][C]40[/C][C]121.4[/C][C]121.536858811535[/C][C]-0.136858811534907[/C][/ROW]
[ROW][C]41[/C][C]122.12[/C][C]122.215792227317[/C][C]-0.0957922273172187[/C][/ROW]
[ROW][C]42[/C][C]123.08[/C][C]122.868459340315[/C][C]0.211540659684744[/C][/ROW]
[ROW][C]43[/C][C]123.86[/C][C]123.884741012348[/C][C]-0.024741012348386[/C][/ROW]
[ROW][C]44[/C][C]124.46[/C][C]124.704672206208[/C][C]-0.244672206207809[/C][/ROW]
[ROW][C]45[/C][C]125.14[/C][C]125.208107281339[/C][C]-0.0681072813394934[/C][/ROW]
[ROW][C]46[/C][C]125.89[/C][C]125.806019058707[/C][C]0.083980941292765[/C][/ROW]
[ROW][C]47[/C][C]126.32[/C][C]126.571379255198[/C][C]-0.251379255197975[/C][/ROW]
[ROW][C]48[/C][C]126.93[/C][C]126.927567462678[/C][C]0.00243253732244852[/C][/ROW]
[ROW][C]49[/C][C]127.48[/C][C]127.480105909683[/C][C]-0.000105909683028926[/C][/ROW]
[ROW][C]50[/C][C]128.28[/C][C]128.030631376082[/C][C]0.249368623917718[/C][/ROW]
[ROW][C]51[/C][C]129.11[/C][C]128.923170693631[/C][C]0.186829306368622[/C][/ROW]
[ROW][C]52[/C][C]130.23[/C][C]129.880418110705[/C][C]0.349581889295365[/C][/ROW]
[ROW][C]53[/C][C]131.04[/C][C]131.173557965884[/C][C]-0.133557965883512[/C][/ROW]
[ROW][C]54[/C][C]132.2[/C][C]132.01514706523[/C][C]0.184852934769907[/C][/ROW]
[ROW][C]55[/C][C]133.12[/C][C]133.21275410069[/C][C]-0.0927541006895183[/C][/ROW]
[ROW][C]56[/C][C]134.48[/C][C]134.141243029614[/C][C]0.338756970386214[/C][/ROW]
[ROW][C]57[/C][C]135.74[/C][C]135.605451899009[/C][C]0.134548100990799[/C][/ROW]
[ROW][C]58[/C][C]136.88[/C][C]136.994046817105[/C][C]-0.114046817105049[/C][/ROW]
[ROW][C]59[/C][C]138.12[/C][C]138.122952409131[/C][C]-0.00295240913058592[/C][/ROW]
[ROW][C]60[/C][C]139.99[/C][C]139.335377441687[/C][C]0.654622558312752[/C][/ROW]
[/TABLE]
Source: https://freestatistics.org/blog/index.php?pk=&T=2

Globally Unique Identifier (entire table): ba.freestatistics.org/blog/index.php?pk=&T=2

As an alternative you can also use a QR Code:  

The GUIDs for individual cells are displayed in the table below:

Interpolation Forecasts of Exponential Smoothing
tObservedFittedResiduals
3104.01104.03-0.019999999999996
4104.28104.1425761384180.137423861582306
5104.34104.458943383734-0.118943383733665
6104.48104.506699089727-0.0266990897271597
7104.56104.609172648397-0.0491726483972599
8104.71104.6647211857280.0452788142718248
9104.79104.820111607749-0.0301116077492765
10104.87104.899447088897-0.0294470888967169
11104.95104.961525309027-0.0115253090269505
12105105.030410255837-0.030410255837424
13105.05105.066446267081-0.0164462670811503
14105.57105.103280963060.466719036940077
15105.98105.7927053936820.187294606317892
16106.45106.3805893046830.069410695316634
17107.13106.9198395836590.2101604163405
18107.87107.6939652462170.176034753783298
19108.56108.548102554090.0118974459101509
20109.04109.283390033579-0.243390033578962
21109.98109.6758076514880.304192348512174
22110.4110.672212165873-0.272212165873029
23110.99111.061795376093-0.0717953760933909
24111.23111.561944011609-0.331944011609039
25111.76111.6620594531890.0979405468107046
26112.18112.1513445248040.0286554751959045
27112.88112.6047207861520.275279213847554
28113.54113.4135556688670.126444331132959
29114.11114.184404445395-0.0744044453952313
30114.8114.7561435020560.0438564979437928
31115.56115.4451477258960.114852274104194
32116.03116.257962567499-0.227962567499191
33116.98116.6700105023840.309989497616328
34117.65117.682148781965-0.032148781965077
35118.12118.412187823821-0.292187823821166
36118.6118.766265516445-0.16626551644498
37119.03119.116709600336-0.0867096003360217
38119.82119.4759205596010.34407944039944
39120.76120.3735084872920.386491512707849
40121.4121.536858811535-0.136858811534907
41122.12122.215792227317-0.0957922273172187
42123.08122.8684593403150.211540659684744
43123.86123.884741012348-0.024741012348386
44124.46124.704672206208-0.244672206207809
45125.14125.208107281339-0.0681072813394934
46125.89125.8060190587070.083980941292765
47126.32126.571379255198-0.251379255197975
48126.93126.9275674626780.00243253732244852
49127.48127.480105909683-0.000105909683028926
50128.28128.0306313760820.249368623917718
51129.11128.9231706936310.186829306368622
52130.23129.8804181107050.349581889295365
53131.04131.173557965884-0.133557965883512
54132.2132.015147065230.184852934769907
55133.12133.21275410069-0.0927541006895183
56134.48134.1412430296140.338756970386214
57135.74135.6054518990090.134548100990799
58136.88136.994046817105-0.114046817105049
59138.12138.122952409131-0.00295240913058592
60139.99139.3353774416870.654622558312752


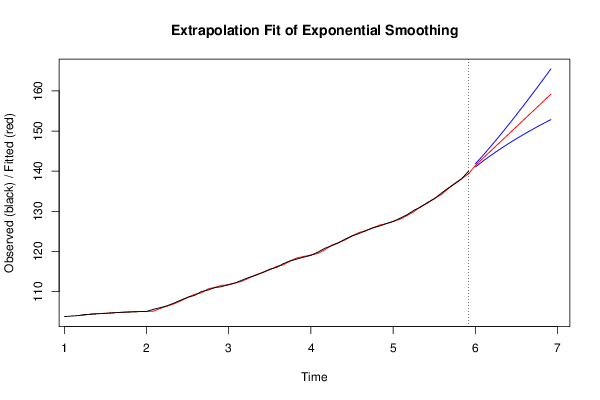
Extrapolation Forecasts of Exponential Smoothing
tForecast95% Lower Bound95% Upper Bound
61141.447683323123141.050887092047141.844479554198
62143.057354980985142.383949519468143.730760442501
63144.667026638847143.633902264214145.70015101348
64146.276698296709144.822841529122147.730555064296
65147.886369954571145.960967509554149.811772399589
66149.496041612433147.054236895548151.937846329319
67151.105713270295148.106705821303154.104720719288
68152.715384928158149.121401085054156.309368771261
69154.32505658602150.100713807596158.549399364444
70155.934728243882151.046605813686160.822850674078
71157.544399901744151.960730329548163.12806947394
72159.154071559606152.84450850149165.463634617722

\begin{tabular}{lllllllll}
\hline
Extrapolation Forecasts of Exponential Smoothing \tabularnewline
t & Forecast & 95% Lower Bound & 95% Upper Bound \tabularnewline
61 & 141.447683323123 & 141.050887092047 & 141.844479554198 \tabularnewline
62 & 143.057354980985 & 142.383949519468 & 143.730760442501 \tabularnewline
63 & 144.667026638847 & 143.633902264214 & 145.70015101348 \tabularnewline
64 & 146.276698296709 & 144.822841529122 & 147.730555064296 \tabularnewline
65 & 147.886369954571 & 145.960967509554 & 149.811772399589 \tabularnewline
66 & 149.496041612433 & 147.054236895548 & 151.937846329319 \tabularnewline
67 & 151.105713270295 & 148.106705821303 & 154.104720719288 \tabularnewline
68 & 152.715384928158 & 149.121401085054 & 156.309368771261 \tabularnewline
69 & 154.32505658602 & 150.100713807596 & 158.549399364444 \tabularnewline
70 & 155.934728243882 & 151.046605813686 & 160.822850674078 \tabularnewline
71 & 157.544399901744 & 151.960730329548 & 163.12806947394 \tabularnewline
72 & 159.154071559606 & 152.84450850149 & 165.463634617722 \tabularnewline
\hline
\end{tabular}
%Source: https://freestatistics.org/blog/index.php?pk=&T=3

[TABLE]
[ROW][C]Extrapolation Forecasts of Exponential Smoothing[/C][/ROW]
[ROW][C]t[/C][C]Forecast[/C][C]95% Lower Bound[/C][C]95% Upper Bound[/C][/ROW]
[ROW][C]61[/C][C]141.447683323123[/C][C]141.050887092047[/C][C]141.844479554198[/C][/ROW]
[ROW][C]62[/C][C]143.057354980985[/C][C]142.383949519468[/C][C]143.730760442501[/C][/ROW]
[ROW][C]63[/C][C]144.667026638847[/C][C]143.633902264214[/C][C]145.70015101348[/C][/ROW]
[ROW][C]64[/C][C]146.276698296709[/C][C]144.822841529122[/C][C]147.730555064296[/C][/ROW]
[ROW][C]65[/C][C]147.886369954571[/C][C]145.960967509554[/C][C]149.811772399589[/C][/ROW]
[ROW][C]66[/C][C]149.496041612433[/C][C]147.054236895548[/C][C]151.937846329319[/C][/ROW]
[ROW][C]67[/C][C]151.105713270295[/C][C]148.106705821303[/C][C]154.104720719288[/C][/ROW]
[ROW][C]68[/C][C]152.715384928158[/C][C]149.121401085054[/C][C]156.309368771261[/C][/ROW]
[ROW][C]69[/C][C]154.32505658602[/C][C]150.100713807596[/C][C]158.549399364444[/C][/ROW]
[ROW][C]70[/C][C]155.934728243882[/C][C]151.046605813686[/C][C]160.822850674078[/C][/ROW]
[ROW][C]71[/C][C]157.544399901744[/C][C]151.960730329548[/C][C]163.12806947394[/C][/ROW]
[ROW][C]72[/C][C]159.154071559606[/C][C]152.84450850149[/C][C]165.463634617722[/C][/ROW]
[/TABLE]
Source: https://freestatistics.org/blog/index.php?pk=&T=3

Globally Unique Identifier (entire table): ba.freestatistics.org/blog/index.php?pk=&T=3

As an alternative you can also use a QR Code:  

The GUIDs for individual cells are displayed in the table below:

Extrapolation Forecasts of Exponential Smoothing
tForecast95% Lower Bound95% Upper Bound
61141.447683323123141.050887092047141.844479554198
62143.057354980985142.383949519468143.730760442501
63144.667026638847143.633902264214145.70015101348
64146.276698296709144.822841529122147.730555064296
65147.886369954571145.960967509554149.811772399589
66149.496041612433147.054236895548151.937846329319
67151.105713270295148.106705821303154.104720719288
68152.715384928158149.121401085054156.309368771261
69154.32505658602150.100713807596158.549399364444
70155.934728243882151.046605813686160.822850674078
71157.544399901744151.960730329548163.12806947394
72159.154071559606152.84450850149165.463634617722


Parameters (Session):
par1 = 12 ; par2 = Double ; par3 = multiplicative ;
Parameters (R input):
par1 = 12 ; par2 = Double ; par3 = multiplicative ;
R code (references can be found in the software module):
par1 <- as.numeric(par1)
if (par2 == 'Single') K <- 1
if (par2 == 'Double') K <- 2
if (par2 == 'Triple') K <- par1
nx <- length(x)
nxmK <- nx - K
x <- ts(x, frequency = par1)
if (par2 == 'Single') fit <- HoltWinters(x, gamma=F, beta=F)
if (par2 == 'Double') fit <- HoltWinters(x, gamma=F)
if (par2 == 'Triple') fit <- HoltWinters(x, seasonal=par3)
fit
myresid <- x - fit$fitted[,'xhat']
bitmap(file='test1.png')
op <- par(mfrow=c(2,1))
plot(fit,ylab='Observed (black) / Fitted (red)',main='Interpolation Fit of Exponential Smoothing')
plot(myresid,ylab='Residuals',main='Interpolation Prediction Errors')
par(op)
dev.off()
bitmap(file='test2.png')
p <- predict(fit, par1, prediction.interval=TRUE)
np <- length(p[,1])
plot(fit,p,ylab='Observed (black) / Fitted (red)',main='Extrapolation Fit of Exponential Smoothing')
dev.off()
bitmap(file='test3.png')
op <- par(mfrow = c(2,2))
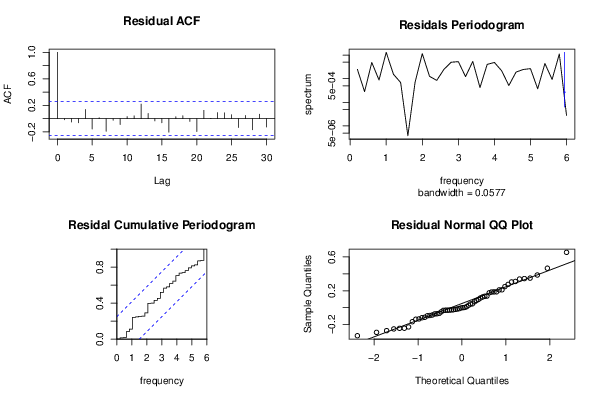
acf(as.numeric(myresid),lag.max = nx/2,main='Residual ACF')
spectrum(myresid,main='Residals Periodogram')
cpgram(myresid,main='Residal Cumulative Periodogram')
qqnorm(myresid,main='Residual Normal QQ Plot')
qqline(myresid)
par(op)
dev.off()
load(file='createtable')
a<-table.start()
a<-table.row.start(a)
a<-table.element(a,'Estimated Parameters of Exponential Smoothing',2,TRUE)
a<-table.row.end(a)
a<-table.row.start(a)
a<-table.element(a,'Parameter',header=TRUE)
a<-table.element(a,'Value',header=TRUE)
a<-table.row.end(a)
a<-table.row.start(a)
a<-table.element(a,'alpha',header=TRUE)
a<-table.element(a,fit$alpha)
a<-table.row.end(a)
a<-table.row.start(a)
a<-table.element(a,'beta',header=TRUE)
a<-table.element(a,fit$beta)
a<-table.row.end(a)
a<-table.row.start(a)
a<-table.element(a,'gamma',header=TRUE)
a<-table.element(a,fit$gamma)
a<-table.row.end(a)
a<-table.end(a)
table.save(a,file='mytable.tab')
a<-table.start()
a<-table.row.start(a)
a<-table.element(a,'Interpolation Forecasts of Exponential Smoothing',4,TRUE)
a<-table.row.end(a)
a<-table.row.start(a)
a<-table.element(a,'t',header=TRUE)
a<-table.element(a,'Observed',header=TRUE)
a<-table.element(a,'Fitted',header=TRUE)
a<-table.element(a,'Residuals',header=TRUE)
a<-table.row.end(a)
for (i in 1:nxmK) {
a<-table.row.start(a)
a<-table.element(a,i+K,header=TRUE)
a<-table.element(a,x[i+K])
a<-table.element(a,fit$fitted[i,'xhat'])
a<-table.element(a,myresid[i])
a<-table.row.end(a)
}
a<-table.end(a)
table.save(a,file='mytable1.tab')
a<-table.start()
a<-table.row.start(a)
a<-table.element(a,'Extrapolation Forecasts of Exponential Smoothing',4,TRUE)
a<-table.row.end(a)
a<-table.row.start(a)
a<-table.element(a,'t',header=TRUE)
a<-table.element(a,'Forecast',header=TRUE)
a<-table.element(a,'95% Lower Bound',header=TRUE)
a<-table.element(a,'95% Upper Bound',header=TRUE)
a<-table.row.end(a)
for (i in 1:np) {
a<-table.row.start(a)
a<-table.element(a,nx+i,header=TRUE)
a<-table.element(a,p[i,'fit'])
a<-table.element(a,p[i,'lwr'])
a<-table.element(a,p[i,'upr'])
a<-table.row.end(a)
}
a<-table.end(a)
table.save(a,file='mytable2.tab')