Free Statistics

of Irreproducible Research!

Author's title

Author*Unverified author*
R Software Modulerwasp_autocorrelation.wasp
Title produced by software(Partial) Autocorrelation Function
Date of computationTue, 15 Aug 2017 11:51:51 +0200
Cite this page as followsStatistical Computations at FreeStatistics.org, Office for Research Development and Education, URL https://freestatistics.org/blog/index.php?v=date/2017/Aug/15/t1502790744e92bxgq3p3rvszw.htm/, Retrieved Fri, 17 May 2024 07:44:48 +0000
Statistical Computations at FreeStatistics.org, Office for Research Development and Education, URL https://freestatistics.org/blog/index.php?pk=307267, Retrieved Fri, 17 May 2024 07:44:48 +0000
QR Codes:

Original text written by user:
IsPrivate?No (this computation is public)
User-defined keywords
Estimated Impact82
Family? (F = Feedback message, R = changed R code, M = changed R Module, P = changed Parameters, D = changed Data)
-       [(Partial) Autocorrelation Function] [] [2017-08-15 09:51:51] [f8975010d6e80ebfdd11eb899305ce74] [Current]
Feedback Forum

Post a new message
Dataseries X:
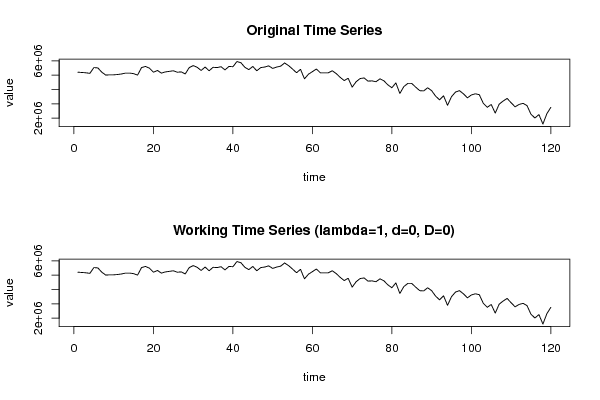
5204472
5185089
5165433
5124756
5527158
5505864
5204472
5004090
5023473
5023473
5045040
5083806
5144139
5144139
5105373
5004090
5527158
5606874
5486481
5204472
5325138
5144139
5225766
5264805
5305482
5204472
5225766
5083806
5527158
5667207
5546814
5325138
5566197
5305482
5546814
5527158
5587491
5365815
5606874
5587491
5949216
5867589
5546814
5385198
5606874
5305482
5527158
5566197
5647824
5467098
5566197
5626530
5848206
5667207
5426148
5165433
5406765
4743375
5064423
5245149
5426148
5165433
5165433
5165433
5305482
5105373
4842747
4622982
4782414
4159974
4541355
4763031
4803708
4582032
4601415
4541355
4743375
4601415
4321590
4119297
4461366
3718533
4200924
4420689
4420689
4159974
3918915
3899532
4119297
3918915
3537807
3275181
3557190
2894073
3496857
3817632
3918915
3697239
3417141
3617523
3697239
3636906
3033849
2754024
2954133
2351349
2973789
3195465
3376191
3074799
2792790
2954133
3033849
2874417
2271633
2009007
2250066
1586949
2310399
2754024


Summary of computational transaction
Raw Input view raw input (R code)
Raw Outputview raw output of R engine
Computing time2 seconds
R ServerBig Analytics Cloud Computing Center

\begin{tabular}{lllllllll}
\hline
Summary of computational transaction \tabularnewline
Raw Input view raw input (R code)  \tabularnewline
Raw Outputview raw output of R engine  \tabularnewline
Computing time2 seconds \tabularnewline
R ServerBig Analytics Cloud Computing Center \tabularnewline
\hline
\end{tabular}
%Source: https://freestatistics.org/blog/index.php?pk=307267&T=0

[TABLE]
[ROW]
Summary of computational transaction[/C][/ROW] [ROW]Raw Input[/C] view raw input (R code) [/C][/ROW] [ROW]Raw Output[/C]view raw output of R engine [/C][/ROW] [ROW]Computing time[/C]2 seconds[/C][/ROW] [ROW]R Server[/C]Big Analytics Cloud Computing Center[/C][/ROW] [/TABLE] Source: https://freestatistics.org/blog/index.php?pk=307267&T=0

Globally Unique Identifier (entire table): ba.freestatistics.org/blog/index.php?pk=307267&T=0

As an alternative you can also use a QR Code:  

The GUIDs for individual cells are displayed in the table below:

Summary of computational transaction
Raw Input view raw input (R code)
Raw Outputview raw output of R engine
Computing time2 seconds
R ServerBig Analytics Cloud Computing Center


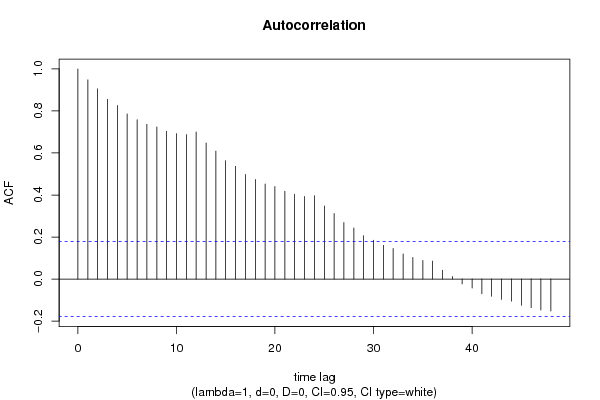
Autocorrelation Function
Time lag kACF(k)T-STATP-value
10.94790310.38380
20.9052669.91670
30.8557299.3740
40.8262069.05060
50.785688.60670
60.7579688.30310
70.7361898.06450
80.7236547.92720
90.7031827.7030
100.6921027.58160
110.6875717.5320
120.7001337.66960
130.647967.0980
140.6088366.66950
150.5635126.1730
160.5363635.87560
170.4979735.4550
180.4738355.19060
190.4526914.9591e-06
200.440014.82012e-06
210.4182934.58226e-06
220.4033944.4191.1e-05
230.3933244.30871.7e-05
240.3968984.34781.4e-05
250.3480743.8130.000109
260.3117633.41520.000435
270.2687162.94360.001948
280.243362.66590.004369
290.2063782.26080.012788
300.1844192.02020.022794
310.1603371.75640.040785
320.1452791.59150.057069
330.119031.30390.09738
340.1022791.12040.132388
350.0881890.96610.167977
360.0855640.93730.17524
370.0421530.46180.322544
380.0125270.13720.445541
39-0.023121-0.25330.400243
40-0.042346-0.46390.321788
41-0.070055-0.76740.22217
42-0.081845-0.89660.185873
43-0.096617-1.05840.146003
44-0.105098-1.15130.125951
45-0.124959-1.36890.086801
46-0.136033-1.49020.069402
47-0.147634-1.61720.054226
48-0.152258-1.66790.048972

\begin{tabular}{lllllllll}
\hline
Autocorrelation Function \tabularnewline
Time lag k & ACF(k) & T-STAT & P-value \tabularnewline
1 & 0.947903 & 10.3838 & 0 \tabularnewline
2 & 0.905266 & 9.9167 & 0 \tabularnewline
3 & 0.855729 & 9.374 & 0 \tabularnewline
4 & 0.826206 & 9.0506 & 0 \tabularnewline
5 & 0.78568 & 8.6067 & 0 \tabularnewline
6 & 0.757968 & 8.3031 & 0 \tabularnewline
7 & 0.736189 & 8.0645 & 0 \tabularnewline
8 & 0.723654 & 7.9272 & 0 \tabularnewline
9 & 0.703182 & 7.703 & 0 \tabularnewline
10 & 0.692102 & 7.5816 & 0 \tabularnewline
11 & 0.687571 & 7.532 & 0 \tabularnewline
12 & 0.700133 & 7.6696 & 0 \tabularnewline
13 & 0.64796 & 7.098 & 0 \tabularnewline
14 & 0.608836 & 6.6695 & 0 \tabularnewline
15 & 0.563512 & 6.173 & 0 \tabularnewline
16 & 0.536363 & 5.8756 & 0 \tabularnewline
17 & 0.497973 & 5.455 & 0 \tabularnewline
18 & 0.473835 & 5.1906 & 0 \tabularnewline
19 & 0.452691 & 4.959 & 1e-06 \tabularnewline
20 & 0.44001 & 4.8201 & 2e-06 \tabularnewline
21 & 0.418293 & 4.5822 & 6e-06 \tabularnewline
22 & 0.403394 & 4.419 & 1.1e-05 \tabularnewline
23 & 0.393324 & 4.3087 & 1.7e-05 \tabularnewline
24 & 0.396898 & 4.3478 & 1.4e-05 \tabularnewline
25 & 0.348074 & 3.813 & 0.000109 \tabularnewline
26 & 0.311763 & 3.4152 & 0.000435 \tabularnewline
27 & 0.268716 & 2.9436 & 0.001948 \tabularnewline
28 & 0.24336 & 2.6659 & 0.004369 \tabularnewline
29 & 0.206378 & 2.2608 & 0.012788 \tabularnewline
30 & 0.184419 & 2.0202 & 0.022794 \tabularnewline
31 & 0.160337 & 1.7564 & 0.040785 \tabularnewline
32 & 0.145279 & 1.5915 & 0.057069 \tabularnewline
33 & 0.11903 & 1.3039 & 0.09738 \tabularnewline
34 & 0.102279 & 1.1204 & 0.132388 \tabularnewline
35 & 0.088189 & 0.9661 & 0.167977 \tabularnewline
36 & 0.085564 & 0.9373 & 0.17524 \tabularnewline
37 & 0.042153 & 0.4618 & 0.322544 \tabularnewline
38 & 0.012527 & 0.1372 & 0.445541 \tabularnewline
39 & -0.023121 & -0.2533 & 0.400243 \tabularnewline
40 & -0.042346 & -0.4639 & 0.321788 \tabularnewline
41 & -0.070055 & -0.7674 & 0.22217 \tabularnewline
42 & -0.081845 & -0.8966 & 0.185873 \tabularnewline
43 & -0.096617 & -1.0584 & 0.146003 \tabularnewline
44 & -0.105098 & -1.1513 & 0.125951 \tabularnewline
45 & -0.124959 & -1.3689 & 0.086801 \tabularnewline
46 & -0.136033 & -1.4902 & 0.069402 \tabularnewline
47 & -0.147634 & -1.6172 & 0.054226 \tabularnewline
48 & -0.152258 & -1.6679 & 0.048972 \tabularnewline
\hline
\end{tabular}
%Source: https://freestatistics.org/blog/index.php?pk=307267&T=1

[TABLE]
[ROW][C]Autocorrelation Function[/C][/ROW]
[ROW][C]Time lag k[/C][C]ACF(k)[/C][C]T-STAT[/C][C]P-value[/C][/ROW]
[ROW][C]1[/C][C]0.947903[/C][C]10.3838[/C][C]0[/C][/ROW]
[ROW][C]2[/C][C]0.905266[/C][C]9.9167[/C][C]0[/C][/ROW]
[ROW][C]3[/C][C]0.855729[/C][C]9.374[/C][C]0[/C][/ROW]
[ROW][C]4[/C][C]0.826206[/C][C]9.0506[/C][C]0[/C][/ROW]
[ROW][C]5[/C][C]0.78568[/C][C]8.6067[/C][C]0[/C][/ROW]
[ROW][C]6[/C][C]0.757968[/C][C]8.3031[/C][C]0[/C][/ROW]
[ROW][C]7[/C][C]0.736189[/C][C]8.0645[/C][C]0[/C][/ROW]
[ROW][C]8[/C][C]0.723654[/C][C]7.9272[/C][C]0[/C][/ROW]
[ROW][C]9[/C][C]0.703182[/C][C]7.703[/C][C]0[/C][/ROW]
[ROW][C]10[/C][C]0.692102[/C][C]7.5816[/C][C]0[/C][/ROW]
[ROW][C]11[/C][C]0.687571[/C][C]7.532[/C][C]0[/C][/ROW]
[ROW][C]12[/C][C]0.700133[/C][C]7.6696[/C][C]0[/C][/ROW]
[ROW][C]13[/C][C]0.64796[/C][C]7.098[/C][C]0[/C][/ROW]
[ROW][C]14[/C][C]0.608836[/C][C]6.6695[/C][C]0[/C][/ROW]
[ROW][C]15[/C][C]0.563512[/C][C]6.173[/C][C]0[/C][/ROW]
[ROW][C]16[/C][C]0.536363[/C][C]5.8756[/C][C]0[/C][/ROW]
[ROW][C]17[/C][C]0.497973[/C][C]5.455[/C][C]0[/C][/ROW]
[ROW][C]18[/C][C]0.473835[/C][C]5.1906[/C][C]0[/C][/ROW]
[ROW][C]19[/C][C]0.452691[/C][C]4.959[/C][C]1e-06[/C][/ROW]
[ROW][C]20[/C][C]0.44001[/C][C]4.8201[/C][C]2e-06[/C][/ROW]
[ROW][C]21[/C][C]0.418293[/C][C]4.5822[/C][C]6e-06[/C][/ROW]
[ROW][C]22[/C][C]0.403394[/C][C]4.419[/C][C]1.1e-05[/C][/ROW]
[ROW][C]23[/C][C]0.393324[/C][C]4.3087[/C][C]1.7e-05[/C][/ROW]
[ROW][C]24[/C][C]0.396898[/C][C]4.3478[/C][C]1.4e-05[/C][/ROW]
[ROW][C]25[/C][C]0.348074[/C][C]3.813[/C][C]0.000109[/C][/ROW]
[ROW][C]26[/C][C]0.311763[/C][C]3.4152[/C][C]0.000435[/C][/ROW]
[ROW][C]27[/C][C]0.268716[/C][C]2.9436[/C][C]0.001948[/C][/ROW]
[ROW][C]28[/C][C]0.24336[/C][C]2.6659[/C][C]0.004369[/C][/ROW]
[ROW][C]29[/C][C]0.206378[/C][C]2.2608[/C][C]0.012788[/C][/ROW]
[ROW][C]30[/C][C]0.184419[/C][C]2.0202[/C][C]0.022794[/C][/ROW]
[ROW][C]31[/C][C]0.160337[/C][C]1.7564[/C][C]0.040785[/C][/ROW]
[ROW][C]32[/C][C]0.145279[/C][C]1.5915[/C][C]0.057069[/C][/ROW]
[ROW][C]33[/C][C]0.11903[/C][C]1.3039[/C][C]0.09738[/C][/ROW]
[ROW][C]34[/C][C]0.102279[/C][C]1.1204[/C][C]0.132388[/C][/ROW]
[ROW][C]35[/C][C]0.088189[/C][C]0.9661[/C][C]0.167977[/C][/ROW]
[ROW][C]36[/C][C]0.085564[/C][C]0.9373[/C][C]0.17524[/C][/ROW]
[ROW][C]37[/C][C]0.042153[/C][C]0.4618[/C][C]0.322544[/C][/ROW]
[ROW][C]38[/C][C]0.012527[/C][C]0.1372[/C][C]0.445541[/C][/ROW]
[ROW][C]39[/C][C]-0.023121[/C][C]-0.2533[/C][C]0.400243[/C][/ROW]
[ROW][C]40[/C][C]-0.042346[/C][C]-0.4639[/C][C]0.321788[/C][/ROW]
[ROW][C]41[/C][C]-0.070055[/C][C]-0.7674[/C][C]0.22217[/C][/ROW]
[ROW][C]42[/C][C]-0.081845[/C][C]-0.8966[/C][C]0.185873[/C][/ROW]
[ROW][C]43[/C][C]-0.096617[/C][C]-1.0584[/C][C]0.146003[/C][/ROW]
[ROW][C]44[/C][C]-0.105098[/C][C]-1.1513[/C][C]0.125951[/C][/ROW]
[ROW][C]45[/C][C]-0.124959[/C][C]-1.3689[/C][C]0.086801[/C][/ROW]
[ROW][C]46[/C][C]-0.136033[/C][C]-1.4902[/C][C]0.069402[/C][/ROW]
[ROW][C]47[/C][C]-0.147634[/C][C]-1.6172[/C][C]0.054226[/C][/ROW]
[ROW][C]48[/C][C]-0.152258[/C][C]-1.6679[/C][C]0.048972[/C][/ROW]
[/TABLE]
Source: https://freestatistics.org/blog/index.php?pk=307267&T=1

Globally Unique Identifier (entire table): ba.freestatistics.org/blog/index.php?pk=307267&T=1

As an alternative you can also use a QR Code:  

The GUIDs for individual cells are displayed in the table below:

Autocorrelation Function
Time lag kACF(k)T-STATP-value
10.94790310.38380
20.9052669.91670
30.8557299.3740
40.8262069.05060
50.785688.60670
60.7579688.30310
70.7361898.06450
80.7236547.92720
90.7031827.7030
100.6921027.58160
110.6875717.5320
120.7001337.66960
130.647967.0980
140.6088366.66950
150.5635126.1730
160.5363635.87560
170.4979735.4550
180.4738355.19060
190.4526914.9591e-06
200.440014.82012e-06
210.4182934.58226e-06
220.4033944.4191.1e-05
230.3933244.30871.7e-05
240.3968984.34781.4e-05
250.3480743.8130.000109
260.3117633.41520.000435
270.2687162.94360.001948
280.243362.66590.004369
290.2063782.26080.012788
300.1844192.02020.022794
310.1603371.75640.040785
320.1452791.59150.057069
330.119031.30390.09738
340.1022791.12040.132388
350.0881890.96610.167977
360.0855640.93730.17524
370.0421530.46180.322544
380.0125270.13720.445541
39-0.023121-0.25330.400243
40-0.042346-0.46390.321788
41-0.070055-0.76740.22217
42-0.081845-0.89660.185873
43-0.096617-1.05840.146003
44-0.105098-1.15130.125951
45-0.124959-1.36890.086801
46-0.136033-1.49020.069402
47-0.147634-1.61720.054226
48-0.152258-1.66790.048972


Partial Autocorrelation Function
Time lag kPACF(k)T-STATP-value
10.94790310.38380
20.0664850.72830.233921
3-0.082604-0.90490.18367
40.1617561.77190.039471
5-0.095006-1.04070.150044
60.0752330.82410.205747
70.1033481.13210.129921
80.0490890.53770.295874
9-0.040338-0.44190.329684
100.0882590.96680.167786
110.1024121.12190.132079
120.1708631.87170.031841
13-0.617564-6.76510
140.1401171.53490.06372
150.0791090.86660.193946
16-0.101788-1.1150.133532
170.0628720.68870.246163
180.0384160.42080.337316
19-0.041005-0.44920.327054
200.026510.29040.386003
21-0.026507-0.29040.386017
220.0847270.92810.177601
23-0.085814-0.940.17454
24-0.059736-0.65440.257061
25-0.132117-1.44730.075215
260.0095640.10480.458367
270.0063860.070.472174
28-0.014108-0.15450.438721
29-0.004643-0.05090.47976
300.0057190.06260.475076
31-0.091586-1.00330.158874
320.0335910.3680.356771
33-0.043549-0.47710.317095
340.0585110.6410.261385
35-0.071713-0.78560.216831
36-0.075129-0.8230.20607
370.0145270.15910.436916
380.0073090.08010.46816
39-0.021755-0.23830.406022
400.0172970.18950.425017
410.0142180.15570.438247
420.0038790.04250.483088
43-0.02902-0.31790.375557
44-0.021908-0.240.405372
450.0166560.18250.427764
46-0.028062-0.30740.379534
47-0.067435-0.73870.230761
48-0.046562-0.51010.305474

\begin{tabular}{lllllllll}
\hline
Partial Autocorrelation Function \tabularnewline
Time lag k & PACF(k) & T-STAT & P-value \tabularnewline
1 & 0.947903 & 10.3838 & 0 \tabularnewline
2 & 0.066485 & 0.7283 & 0.233921 \tabularnewline
3 & -0.082604 & -0.9049 & 0.18367 \tabularnewline
4 & 0.161756 & 1.7719 & 0.039471 \tabularnewline
5 & -0.095006 & -1.0407 & 0.150044 \tabularnewline
6 & 0.075233 & 0.8241 & 0.205747 \tabularnewline
7 & 0.103348 & 1.1321 & 0.129921 \tabularnewline
8 & 0.049089 & 0.5377 & 0.295874 \tabularnewline
9 & -0.040338 & -0.4419 & 0.329684 \tabularnewline
10 & 0.088259 & 0.9668 & 0.167786 \tabularnewline
11 & 0.102412 & 1.1219 & 0.132079 \tabularnewline
12 & 0.170863 & 1.8717 & 0.031841 \tabularnewline
13 & -0.617564 & -6.7651 & 0 \tabularnewline
14 & 0.140117 & 1.5349 & 0.06372 \tabularnewline
15 & 0.079109 & 0.8666 & 0.193946 \tabularnewline
16 & -0.101788 & -1.115 & 0.133532 \tabularnewline
17 & 0.062872 & 0.6887 & 0.246163 \tabularnewline
18 & 0.038416 & 0.4208 & 0.337316 \tabularnewline
19 & -0.041005 & -0.4492 & 0.327054 \tabularnewline
20 & 0.02651 & 0.2904 & 0.386003 \tabularnewline
21 & -0.026507 & -0.2904 & 0.386017 \tabularnewline
22 & 0.084727 & 0.9281 & 0.177601 \tabularnewline
23 & -0.085814 & -0.94 & 0.17454 \tabularnewline
24 & -0.059736 & -0.6544 & 0.257061 \tabularnewline
25 & -0.132117 & -1.4473 & 0.075215 \tabularnewline
26 & 0.009564 & 0.1048 & 0.458367 \tabularnewline
27 & 0.006386 & 0.07 & 0.472174 \tabularnewline
28 & -0.014108 & -0.1545 & 0.438721 \tabularnewline
29 & -0.004643 & -0.0509 & 0.47976 \tabularnewline
30 & 0.005719 & 0.0626 & 0.475076 \tabularnewline
31 & -0.091586 & -1.0033 & 0.158874 \tabularnewline
32 & 0.033591 & 0.368 & 0.356771 \tabularnewline
33 & -0.043549 & -0.4771 & 0.317095 \tabularnewline
34 & 0.058511 & 0.641 & 0.261385 \tabularnewline
35 & -0.071713 & -0.7856 & 0.216831 \tabularnewline
36 & -0.075129 & -0.823 & 0.20607 \tabularnewline
37 & 0.014527 & 0.1591 & 0.436916 \tabularnewline
38 & 0.007309 & 0.0801 & 0.46816 \tabularnewline
39 & -0.021755 & -0.2383 & 0.406022 \tabularnewline
40 & 0.017297 & 0.1895 & 0.425017 \tabularnewline
41 & 0.014218 & 0.1557 & 0.438247 \tabularnewline
42 & 0.003879 & 0.0425 & 0.483088 \tabularnewline
43 & -0.02902 & -0.3179 & 0.375557 \tabularnewline
44 & -0.021908 & -0.24 & 0.405372 \tabularnewline
45 & 0.016656 & 0.1825 & 0.427764 \tabularnewline
46 & -0.028062 & -0.3074 & 0.379534 \tabularnewline
47 & -0.067435 & -0.7387 & 0.230761 \tabularnewline
48 & -0.046562 & -0.5101 & 0.305474 \tabularnewline
\hline
\end{tabular}
%Source: https://freestatistics.org/blog/index.php?pk=307267&T=2

[TABLE]
[ROW][C]Partial Autocorrelation Function[/C][/ROW]
[ROW][C]Time lag k[/C][C]PACF(k)[/C][C]T-STAT[/C][C]P-value[/C][/ROW]
[ROW][C]1[/C][C]0.947903[/C][C]10.3838[/C][C]0[/C][/ROW]
[ROW][C]2[/C][C]0.066485[/C][C]0.7283[/C][C]0.233921[/C][/ROW]
[ROW][C]3[/C][C]-0.082604[/C][C]-0.9049[/C][C]0.18367[/C][/ROW]
[ROW][C]4[/C][C]0.161756[/C][C]1.7719[/C][C]0.039471[/C][/ROW]
[ROW][C]5[/C][C]-0.095006[/C][C]-1.0407[/C][C]0.150044[/C][/ROW]
[ROW][C]6[/C][C]0.075233[/C][C]0.8241[/C][C]0.205747[/C][/ROW]
[ROW][C]7[/C][C]0.103348[/C][C]1.1321[/C][C]0.129921[/C][/ROW]
[ROW][C]8[/C][C]0.049089[/C][C]0.5377[/C][C]0.295874[/C][/ROW]
[ROW][C]9[/C][C]-0.040338[/C][C]-0.4419[/C][C]0.329684[/C][/ROW]
[ROW][C]10[/C][C]0.088259[/C][C]0.9668[/C][C]0.167786[/C][/ROW]
[ROW][C]11[/C][C]0.102412[/C][C]1.1219[/C][C]0.132079[/C][/ROW]
[ROW][C]12[/C][C]0.170863[/C][C]1.8717[/C][C]0.031841[/C][/ROW]
[ROW][C]13[/C][C]-0.617564[/C][C]-6.7651[/C][C]0[/C][/ROW]
[ROW][C]14[/C][C]0.140117[/C][C]1.5349[/C][C]0.06372[/C][/ROW]
[ROW][C]15[/C][C]0.079109[/C][C]0.8666[/C][C]0.193946[/C][/ROW]
[ROW][C]16[/C][C]-0.101788[/C][C]-1.115[/C][C]0.133532[/C][/ROW]
[ROW][C]17[/C][C]0.062872[/C][C]0.6887[/C][C]0.246163[/C][/ROW]
[ROW][C]18[/C][C]0.038416[/C][C]0.4208[/C][C]0.337316[/C][/ROW]
[ROW][C]19[/C][C]-0.041005[/C][C]-0.4492[/C][C]0.327054[/C][/ROW]
[ROW][C]20[/C][C]0.02651[/C][C]0.2904[/C][C]0.386003[/C][/ROW]
[ROW][C]21[/C][C]-0.026507[/C][C]-0.2904[/C][C]0.386017[/C][/ROW]
[ROW][C]22[/C][C]0.084727[/C][C]0.9281[/C][C]0.177601[/C][/ROW]
[ROW][C]23[/C][C]-0.085814[/C][C]-0.94[/C][C]0.17454[/C][/ROW]
[ROW][C]24[/C][C]-0.059736[/C][C]-0.6544[/C][C]0.257061[/C][/ROW]
[ROW][C]25[/C][C]-0.132117[/C][C]-1.4473[/C][C]0.075215[/C][/ROW]
[ROW][C]26[/C][C]0.009564[/C][C]0.1048[/C][C]0.458367[/C][/ROW]
[ROW][C]27[/C][C]0.006386[/C][C]0.07[/C][C]0.472174[/C][/ROW]
[ROW][C]28[/C][C]-0.014108[/C][C]-0.1545[/C][C]0.438721[/C][/ROW]
[ROW][C]29[/C][C]-0.004643[/C][C]-0.0509[/C][C]0.47976[/C][/ROW]
[ROW][C]30[/C][C]0.005719[/C][C]0.0626[/C][C]0.475076[/C][/ROW]
[ROW][C]31[/C][C]-0.091586[/C][C]-1.0033[/C][C]0.158874[/C][/ROW]
[ROW][C]32[/C][C]0.033591[/C][C]0.368[/C][C]0.356771[/C][/ROW]
[ROW][C]33[/C][C]-0.043549[/C][C]-0.4771[/C][C]0.317095[/C][/ROW]
[ROW][C]34[/C][C]0.058511[/C][C]0.641[/C][C]0.261385[/C][/ROW]
[ROW][C]35[/C][C]-0.071713[/C][C]-0.7856[/C][C]0.216831[/C][/ROW]
[ROW][C]36[/C][C]-0.075129[/C][C]-0.823[/C][C]0.20607[/C][/ROW]
[ROW][C]37[/C][C]0.014527[/C][C]0.1591[/C][C]0.436916[/C][/ROW]
[ROW][C]38[/C][C]0.007309[/C][C]0.0801[/C][C]0.46816[/C][/ROW]
[ROW][C]39[/C][C]-0.021755[/C][C]-0.2383[/C][C]0.406022[/C][/ROW]
[ROW][C]40[/C][C]0.017297[/C][C]0.1895[/C][C]0.425017[/C][/ROW]
[ROW][C]41[/C][C]0.014218[/C][C]0.1557[/C][C]0.438247[/C][/ROW]
[ROW][C]42[/C][C]0.003879[/C][C]0.0425[/C][C]0.483088[/C][/ROW]
[ROW][C]43[/C][C]-0.02902[/C][C]-0.3179[/C][C]0.375557[/C][/ROW]
[ROW][C]44[/C][C]-0.021908[/C][C]-0.24[/C][C]0.405372[/C][/ROW]
[ROW][C]45[/C][C]0.016656[/C][C]0.1825[/C][C]0.427764[/C][/ROW]
[ROW][C]46[/C][C]-0.028062[/C][C]-0.3074[/C][C]0.379534[/C][/ROW]
[ROW][C]47[/C][C]-0.067435[/C][C]-0.7387[/C][C]0.230761[/C][/ROW]
[ROW][C]48[/C][C]-0.046562[/C][C]-0.5101[/C][C]0.305474[/C][/ROW]
[/TABLE]
Source: https://freestatistics.org/blog/index.php?pk=307267&T=2

Globally Unique Identifier (entire table): ba.freestatistics.org/blog/index.php?pk=307267&T=2

As an alternative you can also use a QR Code:  

The GUIDs for individual cells are displayed in the table below:

Partial Autocorrelation Function
Time lag kPACF(k)T-STATP-value
10.94790310.38380
20.0664850.72830.233921
3-0.082604-0.90490.18367
40.1617561.77190.039471
5-0.095006-1.04070.150044
60.0752330.82410.205747
70.1033481.13210.129921
80.0490890.53770.295874
9-0.040338-0.44190.329684
100.0882590.96680.167786
110.1024121.12190.132079
120.1708631.87170.031841
13-0.617564-6.76510
140.1401171.53490.06372
150.0791090.86660.193946
16-0.101788-1.1150.133532
170.0628720.68870.246163
180.0384160.42080.337316
19-0.041005-0.44920.327054
200.026510.29040.386003
21-0.026507-0.29040.386017
220.0847270.92810.177601
23-0.085814-0.940.17454
24-0.059736-0.65440.257061
25-0.132117-1.44730.075215
260.0095640.10480.458367
270.0063860.070.472174
28-0.014108-0.15450.438721
29-0.004643-0.05090.47976
300.0057190.06260.475076
31-0.091586-1.00330.158874
320.0335910.3680.356771
33-0.043549-0.47710.317095
340.0585110.6410.261385
35-0.071713-0.78560.216831
36-0.075129-0.8230.20607
370.0145270.15910.436916
380.0073090.08010.46816
39-0.021755-0.23830.406022
400.0172970.18950.425017
410.0142180.15570.438247
420.0038790.04250.483088
43-0.02902-0.31790.375557
44-0.021908-0.240.405372
450.0166560.18250.427764
46-0.028062-0.30740.379534
47-0.067435-0.73870.230761
48-0.046562-0.51010.305474


Parameters (Session):
Parameters (R input):
par1 = 48 ; par2 = 1 ; par3 = 0 ; par4 = 0 ; par5 = 12 ; par6 = White Noise ; par7 = 0.95 ; par8 = ;
R code (references can be found in the software module):
if (par1 == 'Default') {
par1 = 10*log10(length(x))
} else {
par1 <- as.numeric(par1)
}
par2 <- as.numeric(par2)
par3 <- as.numeric(par3)
par4 <- as.numeric(par4)
par5 <- as.numeric(par5)
if (par6 == 'White Noise') par6 <- 'white' else par6 <- 'ma'
par7 <- as.numeric(par7)
if (par8 != '') par8 <- as.numeric(par8)
x <- na.omit(x)
ox <- x
if (par8 == '') {
if (par2 == 0) {
x <- log(x)
} else {
x <- (x ^ par2 - 1) / par2
}
} else {
x <- log(x,base=par8)
}
if (par3 > 0) x <- diff(x,lag=1,difference=par3)
if (par4 > 0) x <- diff(x,lag=par5,difference=par4)
bitmap(file='picts.png')
op <- par(mfrow=c(2,1))
plot(ox,type='l',main='Original Time Series',xlab='time',ylab='value')
if (par8=='') {
mytitle <- paste('Working Time Series (lambda=',par2,', d=',par3,', D=',par4,')',sep='')
mysub <- paste('(lambda=',par2,', d=',par3,', D=',par4,', CI=', par7, ', CI type=',par6,')',sep='')
} else {
mytitle <- paste('Working Time Series (base=',par8,', d=',par3,', D=',par4,')',sep='')
mysub <- paste('(base=',par8,', d=',par3,', D=',par4,', CI=', par7, ', CI type=',par6,')',sep='')
}
plot(x,type='l', main=mytitle,xlab='time',ylab='value')
par(op)
dev.off()
bitmap(file='pic1.png')
racf <- acf(x, par1, main='Autocorrelation', xlab='time lag', ylab='ACF', ci.type=par6, ci=par7, sub=mysub)
dev.off()
bitmap(file='pic2.png')
rpacf <- pacf(x,par1,main='Partial Autocorrelation',xlab='lags',ylab='PACF',sub=mysub)
dev.off()
(myacf <- c(racf$acf))
(mypacf <- c(rpacf$acf))
lengthx <- length(x)
sqrtn <- sqrt(lengthx)
load(file='createtable')
a<-table.start()
a<-table.row.start(a)
a<-table.element(a,'Autocorrelation Function',4,TRUE)
a<-table.row.end(a)
a<-table.row.start(a)
a<-table.element(a,'Time lag k',header=TRUE)
a<-table.element(a,'ACF(k)',header=TRUE)
a<-table.element(a,'T-STAT',header=TRUE)
a<-table.element(a,'P-value',header=TRUE)
a<-table.row.end(a)
for (i in 2:(par1+1)) {
a<-table.row.start(a)
a<-table.element(a,i-1,header=TRUE)
a<-table.element(a,round(myacf[i],6))
mytstat <- myacf[i]*sqrtn
a<-table.element(a,round(mytstat,4))
a<-table.element(a,round(1-pt(abs(mytstat),lengthx),6))
a<-table.row.end(a)
}
a<-table.end(a)
table.save(a,file='mytable.tab')
a<-table.start()
a<-table.row.start(a)
a<-table.element(a,'Partial Autocorrelation Function',4,TRUE)
a<-table.row.end(a)
a<-table.row.start(a)
a<-table.element(a,'Time lag k',header=TRUE)
a<-table.element(a,'PACF(k)',header=TRUE)
a<-table.element(a,'T-STAT',header=TRUE)
a<-table.element(a,'P-value',header=TRUE)
a<-table.row.end(a)
for (i in 1:par1) {
a<-table.row.start(a)
a<-table.element(a,i,header=TRUE)
a<-table.element(a,round(mypacf[i],6))
mytstat <- mypacf[i]*sqrtn
a<-table.element(a,round(mytstat,4))
a<-table.element(a,round(1-pt(abs(mytstat),lengthx),6))
a<-table.row.end(a)
}
a<-table.end(a)
table.save(a,file='mytable1.tab')