Free Statistics

of Irreproducible Research!

Author's title

Author*Unverified author*
R Software Modulerwasp_smp.wasp
Title produced by softwareStandard Deviation-Mean Plot
Date of computationThu, 10 Aug 2017 19:10:24 +0200
Cite this page as followsStatistical Computations at FreeStatistics.org, Office for Research Development and Education, URL https://freestatistics.org/blog/index.php?v=date/2017/Aug/10/t1502385035rt724eg7nws7um5.htm/, Retrieved Fri, 17 May 2024 10:42:46 +0000
Statistical Computations at FreeStatistics.org, Office for Research Development and Education, URL https://freestatistics.org/blog/index.php?pk=307104, Retrieved Fri, 17 May 2024 10:42:46 +0000
QR Codes:

Original text written by user:
IsPrivate?No (this computation is public)
User-defined keywords
Estimated Impact113
Family? (F = Feedback message, R = changed R code, M = changed R Module, P = changed Parameters, D = changed Data)
-       [Standard Deviation-Mean Plot] [] [2017-08-10 17:10:24] [c81f1da0e4fa2d83805175b5d75ced6f] [Current]
Feedback Forum

Post a new message
Dataseries X:
70200
67600
71500
57200
74100
72800
78000
80600
89700
78000
74100
92300
78000
58500
68900
52000
72800
59800
79300
71500
75400
84500
83200
98800
71500
59800
66300
48100
68900
53300
75400
71500
63700
91000
81900
93600
70200
65000
58500
48100
63700
57200
78000
75400
65000
87100
80600
104000
83200
50700
50700
50700
59800
59800
80600
74100
66300
83200
76700
110500
87100
50700
53300
44200
61100
70200
88400
87100
70200
81900
72800
104000
79300
63700
57200
42900
63700
76700
89700
84500
62400
89700
70200
107900
89700
65000
59800
40300
63700
61100
92300
92300
70200
91000
67600
105300
89700
66300
50700
35100
68900
66300
87100
100100
74100
83200
62400
107900


Summary of computational transaction
Raw Input view raw input (R code)
Raw Outputview raw output of R engine
Computing time1 seconds
R ServerBig Analytics Cloud Computing Center

\begin{tabular}{lllllllll}
\hline
Summary of computational transaction \tabularnewline
Raw Input view raw input (R code)  \tabularnewline
Raw Outputview raw output of R engine  \tabularnewline
Computing time1 seconds \tabularnewline
R ServerBig Analytics Cloud Computing Center \tabularnewline
\hline
\end{tabular}
%Source: https://freestatistics.org/blog/index.php?pk=307104&T=0

[TABLE]
[ROW]
Summary of computational transaction[/C][/ROW] [ROW]Raw Input[/C] view raw input (R code) [/C][/ROW] [ROW]Raw Output[/C]view raw output of R engine [/C][/ROW] [ROW]Computing time[/C]1 seconds[/C][/ROW] [ROW]R Server[/C]Big Analytics Cloud Computing Center[/C][/ROW] [/TABLE] Source: https://freestatistics.org/blog/index.php?pk=307104&T=0

Globally Unique Identifier (entire table): ba.freestatistics.org/blog/index.php?pk=307104&T=0

As an alternative you can also use a QR Code:  

The GUIDs for individual cells are displayed in the table below:

Summary of computational transaction
Raw Input view raw input (R code)
Raw Outputview raw output of R engine
Computing time1 seconds
R ServerBig Analytics Cloud Computing Center


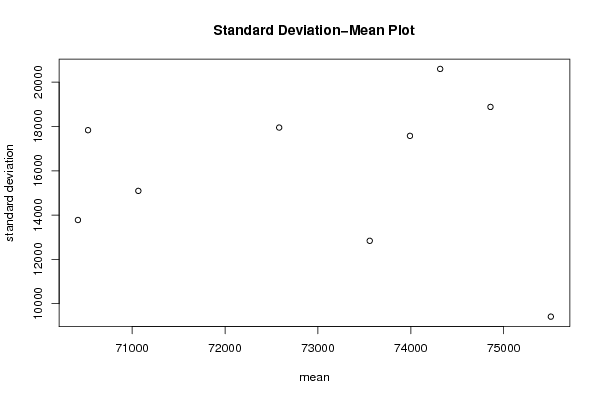
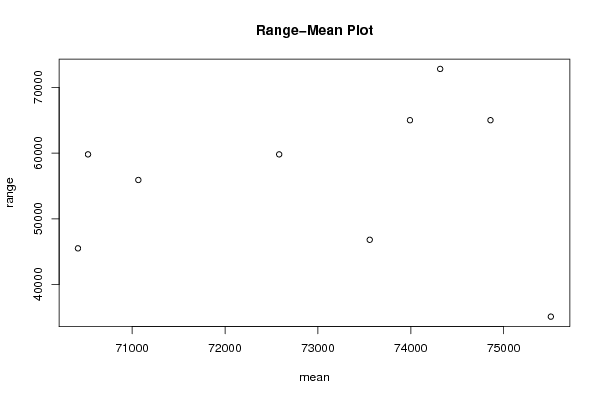
Standard Deviation-Mean Plot
SectionMeanStandard DeviationRange
175508.33333333339414.6364129412235100
273558.333333333312838.964722730446800
370416.666666666713778.3646828445500
471066.666666666715092.763668444455900
57052517834.396031774759800
672583.333333333317952.099564894359800
773991.666666666717576.971418376565000
874858.333333333318883.251758362465000
974316.666666666720598.359746407672800

\begin{tabular}{lllllllll}
\hline
Standard Deviation-Mean Plot \tabularnewline
Section & Mean & Standard Deviation & Range \tabularnewline
1 & 75508.3333333333 & 9414.63641294122 & 35100 \tabularnewline
2 & 73558.3333333333 & 12838.9647227304 & 46800 \tabularnewline
3 & 70416.6666666667 & 13778.36468284 & 45500 \tabularnewline
4 & 71066.6666666667 & 15092.7636684444 & 55900 \tabularnewline
5 & 70525 & 17834.3960317747 & 59800 \tabularnewline
6 & 72583.3333333333 & 17952.0995648943 & 59800 \tabularnewline
7 & 73991.6666666667 & 17576.9714183765 & 65000 \tabularnewline
8 & 74858.3333333333 & 18883.2517583624 & 65000 \tabularnewline
9 & 74316.6666666667 & 20598.3597464076 & 72800 \tabularnewline
\hline
\end{tabular}
%Source: https://freestatistics.org/blog/index.php?pk=307104&T=1

[TABLE]
[ROW][C]Standard Deviation-Mean Plot[/C][/ROW]
[ROW][C]Section[/C][C]Mean[/C][C]Standard Deviation[/C][C]Range[/C][/ROW]
[ROW][C]1[/C][C]75508.3333333333[/C][C]9414.63641294122[/C][C]35100[/C][/ROW]
[ROW][C]2[/C][C]73558.3333333333[/C][C]12838.9647227304[/C][C]46800[/C][/ROW]
[ROW][C]3[/C][C]70416.6666666667[/C][C]13778.36468284[/C][C]45500[/C][/ROW]
[ROW][C]4[/C][C]71066.6666666667[/C][C]15092.7636684444[/C][C]55900[/C][/ROW]
[ROW][C]5[/C][C]70525[/C][C]17834.3960317747[/C][C]59800[/C][/ROW]
[ROW][C]6[/C][C]72583.3333333333[/C][C]17952.0995648943[/C][C]59800[/C][/ROW]
[ROW][C]7[/C][C]73991.6666666667[/C][C]17576.9714183765[/C][C]65000[/C][/ROW]
[ROW][C]8[/C][C]74858.3333333333[/C][C]18883.2517583624[/C][C]65000[/C][/ROW]
[ROW][C]9[/C][C]74316.6666666667[/C][C]20598.3597464076[/C][C]72800[/C][/ROW]
[/TABLE]
Source: https://freestatistics.org/blog/index.php?pk=307104&T=1

Globally Unique Identifier (entire table): ba.freestatistics.org/blog/index.php?pk=307104&T=1

As an alternative you can also use a QR Code:  

The GUIDs for individual cells are displayed in the table below:

Standard Deviation-Mean Plot
SectionMeanStandard DeviationRange
175508.33333333339414.6364129412235100
273558.333333333312838.964722730446800
370416.666666666713778.3646828445500
471066.666666666715092.763668444455900
57052517834.396031774759800
672583.333333333317952.099564894359800
773991.666666666717576.971418376565000
874858.333333333318883.251758362465000
974316.666666666720598.359746407672800


Regression: S.E.(k) = alpha + beta * Mean(k)
alpha23838.2832066242
beta-0.107448317059865
S.D.0.68875700161761
T-STAT-0.156003230177715
p-value0.880434120508981

\begin{tabular}{lllllllll}
\hline
Regression: S.E.(k) = alpha + beta * Mean(k) \tabularnewline
alpha & 23838.2832066242 \tabularnewline
beta & -0.107448317059865 \tabularnewline
S.D. & 0.68875700161761 \tabularnewline
T-STAT & -0.156003230177715 \tabularnewline
p-value & 0.880434120508981 \tabularnewline
\hline
\end{tabular}
%Source: https://freestatistics.org/blog/index.php?pk=307104&T=2

[TABLE]
[ROW][C]Regression: S.E.(k) = alpha + beta * Mean(k)[/C][/ROW]
[ROW][C]alpha[/C][C]23838.2832066242[/C][/ROW]
[ROW][C]beta[/C][C]-0.107448317059865[/C][/ROW]
[ROW][C]S.D.[/C][C]0.68875700161761[/C][/ROW]
[ROW][C]T-STAT[/C][C]-0.156003230177715[/C][/ROW]
[ROW][C]p-value[/C][C]0.880434120508981[/C][/ROW]
[/TABLE]
Source: https://freestatistics.org/blog/index.php?pk=307104&T=2

Globally Unique Identifier (entire table): ba.freestatistics.org/blog/index.php?pk=307104&T=2

As an alternative you can also use a QR Code:  

The GUIDs for individual cells are displayed in the table below:

Regression: S.E.(k) = alpha + beta * Mean(k)
alpha23838.2832066242
beta-0.107448317059865
S.D.0.68875700161761
T-STAT-0.156003230177715
p-value0.880434120508981


Regression: ln S.E.(k) = alpha + beta * ln Mean(k)
alpha24.1715393522784
beta-1.2963355072811
S.D.3.45582772786274
T-STAT-0.375115778147546
p-value0.718681736243632
Lambda2.2963355072811

\begin{tabular}{lllllllll}
\hline
Regression: ln S.E.(k) = alpha + beta * ln Mean(k) \tabularnewline
alpha & 24.1715393522784 \tabularnewline
beta & -1.2963355072811 \tabularnewline
S.D. & 3.45582772786274 \tabularnewline
T-STAT & -0.375115778147546 \tabularnewline
p-value & 0.718681736243632 \tabularnewline
Lambda & 2.2963355072811 \tabularnewline
\hline
\end{tabular}
%Source: https://freestatistics.org/blog/index.php?pk=307104&T=3

[TABLE]
[ROW][C]Regression: ln S.E.(k) = alpha + beta * ln Mean(k)[/C][/ROW]
[ROW][C]alpha[/C][C]24.1715393522784[/C][/ROW]
[ROW][C]beta[/C][C]-1.2963355072811[/C][/ROW]
[ROW][C]S.D.[/C][C]3.45582772786274[/C][/ROW]
[ROW][C]T-STAT[/C][C]-0.375115778147546[/C][/ROW]
[ROW][C]p-value[/C][C]0.718681736243632[/C][/ROW]
[ROW][C]Lambda[/C][C]2.2963355072811[/C][/ROW]
[/TABLE]
Source: https://freestatistics.org/blog/index.php?pk=307104&T=3

Globally Unique Identifier (entire table): ba.freestatistics.org/blog/index.php?pk=307104&T=3

As an alternative you can also use a QR Code:  

The GUIDs for individual cells are displayed in the table below:

Regression: ln S.E.(k) = alpha + beta * ln Mean(k)
alpha24.1715393522784
beta-1.2963355072811
S.D.3.45582772786274
T-STAT-0.375115778147546
p-value0.718681736243632
Lambda2.2963355072811


Parameters (Session):
par1 = 121212 ;
Parameters (R input):
par1 = 12 ;
R code (references can be found in the software module):
par1 <- as.numeric(par1)
(n <- length(x))
(np <- floor(n / par1))
arr <- array(NA,dim=c(par1,np))
j <- 0
k <- 1
for (i in 1:(np*par1))
{
j = j + 1
arr[j,k] <- x[i]
if (j == par1) {
j = 0
k=k+1
}
}
arr
arr.mean <- array(NA,dim=np)
arr.sd <- array(NA,dim=np)
arr.range <- array(NA,dim=np)
for (j in 1:np)
{
arr.mean[j] <- mean(arr[,j],na.rm=TRUE)
arr.sd[j] <- sd(arr[,j],na.rm=TRUE)
arr.range[j] <- max(arr[,j],na.rm=TRUE) - min(arr[,j],na.rm=TRUE)
}
arr.mean
arr.sd
arr.range
(lm1 <- lm(arr.sd~arr.mean))
(lnlm1 <- lm(log(arr.sd)~log(arr.mean)))
(lm2 <- lm(arr.range~arr.mean))
bitmap(file='test1.png')
plot(arr.mean,arr.sd,main='Standard Deviation-Mean Plot',xlab='mean',ylab='standard deviation')
dev.off()
bitmap(file='test2.png')
plot(arr.mean,arr.range,main='Range-Mean Plot',xlab='mean',ylab='range')
dev.off()
load(file='createtable')
a<-table.start()
a<-table.row.start(a)
a<-table.element(a,'Standard Deviation-Mean Plot',4,TRUE)
a<-table.row.end(a)
a<-table.row.start(a)
a<-table.element(a,'Section',header=TRUE)
a<-table.element(a,'Mean',header=TRUE)
a<-table.element(a,'Standard Deviation',header=TRUE)
a<-table.element(a,'Range',header=TRUE)
a<-table.row.end(a)
for (j in 1:np) {
a<-table.row.start(a)
a<-table.element(a,j,header=TRUE)
a<-table.element(a,arr.mean[j])
a<-table.element(a,arr.sd[j] )
a<-table.element(a,arr.range[j] )
a<-table.row.end(a)
}
a<-table.end(a)
table.save(a,file='mytable.tab')
a<-table.start()
a<-table.row.start(a)
a<-table.element(a,'Regression: S.E.(k) = alpha + beta * Mean(k)',2,TRUE)
a<-table.row.end(a)
a<-table.row.start(a)
a<-table.element(a,'alpha',header=TRUE)
a<-table.element(a,lm1$coefficients[[1]])
a<-table.row.end(a)
a<-table.row.start(a)
a<-table.element(a,'beta',header=TRUE)
a<-table.element(a,lm1$coefficients[[2]])
a<-table.row.end(a)
a<-table.row.start(a)
a<-table.element(a,'S.D.',header=TRUE)
a<-table.element(a,summary(lm1)$coefficients[2,2])
a<-table.row.end(a)
a<-table.row.start(a)
a<-table.element(a,'T-STAT',header=TRUE)
a<-table.element(a,summary(lm1)$coefficients[2,3])
a<-table.row.end(a)
a<-table.row.start(a)
a<-table.element(a,'p-value',header=TRUE)
a<-table.element(a,summary(lm1)$coefficients[2,4])
a<-table.row.end(a)
a<-table.end(a)
table.save(a,file='mytable1.tab')
a<-table.start()
a<-table.row.start(a)
a<-table.element(a,'Regression: ln S.E.(k) = alpha + beta * ln Mean(k)',2,TRUE)
a<-table.row.end(a)
a<-table.row.start(a)
a<-table.element(a,'alpha',header=TRUE)
a<-table.element(a,lnlm1$coefficients[[1]])
a<-table.row.end(a)
a<-table.row.start(a)
a<-table.element(a,'beta',header=TRUE)
a<-table.element(a,lnlm1$coefficients[[2]])
a<-table.row.end(a)
a<-table.row.start(a)
a<-table.element(a,'S.D.',header=TRUE)
a<-table.element(a,summary(lnlm1)$coefficients[2,2])
a<-table.row.end(a)
a<-table.row.start(a)
a<-table.element(a,'T-STAT',header=TRUE)
a<-table.element(a,summary(lnlm1)$coefficients[2,3])
a<-table.row.end(a)
a<-table.row.start(a)
a<-table.element(a,'p-value',header=TRUE)
a<-table.element(a,summary(lnlm1)$coefficients[2,4])
a<-table.row.end(a)
a<-table.row.start(a)
a<-table.element(a,'Lambda',header=TRUE)
a<-table.element(a,1-lnlm1$coefficients[[2]])
a<-table.row.end(a)
a<-table.end(a)
table.save(a,file='mytable2.tab')