Free Statistics

of Irreproducible Research!

Author's title

Author*Unverified author*
R Software Modulerwasp_autocorrelation.wasp
Title produced by software(Partial) Autocorrelation Function
Date of computationTue, 26 May 2015 10:10:50 +0100
Cite this page as followsStatistical Computations at FreeStatistics.org, Office for Research Development and Education, URL https://freestatistics.org/blog/index.php?v=date/2015/May/26/t14326314839zk9urbfxjz8qiv.htm/, Retrieved Tue, 30 Apr 2024 17:05:03 +0000
Statistical Computations at FreeStatistics.org, Office for Research Development and Education, URL https://freestatistics.org/blog/index.php?pk=279380, Retrieved Tue, 30 Apr 2024 17:05:03 +0000
QR Codes:

Original text written by user:
IsPrivate?No (this computation is public)
User-defined keywords
Estimated Impact101
Family? (F = Feedback message, R = changed R code, M = changed R Module, P = changed Parameters, D = changed Data)
-       [(Partial) Autocorrelation Function] [] [2015-05-26 09:10:50] [a916b42d6b56a629542ed1ac6e46ec84] [Current]
Feedback Forum

Post a new message
Dataseries X:
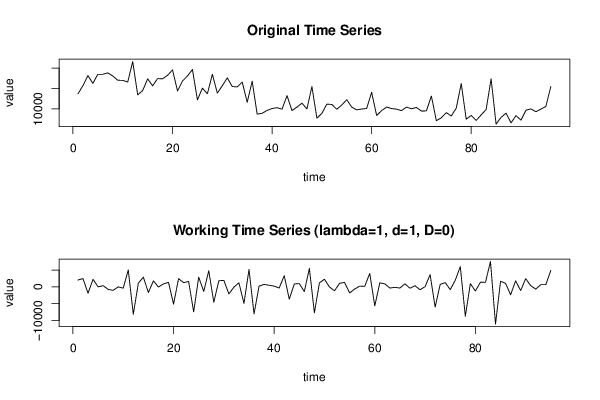
13671
15698
18150
16245
18479
18479
18819
18059
17004
16981
16578
21604
13419
14487
17349
15646
17419
17358
18221
19554
14386
16833
18067
19662
12192
15081
13698
18474
13871
15669
17597
15469
15374
16568
11619
16780
8700
8906
9612
10073
10275
9921
13237
9572
10425
11385
9970
15456
7708
8892
11145
11069
9893
10929
12240
10411
9747
9950
10079
14064
8368
9558
10432
10068
9915
9549
10433
10009
10327
9453
9494
13133
7082
7805
9064
8236
10182
16210
7451
8384
7143
8507
9833
17364
6260
7897
8933
6554
8333
7224
9659
9977
9289
9929
10576
15463


Summary of computational transaction
Raw Inputview raw input (R code)
Raw Outputview raw output of R engine
Computing time2 seconds
R Server'George Udny Yule' @ yule.wessa.net

\begin{tabular}{lllllllll}
\hline
Summary of computational transaction \tabularnewline
Raw Input & view raw input (R code)  \tabularnewline
Raw Output & view raw output of R engine  \tabularnewline
Computing time & 2 seconds \tabularnewline
R Server & 'George Udny Yule' @ yule.wessa.net \tabularnewline
\hline
\end{tabular}
%Source: https://freestatistics.org/blog/index.php?pk=279380&T=0

[TABLE]
[ROW][C]Summary of computational transaction[/C][/ROW]
[ROW][C]Raw Input[/C][C]view raw input (R code) [/C][/ROW]
[ROW][C]Raw Output[/C][C]view raw output of R engine [/C][/ROW]
[ROW][C]Computing time[/C][C]2 seconds[/C][/ROW]
[ROW][C]R Server[/C][C]'George Udny Yule' @ yule.wessa.net[/C][/ROW]
[/TABLE]
Source: https://freestatistics.org/blog/index.php?pk=279380&T=0

Globally Unique Identifier (entire table): ba.freestatistics.org/blog/index.php?pk=279380&T=0

As an alternative you can also use a QR Code:  

The GUIDs for individual cells are displayed in the table below:

Summary of computational transaction
Raw Inputview raw input (R code)
Raw Outputview raw output of R engine
Computing time2 seconds
R Server'George Udny Yule' @ yule.wessa.net


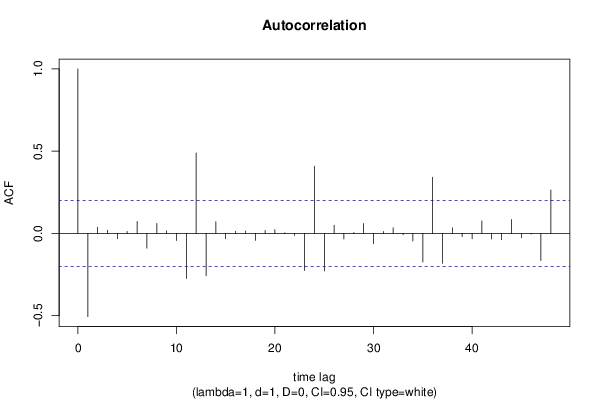
Autocorrelation Function
Time lag kACF(k)T-STATP-value
1-0.5063-4.93482e-06
20.0377270.36770.356952
30.0192760.18790.425684
4-0.033019-0.32180.374145
50.012120.11810.453108
60.0721920.70360.24169
7-0.08973-0.87460.192004
80.0600760.58550.279784
90.0155350.15140.439983
10-0.043142-0.42050.337535
11-0.274038-2.6710.004449
120.4892464.76863e-06
13-0.257729-2.5120.006845
140.0709720.69170.245392
15-0.033128-0.32290.373743
160.0133160.12980.448504
170.0142710.13910.444836
18-0.04275-0.41670.338927
190.0178990.17450.430939
200.0224740.2190.413542
210.004410.0430.482904
22-0.013067-0.12740.44946
23-0.225619-2.19910.01515
240.4079893.97666.8e-05
25-0.227903-2.22130.014352
260.0498530.48590.314075
27-0.034461-0.33590.368849
280.0046250.04510.482071
290.060480.58950.278467
30-0.062878-0.61290.270717
310.0117880.11490.454386
320.0342620.33390.36958
33-0.007529-0.07340.470829
34-0.046645-0.45460.325204
35-0.17416-1.69750.046438
360.3413393.3270.000625
37-0.182393-1.77780.039322
380.0335330.32680.372253
39-0.019867-0.19360.423437
40-0.032805-0.31970.374931
410.0756440.73730.231383
42-0.034405-0.33530.369054
43-0.037784-0.36830.356746
440.0840870.81960.207253
45-0.027037-0.26350.396357
46-0.003941-0.03840.484718
47-0.165278-1.61090.055257
480.2643932.5770.005753

\begin{tabular}{lllllllll}
\hline
Autocorrelation Function \tabularnewline
Time lag k & ACF(k) & T-STAT & P-value \tabularnewline
1 & -0.5063 & -4.9348 & 2e-06 \tabularnewline
2 & 0.037727 & 0.3677 & 0.356952 \tabularnewline
3 & 0.019276 & 0.1879 & 0.425684 \tabularnewline
4 & -0.033019 & -0.3218 & 0.374145 \tabularnewline
5 & 0.01212 & 0.1181 & 0.453108 \tabularnewline
6 & 0.072192 & 0.7036 & 0.24169 \tabularnewline
7 & -0.08973 & -0.8746 & 0.192004 \tabularnewline
8 & 0.060076 & 0.5855 & 0.279784 \tabularnewline
9 & 0.015535 & 0.1514 & 0.439983 \tabularnewline
10 & -0.043142 & -0.4205 & 0.337535 \tabularnewline
11 & -0.274038 & -2.671 & 0.004449 \tabularnewline
12 & 0.489246 & 4.7686 & 3e-06 \tabularnewline
13 & -0.257729 & -2.512 & 0.006845 \tabularnewline
14 & 0.070972 & 0.6917 & 0.245392 \tabularnewline
15 & -0.033128 & -0.3229 & 0.373743 \tabularnewline
16 & 0.013316 & 0.1298 & 0.448504 \tabularnewline
17 & 0.014271 & 0.1391 & 0.444836 \tabularnewline
18 & -0.04275 & -0.4167 & 0.338927 \tabularnewline
19 & 0.017899 & 0.1745 & 0.430939 \tabularnewline
20 & 0.022474 & 0.219 & 0.413542 \tabularnewline
21 & 0.00441 & 0.043 & 0.482904 \tabularnewline
22 & -0.013067 & -0.1274 & 0.44946 \tabularnewline
23 & -0.225619 & -2.1991 & 0.01515 \tabularnewline
24 & 0.407989 & 3.9766 & 6.8e-05 \tabularnewline
25 & -0.227903 & -2.2213 & 0.014352 \tabularnewline
26 & 0.049853 & 0.4859 & 0.314075 \tabularnewline
27 & -0.034461 & -0.3359 & 0.368849 \tabularnewline
28 & 0.004625 & 0.0451 & 0.482071 \tabularnewline
29 & 0.06048 & 0.5895 & 0.278467 \tabularnewline
30 & -0.062878 & -0.6129 & 0.270717 \tabularnewline
31 & 0.011788 & 0.1149 & 0.454386 \tabularnewline
32 & 0.034262 & 0.3339 & 0.36958 \tabularnewline
33 & -0.007529 & -0.0734 & 0.470829 \tabularnewline
34 & -0.046645 & -0.4546 & 0.325204 \tabularnewline
35 & -0.17416 & -1.6975 & 0.046438 \tabularnewline
36 & 0.341339 & 3.327 & 0.000625 \tabularnewline
37 & -0.182393 & -1.7778 & 0.039322 \tabularnewline
38 & 0.033533 & 0.3268 & 0.372253 \tabularnewline
39 & -0.019867 & -0.1936 & 0.423437 \tabularnewline
40 & -0.032805 & -0.3197 & 0.374931 \tabularnewline
41 & 0.075644 & 0.7373 & 0.231383 \tabularnewline
42 & -0.034405 & -0.3353 & 0.369054 \tabularnewline
43 & -0.037784 & -0.3683 & 0.356746 \tabularnewline
44 & 0.084087 & 0.8196 & 0.207253 \tabularnewline
45 & -0.027037 & -0.2635 & 0.396357 \tabularnewline
46 & -0.003941 & -0.0384 & 0.484718 \tabularnewline
47 & -0.165278 & -1.6109 & 0.055257 \tabularnewline
48 & 0.264393 & 2.577 & 0.005753 \tabularnewline
\hline
\end{tabular}
%Source: https://freestatistics.org/blog/index.php?pk=279380&T=1

[TABLE]
[ROW][C]Autocorrelation Function[/C][/ROW]
[ROW][C]Time lag k[/C][C]ACF(k)[/C][C]T-STAT[/C][C]P-value[/C][/ROW]
[ROW][C]1[/C][C]-0.5063[/C][C]-4.9348[/C][C]2e-06[/C][/ROW]
[ROW][C]2[/C][C]0.037727[/C][C]0.3677[/C][C]0.356952[/C][/ROW]
[ROW][C]3[/C][C]0.019276[/C][C]0.1879[/C][C]0.425684[/C][/ROW]
[ROW][C]4[/C][C]-0.033019[/C][C]-0.3218[/C][C]0.374145[/C][/ROW]
[ROW][C]5[/C][C]0.01212[/C][C]0.1181[/C][C]0.453108[/C][/ROW]
[ROW][C]6[/C][C]0.072192[/C][C]0.7036[/C][C]0.24169[/C][/ROW]
[ROW][C]7[/C][C]-0.08973[/C][C]-0.8746[/C][C]0.192004[/C][/ROW]
[ROW][C]8[/C][C]0.060076[/C][C]0.5855[/C][C]0.279784[/C][/ROW]
[ROW][C]9[/C][C]0.015535[/C][C]0.1514[/C][C]0.439983[/C][/ROW]
[ROW][C]10[/C][C]-0.043142[/C][C]-0.4205[/C][C]0.337535[/C][/ROW]
[ROW][C]11[/C][C]-0.274038[/C][C]-2.671[/C][C]0.004449[/C][/ROW]
[ROW][C]12[/C][C]0.489246[/C][C]4.7686[/C][C]3e-06[/C][/ROW]
[ROW][C]13[/C][C]-0.257729[/C][C]-2.512[/C][C]0.006845[/C][/ROW]
[ROW][C]14[/C][C]0.070972[/C][C]0.6917[/C][C]0.245392[/C][/ROW]
[ROW][C]15[/C][C]-0.033128[/C][C]-0.3229[/C][C]0.373743[/C][/ROW]
[ROW][C]16[/C][C]0.013316[/C][C]0.1298[/C][C]0.448504[/C][/ROW]
[ROW][C]17[/C][C]0.014271[/C][C]0.1391[/C][C]0.444836[/C][/ROW]
[ROW][C]18[/C][C]-0.04275[/C][C]-0.4167[/C][C]0.338927[/C][/ROW]
[ROW][C]19[/C][C]0.017899[/C][C]0.1745[/C][C]0.430939[/C][/ROW]
[ROW][C]20[/C][C]0.022474[/C][C]0.219[/C][C]0.413542[/C][/ROW]
[ROW][C]21[/C][C]0.00441[/C][C]0.043[/C][C]0.482904[/C][/ROW]
[ROW][C]22[/C][C]-0.013067[/C][C]-0.1274[/C][C]0.44946[/C][/ROW]
[ROW][C]23[/C][C]-0.225619[/C][C]-2.1991[/C][C]0.01515[/C][/ROW]
[ROW][C]24[/C][C]0.407989[/C][C]3.9766[/C][C]6.8e-05[/C][/ROW]
[ROW][C]25[/C][C]-0.227903[/C][C]-2.2213[/C][C]0.014352[/C][/ROW]
[ROW][C]26[/C][C]0.049853[/C][C]0.4859[/C][C]0.314075[/C][/ROW]
[ROW][C]27[/C][C]-0.034461[/C][C]-0.3359[/C][C]0.368849[/C][/ROW]
[ROW][C]28[/C][C]0.004625[/C][C]0.0451[/C][C]0.482071[/C][/ROW]
[ROW][C]29[/C][C]0.06048[/C][C]0.5895[/C][C]0.278467[/C][/ROW]
[ROW][C]30[/C][C]-0.062878[/C][C]-0.6129[/C][C]0.270717[/C][/ROW]
[ROW][C]31[/C][C]0.011788[/C][C]0.1149[/C][C]0.454386[/C][/ROW]
[ROW][C]32[/C][C]0.034262[/C][C]0.3339[/C][C]0.36958[/C][/ROW]
[ROW][C]33[/C][C]-0.007529[/C][C]-0.0734[/C][C]0.470829[/C][/ROW]
[ROW][C]34[/C][C]-0.046645[/C][C]-0.4546[/C][C]0.325204[/C][/ROW]
[ROW][C]35[/C][C]-0.17416[/C][C]-1.6975[/C][C]0.046438[/C][/ROW]
[ROW][C]36[/C][C]0.341339[/C][C]3.327[/C][C]0.000625[/C][/ROW]
[ROW][C]37[/C][C]-0.182393[/C][C]-1.7778[/C][C]0.039322[/C][/ROW]
[ROW][C]38[/C][C]0.033533[/C][C]0.3268[/C][C]0.372253[/C][/ROW]
[ROW][C]39[/C][C]-0.019867[/C][C]-0.1936[/C][C]0.423437[/C][/ROW]
[ROW][C]40[/C][C]-0.032805[/C][C]-0.3197[/C][C]0.374931[/C][/ROW]
[ROW][C]41[/C][C]0.075644[/C][C]0.7373[/C][C]0.231383[/C][/ROW]
[ROW][C]42[/C][C]-0.034405[/C][C]-0.3353[/C][C]0.369054[/C][/ROW]
[ROW][C]43[/C][C]-0.037784[/C][C]-0.3683[/C][C]0.356746[/C][/ROW]
[ROW][C]44[/C][C]0.084087[/C][C]0.8196[/C][C]0.207253[/C][/ROW]
[ROW][C]45[/C][C]-0.027037[/C][C]-0.2635[/C][C]0.396357[/C][/ROW]
[ROW][C]46[/C][C]-0.003941[/C][C]-0.0384[/C][C]0.484718[/C][/ROW]
[ROW][C]47[/C][C]-0.165278[/C][C]-1.6109[/C][C]0.055257[/C][/ROW]
[ROW][C]48[/C][C]0.264393[/C][C]2.577[/C][C]0.005753[/C][/ROW]
[/TABLE]
Source: https://freestatistics.org/blog/index.php?pk=279380&T=1

Globally Unique Identifier (entire table): ba.freestatistics.org/blog/index.php?pk=279380&T=1

As an alternative you can also use a QR Code:  

The GUIDs for individual cells are displayed in the table below:

Autocorrelation Function
Time lag kACF(k)T-STATP-value
1-0.5063-4.93482e-06
20.0377270.36770.356952
30.0192760.18790.425684
4-0.033019-0.32180.374145
50.012120.11810.453108
60.0721920.70360.24169
7-0.08973-0.87460.192004
80.0600760.58550.279784
90.0155350.15140.439983
10-0.043142-0.42050.337535
11-0.274038-2.6710.004449
120.4892464.76863e-06
13-0.257729-2.5120.006845
140.0709720.69170.245392
15-0.033128-0.32290.373743
160.0133160.12980.448504
170.0142710.13910.444836
18-0.04275-0.41670.338927
190.0178990.17450.430939
200.0224740.2190.413542
210.004410.0430.482904
22-0.013067-0.12740.44946
23-0.225619-2.19910.01515
240.4079893.97666.8e-05
25-0.227903-2.22130.014352
260.0498530.48590.314075
27-0.034461-0.33590.368849
280.0046250.04510.482071
290.060480.58950.278467
30-0.062878-0.61290.270717
310.0117880.11490.454386
320.0342620.33390.36958
33-0.007529-0.07340.470829
34-0.046645-0.45460.325204
35-0.17416-1.69750.046438
360.3413393.3270.000625
37-0.182393-1.77780.039322
380.0335330.32680.372253
39-0.019867-0.19360.423437
40-0.032805-0.31970.374931
410.0756440.73730.231383
42-0.034405-0.33530.369054
43-0.037784-0.36830.356746
440.0840870.81960.207253
45-0.027037-0.26350.396357
46-0.003941-0.03840.484718
47-0.165278-1.61090.055257
480.2643932.5770.005753


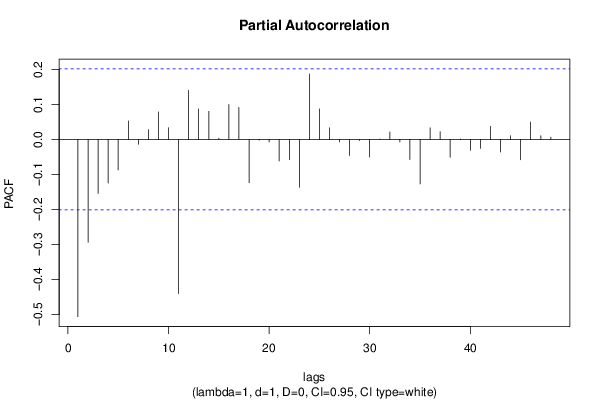
Partial Autocorrelation Function
Time lag kPACF(k)T-STATP-value
1-0.5063-4.93482e-06
2-0.29397-2.86530.002565
3-0.15432-1.50410.067933
4-0.124761-1.2160.113495
5-0.087499-0.85280.197948
60.0522730.50950.305793
7-0.014074-0.13720.44559
80.0279110.2720.39309
90.0782380.76260.223805
100.0332860.32440.373161
11-0.440402-4.29252.1e-05
120.1394041.35870.088722
130.0867510.84550.199966
140.0799870.77960.218777
150.0031990.03120.487598
160.0992630.96750.167876
170.0912560.88950.188003
18-0.123722-1.20590.115427
19-0.002275-0.02220.491177
20-0.007176-0.06990.472191
21-0.061694-0.60130.274531
22-0.057834-0.56370.287146
23-0.136888-1.33420.092661
240.1867471.82020.03594
250.0870010.8480.199289
260.0329010.32070.374579
27-0.007289-0.0710.471755
28-0.046161-0.44990.326895
29-0.003371-0.03290.486928
30-0.050388-0.49110.312235
310.0011820.01150.495415
320.0210380.20510.418986
33-0.00739-0.0720.471365
34-0.057502-0.56050.288242
35-0.127086-1.23870.109258
360.0328540.32020.374752
370.0219180.21360.415648
38-0.051059-0.49770.309937
390.0010920.01060.495764
40-0.03131-0.30520.380453
41-0.025824-0.25170.400907
420.0370070.36070.359562
43-0.03634-0.35420.361989
440.0102080.09950.460478
45-0.058162-0.56690.286061
460.0491720.47930.316424
470.0102610.10.460273
480.0063240.06160.475491

\begin{tabular}{lllllllll}
\hline
Partial Autocorrelation Function \tabularnewline
Time lag k & PACF(k) & T-STAT & P-value \tabularnewline
1 & -0.5063 & -4.9348 & 2e-06 \tabularnewline
2 & -0.29397 & -2.8653 & 0.002565 \tabularnewline
3 & -0.15432 & -1.5041 & 0.067933 \tabularnewline
4 & -0.124761 & -1.216 & 0.113495 \tabularnewline
5 & -0.087499 & -0.8528 & 0.197948 \tabularnewline
6 & 0.052273 & 0.5095 & 0.305793 \tabularnewline
7 & -0.014074 & -0.1372 & 0.44559 \tabularnewline
8 & 0.027911 & 0.272 & 0.39309 \tabularnewline
9 & 0.078238 & 0.7626 & 0.223805 \tabularnewline
10 & 0.033286 & 0.3244 & 0.373161 \tabularnewline
11 & -0.440402 & -4.2925 & 2.1e-05 \tabularnewline
12 & 0.139404 & 1.3587 & 0.088722 \tabularnewline
13 & 0.086751 & 0.8455 & 0.199966 \tabularnewline
14 & 0.079987 & 0.7796 & 0.218777 \tabularnewline
15 & 0.003199 & 0.0312 & 0.487598 \tabularnewline
16 & 0.099263 & 0.9675 & 0.167876 \tabularnewline
17 & 0.091256 & 0.8895 & 0.188003 \tabularnewline
18 & -0.123722 & -1.2059 & 0.115427 \tabularnewline
19 & -0.002275 & -0.0222 & 0.491177 \tabularnewline
20 & -0.007176 & -0.0699 & 0.472191 \tabularnewline
21 & -0.061694 & -0.6013 & 0.274531 \tabularnewline
22 & -0.057834 & -0.5637 & 0.287146 \tabularnewline
23 & -0.136888 & -1.3342 & 0.092661 \tabularnewline
24 & 0.186747 & 1.8202 & 0.03594 \tabularnewline
25 & 0.087001 & 0.848 & 0.199289 \tabularnewline
26 & 0.032901 & 0.3207 & 0.374579 \tabularnewline
27 & -0.007289 & -0.071 & 0.471755 \tabularnewline
28 & -0.046161 & -0.4499 & 0.326895 \tabularnewline
29 & -0.003371 & -0.0329 & 0.486928 \tabularnewline
30 & -0.050388 & -0.4911 & 0.312235 \tabularnewline
31 & 0.001182 & 0.0115 & 0.495415 \tabularnewline
32 & 0.021038 & 0.2051 & 0.418986 \tabularnewline
33 & -0.00739 & -0.072 & 0.471365 \tabularnewline
34 & -0.057502 & -0.5605 & 0.288242 \tabularnewline
35 & -0.127086 & -1.2387 & 0.109258 \tabularnewline
36 & 0.032854 & 0.3202 & 0.374752 \tabularnewline
37 & 0.021918 & 0.2136 & 0.415648 \tabularnewline
38 & -0.051059 & -0.4977 & 0.309937 \tabularnewline
39 & 0.001092 & 0.0106 & 0.495764 \tabularnewline
40 & -0.03131 & -0.3052 & 0.380453 \tabularnewline
41 & -0.025824 & -0.2517 & 0.400907 \tabularnewline
42 & 0.037007 & 0.3607 & 0.359562 \tabularnewline
43 & -0.03634 & -0.3542 & 0.361989 \tabularnewline
44 & 0.010208 & 0.0995 & 0.460478 \tabularnewline
45 & -0.058162 & -0.5669 & 0.286061 \tabularnewline
46 & 0.049172 & 0.4793 & 0.316424 \tabularnewline
47 & 0.010261 & 0.1 & 0.460273 \tabularnewline
48 & 0.006324 & 0.0616 & 0.475491 \tabularnewline
\hline
\end{tabular}
%Source: https://freestatistics.org/blog/index.php?pk=279380&T=2

[TABLE]
[ROW][C]Partial Autocorrelation Function[/C][/ROW]
[ROW][C]Time lag k[/C][C]PACF(k)[/C][C]T-STAT[/C][C]P-value[/C][/ROW]
[ROW][C]1[/C][C]-0.5063[/C][C]-4.9348[/C][C]2e-06[/C][/ROW]
[ROW][C]2[/C][C]-0.29397[/C][C]-2.8653[/C][C]0.002565[/C][/ROW]
[ROW][C]3[/C][C]-0.15432[/C][C]-1.5041[/C][C]0.067933[/C][/ROW]
[ROW][C]4[/C][C]-0.124761[/C][C]-1.216[/C][C]0.113495[/C][/ROW]
[ROW][C]5[/C][C]-0.087499[/C][C]-0.8528[/C][C]0.197948[/C][/ROW]
[ROW][C]6[/C][C]0.052273[/C][C]0.5095[/C][C]0.305793[/C][/ROW]
[ROW][C]7[/C][C]-0.014074[/C][C]-0.1372[/C][C]0.44559[/C][/ROW]
[ROW][C]8[/C][C]0.027911[/C][C]0.272[/C][C]0.39309[/C][/ROW]
[ROW][C]9[/C][C]0.078238[/C][C]0.7626[/C][C]0.223805[/C][/ROW]
[ROW][C]10[/C][C]0.033286[/C][C]0.3244[/C][C]0.373161[/C][/ROW]
[ROW][C]11[/C][C]-0.440402[/C][C]-4.2925[/C][C]2.1e-05[/C][/ROW]
[ROW][C]12[/C][C]0.139404[/C][C]1.3587[/C][C]0.088722[/C][/ROW]
[ROW][C]13[/C][C]0.086751[/C][C]0.8455[/C][C]0.199966[/C][/ROW]
[ROW][C]14[/C][C]0.079987[/C][C]0.7796[/C][C]0.218777[/C][/ROW]
[ROW][C]15[/C][C]0.003199[/C][C]0.0312[/C][C]0.487598[/C][/ROW]
[ROW][C]16[/C][C]0.099263[/C][C]0.9675[/C][C]0.167876[/C][/ROW]
[ROW][C]17[/C][C]0.091256[/C][C]0.8895[/C][C]0.188003[/C][/ROW]
[ROW][C]18[/C][C]-0.123722[/C][C]-1.2059[/C][C]0.115427[/C][/ROW]
[ROW][C]19[/C][C]-0.002275[/C][C]-0.0222[/C][C]0.491177[/C][/ROW]
[ROW][C]20[/C][C]-0.007176[/C][C]-0.0699[/C][C]0.472191[/C][/ROW]
[ROW][C]21[/C][C]-0.061694[/C][C]-0.6013[/C][C]0.274531[/C][/ROW]
[ROW][C]22[/C][C]-0.057834[/C][C]-0.5637[/C][C]0.287146[/C][/ROW]
[ROW][C]23[/C][C]-0.136888[/C][C]-1.3342[/C][C]0.092661[/C][/ROW]
[ROW][C]24[/C][C]0.186747[/C][C]1.8202[/C][C]0.03594[/C][/ROW]
[ROW][C]25[/C][C]0.087001[/C][C]0.848[/C][C]0.199289[/C][/ROW]
[ROW][C]26[/C][C]0.032901[/C][C]0.3207[/C][C]0.374579[/C][/ROW]
[ROW][C]27[/C][C]-0.007289[/C][C]-0.071[/C][C]0.471755[/C][/ROW]
[ROW][C]28[/C][C]-0.046161[/C][C]-0.4499[/C][C]0.326895[/C][/ROW]
[ROW][C]29[/C][C]-0.003371[/C][C]-0.0329[/C][C]0.486928[/C][/ROW]
[ROW][C]30[/C][C]-0.050388[/C][C]-0.4911[/C][C]0.312235[/C][/ROW]
[ROW][C]31[/C][C]0.001182[/C][C]0.0115[/C][C]0.495415[/C][/ROW]
[ROW][C]32[/C][C]0.021038[/C][C]0.2051[/C][C]0.418986[/C][/ROW]
[ROW][C]33[/C][C]-0.00739[/C][C]-0.072[/C][C]0.471365[/C][/ROW]
[ROW][C]34[/C][C]-0.057502[/C][C]-0.5605[/C][C]0.288242[/C][/ROW]
[ROW][C]35[/C][C]-0.127086[/C][C]-1.2387[/C][C]0.109258[/C][/ROW]
[ROW][C]36[/C][C]0.032854[/C][C]0.3202[/C][C]0.374752[/C][/ROW]
[ROW][C]37[/C][C]0.021918[/C][C]0.2136[/C][C]0.415648[/C][/ROW]
[ROW][C]38[/C][C]-0.051059[/C][C]-0.4977[/C][C]0.309937[/C][/ROW]
[ROW][C]39[/C][C]0.001092[/C][C]0.0106[/C][C]0.495764[/C][/ROW]
[ROW][C]40[/C][C]-0.03131[/C][C]-0.3052[/C][C]0.380453[/C][/ROW]
[ROW][C]41[/C][C]-0.025824[/C][C]-0.2517[/C][C]0.400907[/C][/ROW]
[ROW][C]42[/C][C]0.037007[/C][C]0.3607[/C][C]0.359562[/C][/ROW]
[ROW][C]43[/C][C]-0.03634[/C][C]-0.3542[/C][C]0.361989[/C][/ROW]
[ROW][C]44[/C][C]0.010208[/C][C]0.0995[/C][C]0.460478[/C][/ROW]
[ROW][C]45[/C][C]-0.058162[/C][C]-0.5669[/C][C]0.286061[/C][/ROW]
[ROW][C]46[/C][C]0.049172[/C][C]0.4793[/C][C]0.316424[/C][/ROW]
[ROW][C]47[/C][C]0.010261[/C][C]0.1[/C][C]0.460273[/C][/ROW]
[ROW][C]48[/C][C]0.006324[/C][C]0.0616[/C][C]0.475491[/C][/ROW]
[/TABLE]
Source: https://freestatistics.org/blog/index.php?pk=279380&T=2

Globally Unique Identifier (entire table): ba.freestatistics.org/blog/index.php?pk=279380&T=2

As an alternative you can also use a QR Code:  

The GUIDs for individual cells are displayed in the table below:

Partial Autocorrelation Function
Time lag kPACF(k)T-STATP-value
1-0.5063-4.93482e-06
2-0.29397-2.86530.002565
3-0.15432-1.50410.067933
4-0.124761-1.2160.113495
5-0.087499-0.85280.197948
60.0522730.50950.305793
7-0.014074-0.13720.44559
80.0279110.2720.39309
90.0782380.76260.223805
100.0332860.32440.373161
11-0.440402-4.29252.1e-05
120.1394041.35870.088722
130.0867510.84550.199966
140.0799870.77960.218777
150.0031990.03120.487598
160.0992630.96750.167876
170.0912560.88950.188003
18-0.123722-1.20590.115427
19-0.002275-0.02220.491177
20-0.007176-0.06990.472191
21-0.061694-0.60130.274531
22-0.057834-0.56370.287146
23-0.136888-1.33420.092661
240.1867471.82020.03594
250.0870010.8480.199289
260.0329010.32070.374579
27-0.007289-0.0710.471755
28-0.046161-0.44990.326895
29-0.003371-0.03290.486928
30-0.050388-0.49110.312235
310.0011820.01150.495415
320.0210380.20510.418986
33-0.00739-0.0720.471365
34-0.057502-0.56050.288242
35-0.127086-1.23870.109258
360.0328540.32020.374752
370.0219180.21360.415648
38-0.051059-0.49770.309937
390.0010920.01060.495764
40-0.03131-0.30520.380453
41-0.025824-0.25170.400907
420.0370070.36070.359562
43-0.03634-0.35420.361989
440.0102080.09950.460478
45-0.058162-0.56690.286061
460.0491720.47930.316424
470.0102610.10.460273
480.0063240.06160.475491


Parameters (Session):
par1 = 48 ; par2 = 1 ; par3 = 1 ; par4 = 0 ; par5 = 12 ; par6 = White Noise ; par7 = 0.95 ;
Parameters (R input):
par1 = 48 ; par2 = 1 ; par3 = 1 ; par4 = 0 ; par5 = 12 ; par6 = White Noise ; par7 = 0.95 ; par8 = ;
R code (references can be found in the software module):
par8 <- ''
par7 <- '0.95'
par6 <- 'White Noise'
par5 <- '12'
par4 <- '0'
par3 <- '1'
par2 <- '1'
par1 <- '48'
if (par1 == 'Default') {
par1 = 10*log10(length(x))
} else {
par1 <- as.numeric(par1)
}
par2 <- as.numeric(par2)
par3 <- as.numeric(par3)
par4 <- as.numeric(par4)
par5 <- as.numeric(par5)
if (par6 == 'White Noise') par6 <- 'white' else par6 <- 'ma'
par7 <- as.numeric(par7)
if (par8 != '') par8 <- as.numeric(par8)
ox <- x
if (par8 == '') {
if (par2 == 0) {
x <- log(x)
} else {
x <- (x ^ par2 - 1) / par2
}
} else {
x <- log(x,base=par8)
}
if (par3 > 0) x <- diff(x,lag=1,difference=par3)
if (par4 > 0) x <- diff(x,lag=par5,difference=par4)
bitmap(file='picts.png')
op <- par(mfrow=c(2,1))
plot(ox,type='l',main='Original Time Series',xlab='time',ylab='value')
if (par8=='') {
mytitle <- paste('Working Time Series (lambda=',par2,', d=',par3,', D=',par4,')',sep='')
mysub <- paste('(lambda=',par2,', d=',par3,', D=',par4,', CI=', par7, ', CI type=',par6,')',sep='')
} else {
mytitle <- paste('Working Time Series (base=',par8,', d=',par3,', D=',par4,')',sep='')
mysub <- paste('(base=',par8,', d=',par3,', D=',par4,', CI=', par7, ', CI type=',par6,')',sep='')
}
plot(x,type='l', main=mytitle,xlab='time',ylab='value')
par(op)
dev.off()
bitmap(file='pic1.png')
racf <- acf(x, par1, main='Autocorrelation', xlab='time lag', ylab='ACF', ci.type=par6, ci=par7, sub=mysub)
dev.off()
bitmap(file='pic2.png')
rpacf <- pacf(x,par1,main='Partial Autocorrelation',xlab='lags',ylab='PACF',sub=mysub)
dev.off()
(myacf <- c(racf$acf))
(mypacf <- c(rpacf$acf))
lengthx <- length(x)
sqrtn <- sqrt(lengthx)
load(file='createtable')
a<-table.start()
a<-table.row.start(a)
a<-table.element(a,'Autocorrelation Function',4,TRUE)
a<-table.row.end(a)
a<-table.row.start(a)
a<-table.element(a,'Time lag k',header=TRUE)
a<-table.element(a,hyperlink('basics.htm','ACF(k)','click here for more information about the Autocorrelation Function'),header=TRUE)
a<-table.element(a,'T-STAT',header=TRUE)
a<-table.element(a,'P-value',header=TRUE)
a<-table.row.end(a)
for (i in 2:(par1+1)) {
a<-table.row.start(a)
a<-table.element(a,i-1,header=TRUE)
a<-table.element(a,round(myacf[i],6))
mytstat <- myacf[i]*sqrtn
a<-table.element(a,round(mytstat,4))
a<-table.element(a,round(1-pt(abs(mytstat),lengthx),6))
a<-table.row.end(a)
}
a<-table.end(a)
table.save(a,file='mytable.tab')
a<-table.start()
a<-table.row.start(a)
a<-table.element(a,'Partial Autocorrelation Function',4,TRUE)
a<-table.row.end(a)
a<-table.row.start(a)
a<-table.element(a,'Time lag k',header=TRUE)
a<-table.element(a,hyperlink('basics.htm','PACF(k)','click here for more information about the Partial Autocorrelation Function'),header=TRUE)
a<-table.element(a,'T-STAT',header=TRUE)
a<-table.element(a,'P-value',header=TRUE)
a<-table.row.end(a)
for (i in 1:par1) {
a<-table.row.start(a)
a<-table.element(a,i,header=TRUE)
a<-table.element(a,round(mypacf[i],6))
mytstat <- mypacf[i]*sqrtn
a<-table.element(a,round(mytstat,4))
a<-table.element(a,round(1-pt(abs(mytstat),lengthx),6))
a<-table.row.end(a)
}
a<-table.end(a)
table.save(a,file='mytable1.tab')