Free Statistics

of Irreproducible Research!

Author's title

Author*Unverified author*
R Software Modulerwasp_autocorrelation.wasp
Title produced by software(Partial) Autocorrelation Function
Date of computationSun, 24 May 2015 23:42:34 +0100
Cite this page as followsStatistical Computations at FreeStatistics.org, Office for Research Development and Education, URL https://freestatistics.org/blog/index.php?v=date/2015/May/24/t1432507501scmsr05mhwfcabt.htm/, Retrieved Thu, 02 May 2024 18:42:14 +0000
Statistical Computations at FreeStatistics.org, Office for Research Development and Education, URL https://freestatistics.org/blog/index.php?pk=279323, Retrieved Thu, 02 May 2024 18:42:14 +0000
QR Codes:

Original text written by user:
IsPrivate?No (this computation is public)
User-defined keywords
Estimated Impact122
Family? (F = Feedback message, R = changed R code, M = changed R Module, P = changed Parameters, D = changed Data)
-       [(Partial) Autocorrelation Function] [] [2015-05-24 22:42:34] [f51cc71db71177f4a98625dd32633bf7] [Current]
Feedback Forum

Post a new message
Dataseries X:
950
775
805
680
705
755
715
860
900
1010
925
650
1060
1050
1025
1085
1160
1310
1445
1445
1615
1650
1255
1175
1300
1280
1390
1340
1110
1325
1265
1150
1430
1655
1570
1345
1430
1260
1495
1125
895
1085
870
1185
1455
1540


Summary of computational transaction
Raw Inputview raw input (R code)
Raw Outputview raw output of R engine
Computing time2 seconds
R Server'Sir Ronald Aylmer Fisher' @ fisher.wessa.net

\begin{tabular}{lllllllll}
\hline
Summary of computational transaction \tabularnewline
Raw Input & view raw input (R code)  \tabularnewline
Raw Output & view raw output of R engine  \tabularnewline
Computing time & 2 seconds \tabularnewline
R Server & 'Sir Ronald Aylmer Fisher' @ fisher.wessa.net \tabularnewline
\hline
\end{tabular}
%Source: https://freestatistics.org/blog/index.php?pk=279323&T=0

[TABLE]
[ROW][C]Summary of computational transaction[/C][/ROW]
[ROW][C]Raw Input[/C][C]view raw input (R code) [/C][/ROW]
[ROW][C]Raw Output[/C][C]view raw output of R engine [/C][/ROW]
[ROW][C]Computing time[/C][C]2 seconds[/C][/ROW]
[ROW][C]R Server[/C][C]'Sir Ronald Aylmer Fisher' @ fisher.wessa.net[/C][/ROW]
[/TABLE]
Source: https://freestatistics.org/blog/index.php?pk=279323&T=0

Globally Unique Identifier (entire table): ba.freestatistics.org/blog/index.php?pk=279323&T=0

As an alternative you can also use a QR Code:  

The GUIDs for individual cells are displayed in the table below:

Summary of computational transaction
Raw Inputview raw input (R code)
Raw Outputview raw output of R engine
Computing time2 seconds
R Server'Sir Ronald Aylmer Fisher' @ fisher.wessa.net


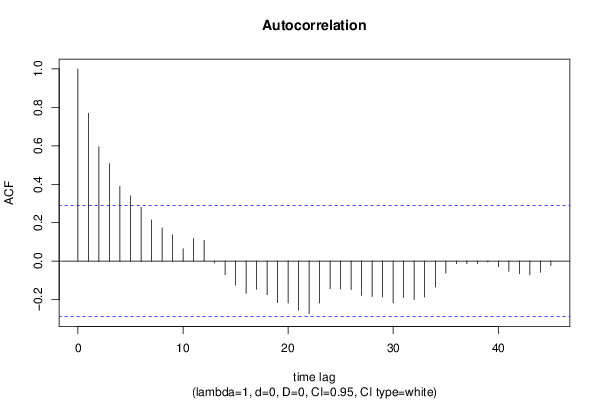
Autocorrelation Function
Time lag kACF(k)T-STATP-value
10.7696025.21972e-06
20.59544.03820.000101
30.5072343.44020.000623
40.3890472.63860.005661
50.3394492.30230.012949
60.2796051.89640.0321
70.2141361.45230.076597
80.1728551.17240.123544
90.1374750.93240.177999
100.0644870.43740.331944
110.1175110.7970.214774
120.1088660.73840.232021
13-0.009482-0.06430.4745
14-0.07054-0.47840.317306
15-0.124849-0.84680.200755
16-0.167115-1.13340.131453
17-0.145705-0.98820.164108
18-0.174473-1.18330.121378
19-0.215991-1.46490.074872
20-0.21778-1.47710.073237
21-0.25574-1.73450.044762
22-0.272784-1.85010.035364
23-0.21821-1.480.072848
24-0.143869-0.97580.167142
25-0.145354-0.98580.164685
26-0.148078-1.00430.160241
27-0.178203-1.20860.11649
28-0.184058-1.24830.109111
29-0.18702-1.26840.105513
30-0.218253-1.48030.07281
31-0.189676-1.28640.102362
32-0.199481-1.35290.091343
33-0.186789-1.26690.10579
34-0.134878-0.91480.182536
35-0.063531-0.43090.33428
36-0.013982-0.09480.462431
37-0.013507-0.09160.463702
38-0.011704-0.07940.468537
39-0.004531-0.03070.487809
40-0.029588-0.20070.42092
41-0.05353-0.36310.359112
42-0.065174-0.4420.330268
43-0.070866-0.48060.316527
44-0.058418-0.39620.346892
45-0.022508-0.15270.439669
46NANANA
47NANANA
48NANANA

\begin{tabular}{lllllllll}
\hline
Autocorrelation Function \tabularnewline
Time lag k & ACF(k) & T-STAT & P-value \tabularnewline
1 & 0.769602 & 5.2197 & 2e-06 \tabularnewline
2 & 0.5954 & 4.0382 & 0.000101 \tabularnewline
3 & 0.507234 & 3.4402 & 0.000623 \tabularnewline
4 & 0.389047 & 2.6386 & 0.005661 \tabularnewline
5 & 0.339449 & 2.3023 & 0.012949 \tabularnewline
6 & 0.279605 & 1.8964 & 0.0321 \tabularnewline
7 & 0.214136 & 1.4523 & 0.076597 \tabularnewline
8 & 0.172855 & 1.1724 & 0.123544 \tabularnewline
9 & 0.137475 & 0.9324 & 0.177999 \tabularnewline
10 & 0.064487 & 0.4374 & 0.331944 \tabularnewline
11 & 0.117511 & 0.797 & 0.214774 \tabularnewline
12 & 0.108866 & 0.7384 & 0.232021 \tabularnewline
13 & -0.009482 & -0.0643 & 0.4745 \tabularnewline
14 & -0.07054 & -0.4784 & 0.317306 \tabularnewline
15 & -0.124849 & -0.8468 & 0.200755 \tabularnewline
16 & -0.167115 & -1.1334 & 0.131453 \tabularnewline
17 & -0.145705 & -0.9882 & 0.164108 \tabularnewline
18 & -0.174473 & -1.1833 & 0.121378 \tabularnewline
19 & -0.215991 & -1.4649 & 0.074872 \tabularnewline
20 & -0.21778 & -1.4771 & 0.073237 \tabularnewline
21 & -0.25574 & -1.7345 & 0.044762 \tabularnewline
22 & -0.272784 & -1.8501 & 0.035364 \tabularnewline
23 & -0.21821 & -1.48 & 0.072848 \tabularnewline
24 & -0.143869 & -0.9758 & 0.167142 \tabularnewline
25 & -0.145354 & -0.9858 & 0.164685 \tabularnewline
26 & -0.148078 & -1.0043 & 0.160241 \tabularnewline
27 & -0.178203 & -1.2086 & 0.11649 \tabularnewline
28 & -0.184058 & -1.2483 & 0.109111 \tabularnewline
29 & -0.18702 & -1.2684 & 0.105513 \tabularnewline
30 & -0.218253 & -1.4803 & 0.07281 \tabularnewline
31 & -0.189676 & -1.2864 & 0.102362 \tabularnewline
32 & -0.199481 & -1.3529 & 0.091343 \tabularnewline
33 & -0.186789 & -1.2669 & 0.10579 \tabularnewline
34 & -0.134878 & -0.9148 & 0.182536 \tabularnewline
35 & -0.063531 & -0.4309 & 0.33428 \tabularnewline
36 & -0.013982 & -0.0948 & 0.462431 \tabularnewline
37 & -0.013507 & -0.0916 & 0.463702 \tabularnewline
38 & -0.011704 & -0.0794 & 0.468537 \tabularnewline
39 & -0.004531 & -0.0307 & 0.487809 \tabularnewline
40 & -0.029588 & -0.2007 & 0.42092 \tabularnewline
41 & -0.05353 & -0.3631 & 0.359112 \tabularnewline
42 & -0.065174 & -0.442 & 0.330268 \tabularnewline
43 & -0.070866 & -0.4806 & 0.316527 \tabularnewline
44 & -0.058418 & -0.3962 & 0.346892 \tabularnewline
45 & -0.022508 & -0.1527 & 0.439669 \tabularnewline
46 & NA & NA & NA \tabularnewline
47 & NA & NA & NA \tabularnewline
48 & NA & NA & NA \tabularnewline
\hline
\end{tabular}
%Source: https://freestatistics.org/blog/index.php?pk=279323&T=1

[TABLE]
[ROW][C]Autocorrelation Function[/C][/ROW]
[ROW][C]Time lag k[/C][C]ACF(k)[/C][C]T-STAT[/C][C]P-value[/C][/ROW]
[ROW][C]1[/C][C]0.769602[/C][C]5.2197[/C][C]2e-06[/C][/ROW]
[ROW][C]2[/C][C]0.5954[/C][C]4.0382[/C][C]0.000101[/C][/ROW]
[ROW][C]3[/C][C]0.507234[/C][C]3.4402[/C][C]0.000623[/C][/ROW]
[ROW][C]4[/C][C]0.389047[/C][C]2.6386[/C][C]0.005661[/C][/ROW]
[ROW][C]5[/C][C]0.339449[/C][C]2.3023[/C][C]0.012949[/C][/ROW]
[ROW][C]6[/C][C]0.279605[/C][C]1.8964[/C][C]0.0321[/C][/ROW]
[ROW][C]7[/C][C]0.214136[/C][C]1.4523[/C][C]0.076597[/C][/ROW]
[ROW][C]8[/C][C]0.172855[/C][C]1.1724[/C][C]0.123544[/C][/ROW]
[ROW][C]9[/C][C]0.137475[/C][C]0.9324[/C][C]0.177999[/C][/ROW]
[ROW][C]10[/C][C]0.064487[/C][C]0.4374[/C][C]0.331944[/C][/ROW]
[ROW][C]11[/C][C]0.117511[/C][C]0.797[/C][C]0.214774[/C][/ROW]
[ROW][C]12[/C][C]0.108866[/C][C]0.7384[/C][C]0.232021[/C][/ROW]
[ROW][C]13[/C][C]-0.009482[/C][C]-0.0643[/C][C]0.4745[/C][/ROW]
[ROW][C]14[/C][C]-0.07054[/C][C]-0.4784[/C][C]0.317306[/C][/ROW]
[ROW][C]15[/C][C]-0.124849[/C][C]-0.8468[/C][C]0.200755[/C][/ROW]
[ROW][C]16[/C][C]-0.167115[/C][C]-1.1334[/C][C]0.131453[/C][/ROW]
[ROW][C]17[/C][C]-0.145705[/C][C]-0.9882[/C][C]0.164108[/C][/ROW]
[ROW][C]18[/C][C]-0.174473[/C][C]-1.1833[/C][C]0.121378[/C][/ROW]
[ROW][C]19[/C][C]-0.215991[/C][C]-1.4649[/C][C]0.074872[/C][/ROW]
[ROW][C]20[/C][C]-0.21778[/C][C]-1.4771[/C][C]0.073237[/C][/ROW]
[ROW][C]21[/C][C]-0.25574[/C][C]-1.7345[/C][C]0.044762[/C][/ROW]
[ROW][C]22[/C][C]-0.272784[/C][C]-1.8501[/C][C]0.035364[/C][/ROW]
[ROW][C]23[/C][C]-0.21821[/C][C]-1.48[/C][C]0.072848[/C][/ROW]
[ROW][C]24[/C][C]-0.143869[/C][C]-0.9758[/C][C]0.167142[/C][/ROW]
[ROW][C]25[/C][C]-0.145354[/C][C]-0.9858[/C][C]0.164685[/C][/ROW]
[ROW][C]26[/C][C]-0.148078[/C][C]-1.0043[/C][C]0.160241[/C][/ROW]
[ROW][C]27[/C][C]-0.178203[/C][C]-1.2086[/C][C]0.11649[/C][/ROW]
[ROW][C]28[/C][C]-0.184058[/C][C]-1.2483[/C][C]0.109111[/C][/ROW]
[ROW][C]29[/C][C]-0.18702[/C][C]-1.2684[/C][C]0.105513[/C][/ROW]
[ROW][C]30[/C][C]-0.218253[/C][C]-1.4803[/C][C]0.07281[/C][/ROW]
[ROW][C]31[/C][C]-0.189676[/C][C]-1.2864[/C][C]0.102362[/C][/ROW]
[ROW][C]32[/C][C]-0.199481[/C][C]-1.3529[/C][C]0.091343[/C][/ROW]
[ROW][C]33[/C][C]-0.186789[/C][C]-1.2669[/C][C]0.10579[/C][/ROW]
[ROW][C]34[/C][C]-0.134878[/C][C]-0.9148[/C][C]0.182536[/C][/ROW]
[ROW][C]35[/C][C]-0.063531[/C][C]-0.4309[/C][C]0.33428[/C][/ROW]
[ROW][C]36[/C][C]-0.013982[/C][C]-0.0948[/C][C]0.462431[/C][/ROW]
[ROW][C]37[/C][C]-0.013507[/C][C]-0.0916[/C][C]0.463702[/C][/ROW]
[ROW][C]38[/C][C]-0.011704[/C][C]-0.0794[/C][C]0.468537[/C][/ROW]
[ROW][C]39[/C][C]-0.004531[/C][C]-0.0307[/C][C]0.487809[/C][/ROW]
[ROW][C]40[/C][C]-0.029588[/C][C]-0.2007[/C][C]0.42092[/C][/ROW]
[ROW][C]41[/C][C]-0.05353[/C][C]-0.3631[/C][C]0.359112[/C][/ROW]
[ROW][C]42[/C][C]-0.065174[/C][C]-0.442[/C][C]0.330268[/C][/ROW]
[ROW][C]43[/C][C]-0.070866[/C][C]-0.4806[/C][C]0.316527[/C][/ROW]
[ROW][C]44[/C][C]-0.058418[/C][C]-0.3962[/C][C]0.346892[/C][/ROW]
[ROW][C]45[/C][C]-0.022508[/C][C]-0.1527[/C][C]0.439669[/C][/ROW]
[ROW][C]46[/C][C]NA[/C][C]NA[/C][C]NA[/C][/ROW]
[ROW][C]47[/C][C]NA[/C][C]NA[/C][C]NA[/C][/ROW]
[ROW][C]48[/C][C]NA[/C][C]NA[/C][C]NA[/C][/ROW]
[/TABLE]
Source: https://freestatistics.org/blog/index.php?pk=279323&T=1

Globally Unique Identifier (entire table): ba.freestatistics.org/blog/index.php?pk=279323&T=1

As an alternative you can also use a QR Code:  

The GUIDs for individual cells are displayed in the table below:

Autocorrelation Function
Time lag kACF(k)T-STATP-value
10.7696025.21972e-06
20.59544.03820.000101
30.5072343.44020.000623
40.3890472.63860.005661
50.3394492.30230.012949
60.2796051.89640.0321
70.2141361.45230.076597
80.1728551.17240.123544
90.1374750.93240.177999
100.0644870.43740.331944
110.1175110.7970.214774
120.1088660.73840.232021
13-0.009482-0.06430.4745
14-0.07054-0.47840.317306
15-0.124849-0.84680.200755
16-0.167115-1.13340.131453
17-0.145705-0.98820.164108
18-0.174473-1.18330.121378
19-0.215991-1.46490.074872
20-0.21778-1.47710.073237
21-0.25574-1.73450.044762
22-0.272784-1.85010.035364
23-0.21821-1.480.072848
24-0.143869-0.97580.167142
25-0.145354-0.98580.164685
26-0.148078-1.00430.160241
27-0.178203-1.20860.11649
28-0.184058-1.24830.109111
29-0.18702-1.26840.105513
30-0.218253-1.48030.07281
31-0.189676-1.28640.102362
32-0.199481-1.35290.091343
33-0.186789-1.26690.10579
34-0.134878-0.91480.182536
35-0.063531-0.43090.33428
36-0.013982-0.09480.462431
37-0.013507-0.09160.463702
38-0.011704-0.07940.468537
39-0.004531-0.03070.487809
40-0.029588-0.20070.42092
41-0.05353-0.36310.359112
42-0.065174-0.4420.330268
43-0.070866-0.48060.316527
44-0.058418-0.39620.346892
45-0.022508-0.15270.439669
46NANANA
47NANANA
48NANANA


Partial Autocorrelation Function
Time lag kPACF(k)T-STATP-value
10.7696025.21972e-06
20.0076360.05180.47946
30.1143880.77580.220913
4-0.095593-0.64830.259994
50.1122660.76140.225144
6-0.056604-0.38390.351409
7-0.00456-0.03090.487732
8-0.012713-0.08620.465832
90.0116730.07920.46862
10-0.119608-0.81120.210708
110.2602081.76480.042117
12-0.137575-0.93310.177826
13-0.192783-1.30750.098767
14-0.067872-0.46030.323724
15-0.004725-0.0320.487287
16-0.053787-0.36480.358466
170.0889270.60310.274692
18-0.121343-0.8230.207381
19-0.035437-0.24030.405564
20-0.055351-0.37540.35454
21-0.004834-0.03280.486995
22-0.066154-0.44870.327886
230.0657640.4460.328833
240.1619771.09860.138834
25-0.097606-0.6620.255639
26-0.04759-0.32280.374165
27-0.0678-0.45980.323899
28-0.02806-0.19030.424952
29-0.130772-0.88690.189863
300.0150090.10180.459681
310.0556830.37770.35371
32-0.118703-0.80510.212457
330.0911930.61850.269648
340.0944710.64070.262438
35-0.032437-0.220.413422
36-0.039232-0.26610.395681
37-0.033207-0.22520.411401
380.0170080.11540.454335
390.0210730.14290.443488
40-0.115055-0.78030.219593
41-0.011284-0.07650.469664
42-0.112071-0.76010.225535
430.0247020.16750.43384
440.0527770.3580.361008
450.0533240.36170.359631
46NANANA
47NANANA
48NANANA

\begin{tabular}{lllllllll}
\hline
Partial Autocorrelation Function \tabularnewline
Time lag k & PACF(k) & T-STAT & P-value \tabularnewline
1 & 0.769602 & 5.2197 & 2e-06 \tabularnewline
2 & 0.007636 & 0.0518 & 0.47946 \tabularnewline
3 & 0.114388 & 0.7758 & 0.220913 \tabularnewline
4 & -0.095593 & -0.6483 & 0.259994 \tabularnewline
5 & 0.112266 & 0.7614 & 0.225144 \tabularnewline
6 & -0.056604 & -0.3839 & 0.351409 \tabularnewline
7 & -0.00456 & -0.0309 & 0.487732 \tabularnewline
8 & -0.012713 & -0.0862 & 0.465832 \tabularnewline
9 & 0.011673 & 0.0792 & 0.46862 \tabularnewline
10 & -0.119608 & -0.8112 & 0.210708 \tabularnewline
11 & 0.260208 & 1.7648 & 0.042117 \tabularnewline
12 & -0.137575 & -0.9331 & 0.177826 \tabularnewline
13 & -0.192783 & -1.3075 & 0.098767 \tabularnewline
14 & -0.067872 & -0.4603 & 0.323724 \tabularnewline
15 & -0.004725 & -0.032 & 0.487287 \tabularnewline
16 & -0.053787 & -0.3648 & 0.358466 \tabularnewline
17 & 0.088927 & 0.6031 & 0.274692 \tabularnewline
18 & -0.121343 & -0.823 & 0.207381 \tabularnewline
19 & -0.035437 & -0.2403 & 0.405564 \tabularnewline
20 & -0.055351 & -0.3754 & 0.35454 \tabularnewline
21 & -0.004834 & -0.0328 & 0.486995 \tabularnewline
22 & -0.066154 & -0.4487 & 0.327886 \tabularnewline
23 & 0.065764 & 0.446 & 0.328833 \tabularnewline
24 & 0.161977 & 1.0986 & 0.138834 \tabularnewline
25 & -0.097606 & -0.662 & 0.255639 \tabularnewline
26 & -0.04759 & -0.3228 & 0.374165 \tabularnewline
27 & -0.0678 & -0.4598 & 0.323899 \tabularnewline
28 & -0.02806 & -0.1903 & 0.424952 \tabularnewline
29 & -0.130772 & -0.8869 & 0.189863 \tabularnewline
30 & 0.015009 & 0.1018 & 0.459681 \tabularnewline
31 & 0.055683 & 0.3777 & 0.35371 \tabularnewline
32 & -0.118703 & -0.8051 & 0.212457 \tabularnewline
33 & 0.091193 & 0.6185 & 0.269648 \tabularnewline
34 & 0.094471 & 0.6407 & 0.262438 \tabularnewline
35 & -0.032437 & -0.22 & 0.413422 \tabularnewline
36 & -0.039232 & -0.2661 & 0.395681 \tabularnewline
37 & -0.033207 & -0.2252 & 0.411401 \tabularnewline
38 & 0.017008 & 0.1154 & 0.454335 \tabularnewline
39 & 0.021073 & 0.1429 & 0.443488 \tabularnewline
40 & -0.115055 & -0.7803 & 0.219593 \tabularnewline
41 & -0.011284 & -0.0765 & 0.469664 \tabularnewline
42 & -0.112071 & -0.7601 & 0.225535 \tabularnewline
43 & 0.024702 & 0.1675 & 0.43384 \tabularnewline
44 & 0.052777 & 0.358 & 0.361008 \tabularnewline
45 & 0.053324 & 0.3617 & 0.359631 \tabularnewline
46 & NA & NA & NA \tabularnewline
47 & NA & NA & NA \tabularnewline
48 & NA & NA & NA \tabularnewline
\hline
\end{tabular}
%Source: https://freestatistics.org/blog/index.php?pk=279323&T=2

[TABLE]
[ROW][C]Partial Autocorrelation Function[/C][/ROW]
[ROW][C]Time lag k[/C][C]PACF(k)[/C][C]T-STAT[/C][C]P-value[/C][/ROW]
[ROW][C]1[/C][C]0.769602[/C][C]5.2197[/C][C]2e-06[/C][/ROW]
[ROW][C]2[/C][C]0.007636[/C][C]0.0518[/C][C]0.47946[/C][/ROW]
[ROW][C]3[/C][C]0.114388[/C][C]0.7758[/C][C]0.220913[/C][/ROW]
[ROW][C]4[/C][C]-0.095593[/C][C]-0.6483[/C][C]0.259994[/C][/ROW]
[ROW][C]5[/C][C]0.112266[/C][C]0.7614[/C][C]0.225144[/C][/ROW]
[ROW][C]6[/C][C]-0.056604[/C][C]-0.3839[/C][C]0.351409[/C][/ROW]
[ROW][C]7[/C][C]-0.00456[/C][C]-0.0309[/C][C]0.487732[/C][/ROW]
[ROW][C]8[/C][C]-0.012713[/C][C]-0.0862[/C][C]0.465832[/C][/ROW]
[ROW][C]9[/C][C]0.011673[/C][C]0.0792[/C][C]0.46862[/C][/ROW]
[ROW][C]10[/C][C]-0.119608[/C][C]-0.8112[/C][C]0.210708[/C][/ROW]
[ROW][C]11[/C][C]0.260208[/C][C]1.7648[/C][C]0.042117[/C][/ROW]
[ROW][C]12[/C][C]-0.137575[/C][C]-0.9331[/C][C]0.177826[/C][/ROW]
[ROW][C]13[/C][C]-0.192783[/C][C]-1.3075[/C][C]0.098767[/C][/ROW]
[ROW][C]14[/C][C]-0.067872[/C][C]-0.4603[/C][C]0.323724[/C][/ROW]
[ROW][C]15[/C][C]-0.004725[/C][C]-0.032[/C][C]0.487287[/C][/ROW]
[ROW][C]16[/C][C]-0.053787[/C][C]-0.3648[/C][C]0.358466[/C][/ROW]
[ROW][C]17[/C][C]0.088927[/C][C]0.6031[/C][C]0.274692[/C][/ROW]
[ROW][C]18[/C][C]-0.121343[/C][C]-0.823[/C][C]0.207381[/C][/ROW]
[ROW][C]19[/C][C]-0.035437[/C][C]-0.2403[/C][C]0.405564[/C][/ROW]
[ROW][C]20[/C][C]-0.055351[/C][C]-0.3754[/C][C]0.35454[/C][/ROW]
[ROW][C]21[/C][C]-0.004834[/C][C]-0.0328[/C][C]0.486995[/C][/ROW]
[ROW][C]22[/C][C]-0.066154[/C][C]-0.4487[/C][C]0.327886[/C][/ROW]
[ROW][C]23[/C][C]0.065764[/C][C]0.446[/C][C]0.328833[/C][/ROW]
[ROW][C]24[/C][C]0.161977[/C][C]1.0986[/C][C]0.138834[/C][/ROW]
[ROW][C]25[/C][C]-0.097606[/C][C]-0.662[/C][C]0.255639[/C][/ROW]
[ROW][C]26[/C][C]-0.04759[/C][C]-0.3228[/C][C]0.374165[/C][/ROW]
[ROW][C]27[/C][C]-0.0678[/C][C]-0.4598[/C][C]0.323899[/C][/ROW]
[ROW][C]28[/C][C]-0.02806[/C][C]-0.1903[/C][C]0.424952[/C][/ROW]
[ROW][C]29[/C][C]-0.130772[/C][C]-0.8869[/C][C]0.189863[/C][/ROW]
[ROW][C]30[/C][C]0.015009[/C][C]0.1018[/C][C]0.459681[/C][/ROW]
[ROW][C]31[/C][C]0.055683[/C][C]0.3777[/C][C]0.35371[/C][/ROW]
[ROW][C]32[/C][C]-0.118703[/C][C]-0.8051[/C][C]0.212457[/C][/ROW]
[ROW][C]33[/C][C]0.091193[/C][C]0.6185[/C][C]0.269648[/C][/ROW]
[ROW][C]34[/C][C]0.094471[/C][C]0.6407[/C][C]0.262438[/C][/ROW]
[ROW][C]35[/C][C]-0.032437[/C][C]-0.22[/C][C]0.413422[/C][/ROW]
[ROW][C]36[/C][C]-0.039232[/C][C]-0.2661[/C][C]0.395681[/C][/ROW]
[ROW][C]37[/C][C]-0.033207[/C][C]-0.2252[/C][C]0.411401[/C][/ROW]
[ROW][C]38[/C][C]0.017008[/C][C]0.1154[/C][C]0.454335[/C][/ROW]
[ROW][C]39[/C][C]0.021073[/C][C]0.1429[/C][C]0.443488[/C][/ROW]
[ROW][C]40[/C][C]-0.115055[/C][C]-0.7803[/C][C]0.219593[/C][/ROW]
[ROW][C]41[/C][C]-0.011284[/C][C]-0.0765[/C][C]0.469664[/C][/ROW]
[ROW][C]42[/C][C]-0.112071[/C][C]-0.7601[/C][C]0.225535[/C][/ROW]
[ROW][C]43[/C][C]0.024702[/C][C]0.1675[/C][C]0.43384[/C][/ROW]
[ROW][C]44[/C][C]0.052777[/C][C]0.358[/C][C]0.361008[/C][/ROW]
[ROW][C]45[/C][C]0.053324[/C][C]0.3617[/C][C]0.359631[/C][/ROW]
[ROW][C]46[/C][C]NA[/C][C]NA[/C][C]NA[/C][/ROW]
[ROW][C]47[/C][C]NA[/C][C]NA[/C][C]NA[/C][/ROW]
[ROW][C]48[/C][C]NA[/C][C]NA[/C][C]NA[/C][/ROW]
[/TABLE]
Source: https://freestatistics.org/blog/index.php?pk=279323&T=2

Globally Unique Identifier (entire table): ba.freestatistics.org/blog/index.php?pk=279323&T=2

As an alternative you can also use a QR Code:  

The GUIDs for individual cells are displayed in the table below:

Partial Autocorrelation Function
Time lag kPACF(k)T-STATP-value
10.7696025.21972e-06
20.0076360.05180.47946
30.1143880.77580.220913
4-0.095593-0.64830.259994
50.1122660.76140.225144
6-0.056604-0.38390.351409
7-0.00456-0.03090.487732
8-0.012713-0.08620.465832
90.0116730.07920.46862
10-0.119608-0.81120.210708
110.2602081.76480.042117
12-0.137575-0.93310.177826
13-0.192783-1.30750.098767
14-0.067872-0.46030.323724
15-0.004725-0.0320.487287
16-0.053787-0.36480.358466
170.0889270.60310.274692
18-0.121343-0.8230.207381
19-0.035437-0.24030.405564
20-0.055351-0.37540.35454
21-0.004834-0.03280.486995
22-0.066154-0.44870.327886
230.0657640.4460.328833
240.1619771.09860.138834
25-0.097606-0.6620.255639
26-0.04759-0.32280.374165
27-0.0678-0.45980.323899
28-0.02806-0.19030.424952
29-0.130772-0.88690.189863
300.0150090.10180.459681
310.0556830.37770.35371
32-0.118703-0.80510.212457
330.0911930.61850.269648
340.0944710.64070.262438
35-0.032437-0.220.413422
36-0.039232-0.26610.395681
37-0.033207-0.22520.411401
380.0170080.11540.454335
390.0210730.14290.443488
40-0.115055-0.78030.219593
41-0.011284-0.07650.469664
42-0.112071-0.76010.225535
430.0247020.16750.43384
440.0527770.3580.361008
450.0533240.36170.359631
46NANANA
47NANANA
48NANANA


Parameters (Session):
Parameters (R input):
par1 = 48 ; par2 = 1 ; par3 = 0 ; par4 = 0 ; par5 = 12 ; par6 = White Noise ; par7 = 0.95 ; par8 = ;
R code (references can be found in the software module):
if (par1 == 'Default') {
par1 = 10*log10(length(x))
} else {
par1 <- as.numeric(par1)
}
par2 <- as.numeric(par2)
par3 <- as.numeric(par3)
par4 <- as.numeric(par4)
par5 <- as.numeric(par5)
if (par6 == 'White Noise') par6 <- 'white' else par6 <- 'ma'
par7 <- as.numeric(par7)
if (par8 != '') par8 <- as.numeric(par8)
ox <- x
if (par8 == '') {
if (par2 == 0) {
x <- log(x)
} else {
x <- (x ^ par2 - 1) / par2
}
} else {
x <- log(x,base=par8)
}
if (par3 > 0) x <- diff(x,lag=1,difference=par3)
if (par4 > 0) x <- diff(x,lag=par5,difference=par4)
bitmap(file='picts.png')
op <- par(mfrow=c(2,1))
plot(ox,type='l',main='Original Time Series',xlab='time',ylab='value')
if (par8=='') {
mytitle <- paste('Working Time Series (lambda=',par2,', d=',par3,', D=',par4,')',sep='')
mysub <- paste('(lambda=',par2,', d=',par3,', D=',par4,', CI=', par7, ', CI type=',par6,')',sep='')
} else {
mytitle <- paste('Working Time Series (base=',par8,', d=',par3,', D=',par4,')',sep='')
mysub <- paste('(base=',par8,', d=',par3,', D=',par4,', CI=', par7, ', CI type=',par6,')',sep='')
}
plot(x,type='l', main=mytitle,xlab='time',ylab='value')
par(op)
dev.off()
bitmap(file='pic1.png')
racf <- acf(x, par1, main='Autocorrelation', xlab='time lag', ylab='ACF', ci.type=par6, ci=par7, sub=mysub)
dev.off()
bitmap(file='pic2.png')
rpacf <- pacf(x,par1,main='Partial Autocorrelation',xlab='lags',ylab='PACF',sub=mysub)
dev.off()
(myacf <- c(racf$acf))
(mypacf <- c(rpacf$acf))
lengthx <- length(x)
sqrtn <- sqrt(lengthx)
load(file='createtable')
a<-table.start()
a<-table.row.start(a)
a<-table.element(a,'Autocorrelation Function',4,TRUE)
a<-table.row.end(a)
a<-table.row.start(a)
a<-table.element(a,'Time lag k',header=TRUE)
a<-table.element(a,hyperlink('basics.htm','ACF(k)','click here for more information about the Autocorrelation Function'),header=TRUE)
a<-table.element(a,'T-STAT',header=TRUE)
a<-table.element(a,'P-value',header=TRUE)
a<-table.row.end(a)
for (i in 2:(par1+1)) {
a<-table.row.start(a)
a<-table.element(a,i-1,header=TRUE)
a<-table.element(a,round(myacf[i],6))
mytstat <- myacf[i]*sqrtn
a<-table.element(a,round(mytstat,4))
a<-table.element(a,round(1-pt(abs(mytstat),lengthx),6))
a<-table.row.end(a)
}
a<-table.end(a)
table.save(a,file='mytable.tab')
a<-table.start()
a<-table.row.start(a)
a<-table.element(a,'Partial Autocorrelation Function',4,TRUE)
a<-table.row.end(a)
a<-table.row.start(a)
a<-table.element(a,'Time lag k',header=TRUE)
a<-table.element(a,hyperlink('basics.htm','PACF(k)','click here for more information about the Partial Autocorrelation Function'),header=TRUE)
a<-table.element(a,'T-STAT',header=TRUE)
a<-table.element(a,'P-value',header=TRUE)
a<-table.row.end(a)
for (i in 1:par1) {
a<-table.row.start(a)
a<-table.element(a,i,header=TRUE)
a<-table.element(a,round(mypacf[i],6))
mytstat <- mypacf[i]*sqrtn
a<-table.element(a,round(mytstat,4))
a<-table.element(a,round(1-pt(abs(mytstat),lengthx),6))
a<-table.row.end(a)
}
a<-table.end(a)
table.save(a,file='mytable1.tab')