Free Statistics

of Irreproducible Research!

Author's title

Author*Unverified author*
R Software Modulerwasp_autocorrelation.wasp
Title produced by software(Partial) Autocorrelation Function
Date of computationSun, 24 May 2015 12:25:56 +0100
Cite this page as followsStatistical Computations at FreeStatistics.org, Office for Research Development and Education, URL https://freestatistics.org/blog/index.php?v=date/2015/May/24/t1432467136fp8jtr27a80hr6e.htm/, Retrieved Thu, 02 May 2024 18:37:16 +0000
Statistical Computations at FreeStatistics.org, Office for Research Development and Education, URL https://freestatistics.org/blog/index.php?pk=279291, Retrieved Thu, 02 May 2024 18:37:16 +0000
QR Codes:

Original text written by user:
IsPrivate?No (this computation is public)
User-defined keywords
Estimated Impact127
Family? (F = Feedback message, R = changed R code, M = changed R Module, P = changed Parameters, D = changed Data)
-       [(Partial) Autocorrelation Function] [Autocorrelatie We...] [2015-05-24 11:25:56] [318ebe2e7bf55ee158992108d321fa26] [Current]
Feedback Forum

Post a new message
Dataseries X:
81
85
90
84
94
131
130
99
101
82
90
85
105
110
115
110
114
149
147
113
113
107
109
103
113
112
114
106
107
134
135
105
105
90
92
83
95
98
95
81
83
106
114
80
82
76
78
70
82
86
87
74
79
110
117
82
71
67
66
57
71
77
76
69
74
101
105
73
68
65
70
65
80
92
93
90
96
125
134
100
97
97
101
90
108
113
112
103
103
125
128
91
84
83
83
69
77
83
78
70
75
101
117
80
87
81
78
73
93
105
102
97
100
127
138
107
107
106
109
107
129
138
137
134
134
166
180
131
135
127
121
116
127
138
124
121
123
144
157
107
107
105
104
96


Summary of computational transaction
Raw Inputview raw input (R code)
Raw Outputview raw output of R engine
Computing time2 seconds
R Server'George Udny Yule' @ yule.wessa.net

\begin{tabular}{lllllllll}
\hline
Summary of computational transaction \tabularnewline
Raw Input & view raw input (R code)  \tabularnewline
Raw Output & view raw output of R engine  \tabularnewline
Computing time & 2 seconds \tabularnewline
R Server & 'George Udny Yule' @ yule.wessa.net \tabularnewline
\hline
\end{tabular}
%Source: https://freestatistics.org/blog/index.php?pk=279291&T=0

[TABLE]
[ROW][C]Summary of computational transaction[/C][/ROW]
[ROW][C]Raw Input[/C][C]view raw input (R code) [/C][/ROW]
[ROW][C]Raw Output[/C][C]view raw output of R engine [/C][/ROW]
[ROW][C]Computing time[/C][C]2 seconds[/C][/ROW]
[ROW][C]R Server[/C][C]'George Udny Yule' @ yule.wessa.net[/C][/ROW]
[/TABLE]
Source: https://freestatistics.org/blog/index.php?pk=279291&T=0

Globally Unique Identifier (entire table): ba.freestatistics.org/blog/index.php?pk=279291&T=0

As an alternative you can also use a QR Code:  

The GUIDs for individual cells are displayed in the table below:

Summary of computational transaction
Raw Inputview raw input (R code)
Raw Outputview raw output of R engine
Computing time2 seconds
R Server'George Udny Yule' @ yule.wessa.net


Autocorrelation Function
Time lag kACF(k)T-STATP-value
10.7762399.31490
20.5556096.66730
30.4953345.9440
40.4941765.93010
50.4117774.94131e-06
60.3459364.15122.8e-05
70.3641234.36951.2e-05
80.3788434.54616e-06
90.3131393.75770.000124
100.3028933.63470.000193
110.4357865.22940
120.5725676.87080
130.343464.12153.2e-05
140.1118431.34210.090835
150.0495410.59450.276558
160.041850.50220.308149
17-0.045868-0.55040.291442
18-0.106026-1.27230.102657
19-0.089172-1.07010.143191
20-0.066521-0.79830.21302
21-0.118568-1.42280.078477
22-0.105662-1.26790.103433
230.0383250.45990.323141
240.1916642.30.011443
250.0222560.26710.394897
26-0.152543-1.83050.03462
27-0.176456-2.11750.017969
28-0.149966-1.79960.037009
29-0.193911-2.32690.010681
30-0.213445-2.56130.005728
31-0.155228-1.86270.032269
32-0.100777-1.20930.11426
33-0.12417-1.490.0692
34-0.091393-1.09670.137299
350.0560760.67290.25104
360.2121592.54590.005975
370.0755810.9070.182968
38-0.074478-0.89370.186477
39-0.089093-1.06910.143404
40-0.063132-0.75760.224969
41-0.10783-1.2940.098876
42-0.126283-1.51540.065932
43-0.075996-0.9120.181659
44-0.033745-0.40490.34306
45-0.063375-0.76050.224101
46-0.035819-0.42980.333982
470.095251.1430.127467
480.2238152.68580.004043

\begin{tabular}{lllllllll}
\hline
Autocorrelation Function \tabularnewline
Time lag k & ACF(k) & T-STAT & P-value \tabularnewline
1 & 0.776239 & 9.3149 & 0 \tabularnewline
2 & 0.555609 & 6.6673 & 0 \tabularnewline
3 & 0.495334 & 5.944 & 0 \tabularnewline
4 & 0.494176 & 5.9301 & 0 \tabularnewline
5 & 0.411777 & 4.9413 & 1e-06 \tabularnewline
6 & 0.345936 & 4.1512 & 2.8e-05 \tabularnewline
7 & 0.364123 & 4.3695 & 1.2e-05 \tabularnewline
8 & 0.378843 & 4.5461 & 6e-06 \tabularnewline
9 & 0.313139 & 3.7577 & 0.000124 \tabularnewline
10 & 0.302893 & 3.6347 & 0.000193 \tabularnewline
11 & 0.435786 & 5.2294 & 0 \tabularnewline
12 & 0.572567 & 6.8708 & 0 \tabularnewline
13 & 0.34346 & 4.1215 & 3.2e-05 \tabularnewline
14 & 0.111843 & 1.3421 & 0.090835 \tabularnewline
15 & 0.049541 & 0.5945 & 0.276558 \tabularnewline
16 & 0.04185 & 0.5022 & 0.308149 \tabularnewline
17 & -0.045868 & -0.5504 & 0.291442 \tabularnewline
18 & -0.106026 & -1.2723 & 0.102657 \tabularnewline
19 & -0.089172 & -1.0701 & 0.143191 \tabularnewline
20 & -0.066521 & -0.7983 & 0.21302 \tabularnewline
21 & -0.118568 & -1.4228 & 0.078477 \tabularnewline
22 & -0.105662 & -1.2679 & 0.103433 \tabularnewline
23 & 0.038325 & 0.4599 & 0.323141 \tabularnewline
24 & 0.191664 & 2.3 & 0.011443 \tabularnewline
25 & 0.022256 & 0.2671 & 0.394897 \tabularnewline
26 & -0.152543 & -1.8305 & 0.03462 \tabularnewline
27 & -0.176456 & -2.1175 & 0.017969 \tabularnewline
28 & -0.149966 & -1.7996 & 0.037009 \tabularnewline
29 & -0.193911 & -2.3269 & 0.010681 \tabularnewline
30 & -0.213445 & -2.5613 & 0.005728 \tabularnewline
31 & -0.155228 & -1.8627 & 0.032269 \tabularnewline
32 & -0.100777 & -1.2093 & 0.11426 \tabularnewline
33 & -0.12417 & -1.49 & 0.0692 \tabularnewline
34 & -0.091393 & -1.0967 & 0.137299 \tabularnewline
35 & 0.056076 & 0.6729 & 0.25104 \tabularnewline
36 & 0.212159 & 2.5459 & 0.005975 \tabularnewline
37 & 0.075581 & 0.907 & 0.182968 \tabularnewline
38 & -0.074478 & -0.8937 & 0.186477 \tabularnewline
39 & -0.089093 & -1.0691 & 0.143404 \tabularnewline
40 & -0.063132 & -0.7576 & 0.224969 \tabularnewline
41 & -0.10783 & -1.294 & 0.098876 \tabularnewline
42 & -0.126283 & -1.5154 & 0.065932 \tabularnewline
43 & -0.075996 & -0.912 & 0.181659 \tabularnewline
44 & -0.033745 & -0.4049 & 0.34306 \tabularnewline
45 & -0.063375 & -0.7605 & 0.224101 \tabularnewline
46 & -0.035819 & -0.4298 & 0.333982 \tabularnewline
47 & 0.09525 & 1.143 & 0.127467 \tabularnewline
48 & 0.223815 & 2.6858 & 0.004043 \tabularnewline
\hline
\end{tabular}
%Source: https://freestatistics.org/blog/index.php?pk=279291&T=1

[TABLE]
[ROW][C]Autocorrelation Function[/C][/ROW]
[ROW][C]Time lag k[/C][C]ACF(k)[/C][C]T-STAT[/C][C]P-value[/C][/ROW]
[ROW][C]1[/C][C]0.776239[/C][C]9.3149[/C][C]0[/C][/ROW]
[ROW][C]2[/C][C]0.555609[/C][C]6.6673[/C][C]0[/C][/ROW]
[ROW][C]3[/C][C]0.495334[/C][C]5.944[/C][C]0[/C][/ROW]
[ROW][C]4[/C][C]0.494176[/C][C]5.9301[/C][C]0[/C][/ROW]
[ROW][C]5[/C][C]0.411777[/C][C]4.9413[/C][C]1e-06[/C][/ROW]
[ROW][C]6[/C][C]0.345936[/C][C]4.1512[/C][C]2.8e-05[/C][/ROW]
[ROW][C]7[/C][C]0.364123[/C][C]4.3695[/C][C]1.2e-05[/C][/ROW]
[ROW][C]8[/C][C]0.378843[/C][C]4.5461[/C][C]6e-06[/C][/ROW]
[ROW][C]9[/C][C]0.313139[/C][C]3.7577[/C][C]0.000124[/C][/ROW]
[ROW][C]10[/C][C]0.302893[/C][C]3.6347[/C][C]0.000193[/C][/ROW]
[ROW][C]11[/C][C]0.435786[/C][C]5.2294[/C][C]0[/C][/ROW]
[ROW][C]12[/C][C]0.572567[/C][C]6.8708[/C][C]0[/C][/ROW]
[ROW][C]13[/C][C]0.34346[/C][C]4.1215[/C][C]3.2e-05[/C][/ROW]
[ROW][C]14[/C][C]0.111843[/C][C]1.3421[/C][C]0.090835[/C][/ROW]
[ROW][C]15[/C][C]0.049541[/C][C]0.5945[/C][C]0.276558[/C][/ROW]
[ROW][C]16[/C][C]0.04185[/C][C]0.5022[/C][C]0.308149[/C][/ROW]
[ROW][C]17[/C][C]-0.045868[/C][C]-0.5504[/C][C]0.291442[/C][/ROW]
[ROW][C]18[/C][C]-0.106026[/C][C]-1.2723[/C][C]0.102657[/C][/ROW]
[ROW][C]19[/C][C]-0.089172[/C][C]-1.0701[/C][C]0.143191[/C][/ROW]
[ROW][C]20[/C][C]-0.066521[/C][C]-0.7983[/C][C]0.21302[/C][/ROW]
[ROW][C]21[/C][C]-0.118568[/C][C]-1.4228[/C][C]0.078477[/C][/ROW]
[ROW][C]22[/C][C]-0.105662[/C][C]-1.2679[/C][C]0.103433[/C][/ROW]
[ROW][C]23[/C][C]0.038325[/C][C]0.4599[/C][C]0.323141[/C][/ROW]
[ROW][C]24[/C][C]0.191664[/C][C]2.3[/C][C]0.011443[/C][/ROW]
[ROW][C]25[/C][C]0.022256[/C][C]0.2671[/C][C]0.394897[/C][/ROW]
[ROW][C]26[/C][C]-0.152543[/C][C]-1.8305[/C][C]0.03462[/C][/ROW]
[ROW][C]27[/C][C]-0.176456[/C][C]-2.1175[/C][C]0.017969[/C][/ROW]
[ROW][C]28[/C][C]-0.149966[/C][C]-1.7996[/C][C]0.037009[/C][/ROW]
[ROW][C]29[/C][C]-0.193911[/C][C]-2.3269[/C][C]0.010681[/C][/ROW]
[ROW][C]30[/C][C]-0.213445[/C][C]-2.5613[/C][C]0.005728[/C][/ROW]
[ROW][C]31[/C][C]-0.155228[/C][C]-1.8627[/C][C]0.032269[/C][/ROW]
[ROW][C]32[/C][C]-0.100777[/C][C]-1.2093[/C][C]0.11426[/C][/ROW]
[ROW][C]33[/C][C]-0.12417[/C][C]-1.49[/C][C]0.0692[/C][/ROW]
[ROW][C]34[/C][C]-0.091393[/C][C]-1.0967[/C][C]0.137299[/C][/ROW]
[ROW][C]35[/C][C]0.056076[/C][C]0.6729[/C][C]0.25104[/C][/ROW]
[ROW][C]36[/C][C]0.212159[/C][C]2.5459[/C][C]0.005975[/C][/ROW]
[ROW][C]37[/C][C]0.075581[/C][C]0.907[/C][C]0.182968[/C][/ROW]
[ROW][C]38[/C][C]-0.074478[/C][C]-0.8937[/C][C]0.186477[/C][/ROW]
[ROW][C]39[/C][C]-0.089093[/C][C]-1.0691[/C][C]0.143404[/C][/ROW]
[ROW][C]40[/C][C]-0.063132[/C][C]-0.7576[/C][C]0.224969[/C][/ROW]
[ROW][C]41[/C][C]-0.10783[/C][C]-1.294[/C][C]0.098876[/C][/ROW]
[ROW][C]42[/C][C]-0.126283[/C][C]-1.5154[/C][C]0.065932[/C][/ROW]
[ROW][C]43[/C][C]-0.075996[/C][C]-0.912[/C][C]0.181659[/C][/ROW]
[ROW][C]44[/C][C]-0.033745[/C][C]-0.4049[/C][C]0.34306[/C][/ROW]
[ROW][C]45[/C][C]-0.063375[/C][C]-0.7605[/C][C]0.224101[/C][/ROW]
[ROW][C]46[/C][C]-0.035819[/C][C]-0.4298[/C][C]0.333982[/C][/ROW]
[ROW][C]47[/C][C]0.09525[/C][C]1.143[/C][C]0.127467[/C][/ROW]
[ROW][C]48[/C][C]0.223815[/C][C]2.6858[/C][C]0.004043[/C][/ROW]
[/TABLE]
Source: https://freestatistics.org/blog/index.php?pk=279291&T=1

Globally Unique Identifier (entire table): ba.freestatistics.org/blog/index.php?pk=279291&T=1

As an alternative you can also use a QR Code:  

The GUIDs for individual cells are displayed in the table below:

Autocorrelation Function
Time lag kACF(k)T-STATP-value
10.7762399.31490
20.5556096.66730
30.4953345.9440
40.4941765.93010
50.4117774.94131e-06
60.3459364.15122.8e-05
70.3641234.36951.2e-05
80.3788434.54616e-06
90.3131393.75770.000124
100.3028933.63470.000193
110.4357865.22940
120.5725676.87080
130.343464.12153.2e-05
140.1118431.34210.090835
150.0495410.59450.276558
160.041850.50220.308149
17-0.045868-0.55040.291442
18-0.106026-1.27230.102657
19-0.089172-1.07010.143191
20-0.066521-0.79830.21302
21-0.118568-1.42280.078477
22-0.105662-1.26790.103433
230.0383250.45990.323141
240.1916642.30.011443
250.0222560.26710.394897
26-0.152543-1.83050.03462
27-0.176456-2.11750.017969
28-0.149966-1.79960.037009
29-0.193911-2.32690.010681
30-0.213445-2.56130.005728
31-0.155228-1.86270.032269
32-0.100777-1.20930.11426
33-0.12417-1.490.0692
34-0.091393-1.09670.137299
350.0560760.67290.25104
360.2121592.54590.005975
370.0755810.9070.182968
38-0.074478-0.89370.186477
39-0.089093-1.06910.143404
40-0.063132-0.75760.224969
41-0.10783-1.2940.098876
42-0.126283-1.51540.065932
43-0.075996-0.9120.181659
44-0.033745-0.40490.34306
45-0.063375-0.76050.224101
46-0.035819-0.42980.333982
470.095251.1430.127467
480.2238152.68580.004043


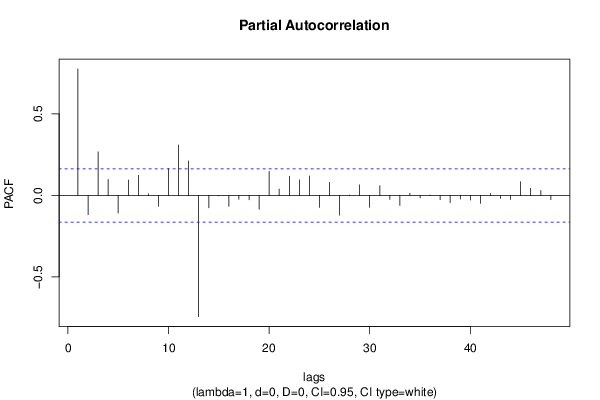
Partial Autocorrelation Function
Time lag kPACF(k)T-STATP-value
10.7762399.31490
2-0.118098-1.41720.079296
30.2673753.20850.000822
40.0979191.1750.12096
5-0.108095-1.29710.098328
60.0944451.13330.129477
70.1230171.47620.071037
80.0092650.11120.455817
9-0.067017-0.80420.211302
100.1643061.97170.025282
110.3091493.70980.000148
120.2110242.53230.006202
13-0.744297-8.93160
14-0.075688-0.90830.182629
15-0.00231-0.02770.48896
16-0.066325-0.79590.2137
17-0.023997-0.2880.386894
18-0.026567-0.31880.375168
19-0.085344-1.02410.153745
200.1465851.7590.040349
210.0389880.46790.320296
220.1178591.41430.079714
230.0951311.14160.127764
240.1188381.42610.078009
25-0.073739-0.88490.188853
260.0799980.960.169337
27-0.121093-1.45310.074184
280.0018140.02180.49133
290.0648070.77770.219017
30-0.07287-0.87440.191669
310.0590530.70860.239849
32-0.024457-0.29350.384787
33-0.061164-0.7340.23208
340.0124250.14910.44084
35-0.014378-0.17250.431631
360.0013570.01630.493517
37-0.025903-0.31080.378188
38-0.044216-0.53060.29826
39-0.021772-0.26130.397133
40-0.027879-0.33450.369226
41-0.047794-0.57350.28359
420.0116840.14020.444346
43-0.018699-0.22440.411387
44-0.024753-0.2970.383431
450.0840371.00840.157468
460.0437080.52450.300371
470.029750.3570.360809
48-0.025811-0.30970.378606

\begin{tabular}{lllllllll}
\hline
Partial Autocorrelation Function \tabularnewline
Time lag k & PACF(k) & T-STAT & P-value \tabularnewline
1 & 0.776239 & 9.3149 & 0 \tabularnewline
2 & -0.118098 & -1.4172 & 0.079296 \tabularnewline
3 & 0.267375 & 3.2085 & 0.000822 \tabularnewline
4 & 0.097919 & 1.175 & 0.12096 \tabularnewline
5 & -0.108095 & -1.2971 & 0.098328 \tabularnewline
6 & 0.094445 & 1.1333 & 0.129477 \tabularnewline
7 & 0.123017 & 1.4762 & 0.071037 \tabularnewline
8 & 0.009265 & 0.1112 & 0.455817 \tabularnewline
9 & -0.067017 & -0.8042 & 0.211302 \tabularnewline
10 & 0.164306 & 1.9717 & 0.025282 \tabularnewline
11 & 0.309149 & 3.7098 & 0.000148 \tabularnewline
12 & 0.211024 & 2.5323 & 0.006202 \tabularnewline
13 & -0.744297 & -8.9316 & 0 \tabularnewline
14 & -0.075688 & -0.9083 & 0.182629 \tabularnewline
15 & -0.00231 & -0.0277 & 0.48896 \tabularnewline
16 & -0.066325 & -0.7959 & 0.2137 \tabularnewline
17 & -0.023997 & -0.288 & 0.386894 \tabularnewline
18 & -0.026567 & -0.3188 & 0.375168 \tabularnewline
19 & -0.085344 & -1.0241 & 0.153745 \tabularnewline
20 & 0.146585 & 1.759 & 0.040349 \tabularnewline
21 & 0.038988 & 0.4679 & 0.320296 \tabularnewline
22 & 0.117859 & 1.4143 & 0.079714 \tabularnewline
23 & 0.095131 & 1.1416 & 0.127764 \tabularnewline
24 & 0.118838 & 1.4261 & 0.078009 \tabularnewline
25 & -0.073739 & -0.8849 & 0.188853 \tabularnewline
26 & 0.079998 & 0.96 & 0.169337 \tabularnewline
27 & -0.121093 & -1.4531 & 0.074184 \tabularnewline
28 & 0.001814 & 0.0218 & 0.49133 \tabularnewline
29 & 0.064807 & 0.7777 & 0.219017 \tabularnewline
30 & -0.07287 & -0.8744 & 0.191669 \tabularnewline
31 & 0.059053 & 0.7086 & 0.239849 \tabularnewline
32 & -0.024457 & -0.2935 & 0.384787 \tabularnewline
33 & -0.061164 & -0.734 & 0.23208 \tabularnewline
34 & 0.012425 & 0.1491 & 0.44084 \tabularnewline
35 & -0.014378 & -0.1725 & 0.431631 \tabularnewline
36 & 0.001357 & 0.0163 & 0.493517 \tabularnewline
37 & -0.025903 & -0.3108 & 0.378188 \tabularnewline
38 & -0.044216 & -0.5306 & 0.29826 \tabularnewline
39 & -0.021772 & -0.2613 & 0.397133 \tabularnewline
40 & -0.027879 & -0.3345 & 0.369226 \tabularnewline
41 & -0.047794 & -0.5735 & 0.28359 \tabularnewline
42 & 0.011684 & 0.1402 & 0.444346 \tabularnewline
43 & -0.018699 & -0.2244 & 0.411387 \tabularnewline
44 & -0.024753 & -0.297 & 0.383431 \tabularnewline
45 & 0.084037 & 1.0084 & 0.157468 \tabularnewline
46 & 0.043708 & 0.5245 & 0.300371 \tabularnewline
47 & 0.02975 & 0.357 & 0.360809 \tabularnewline
48 & -0.025811 & -0.3097 & 0.378606 \tabularnewline
\hline
\end{tabular}
%Source: https://freestatistics.org/blog/index.php?pk=279291&T=2

[TABLE]
[ROW][C]Partial Autocorrelation Function[/C][/ROW]
[ROW][C]Time lag k[/C][C]PACF(k)[/C][C]T-STAT[/C][C]P-value[/C][/ROW]
[ROW][C]1[/C][C]0.776239[/C][C]9.3149[/C][C]0[/C][/ROW]
[ROW][C]2[/C][C]-0.118098[/C][C]-1.4172[/C][C]0.079296[/C][/ROW]
[ROW][C]3[/C][C]0.267375[/C][C]3.2085[/C][C]0.000822[/C][/ROW]
[ROW][C]4[/C][C]0.097919[/C][C]1.175[/C][C]0.12096[/C][/ROW]
[ROW][C]5[/C][C]-0.108095[/C][C]-1.2971[/C][C]0.098328[/C][/ROW]
[ROW][C]6[/C][C]0.094445[/C][C]1.1333[/C][C]0.129477[/C][/ROW]
[ROW][C]7[/C][C]0.123017[/C][C]1.4762[/C][C]0.071037[/C][/ROW]
[ROW][C]8[/C][C]0.009265[/C][C]0.1112[/C][C]0.455817[/C][/ROW]
[ROW][C]9[/C][C]-0.067017[/C][C]-0.8042[/C][C]0.211302[/C][/ROW]
[ROW][C]10[/C][C]0.164306[/C][C]1.9717[/C][C]0.025282[/C][/ROW]
[ROW][C]11[/C][C]0.309149[/C][C]3.7098[/C][C]0.000148[/C][/ROW]
[ROW][C]12[/C][C]0.211024[/C][C]2.5323[/C][C]0.006202[/C][/ROW]
[ROW][C]13[/C][C]-0.744297[/C][C]-8.9316[/C][C]0[/C][/ROW]
[ROW][C]14[/C][C]-0.075688[/C][C]-0.9083[/C][C]0.182629[/C][/ROW]
[ROW][C]15[/C][C]-0.00231[/C][C]-0.0277[/C][C]0.48896[/C][/ROW]
[ROW][C]16[/C][C]-0.066325[/C][C]-0.7959[/C][C]0.2137[/C][/ROW]
[ROW][C]17[/C][C]-0.023997[/C][C]-0.288[/C][C]0.386894[/C][/ROW]
[ROW][C]18[/C][C]-0.026567[/C][C]-0.3188[/C][C]0.375168[/C][/ROW]
[ROW][C]19[/C][C]-0.085344[/C][C]-1.0241[/C][C]0.153745[/C][/ROW]
[ROW][C]20[/C][C]0.146585[/C][C]1.759[/C][C]0.040349[/C][/ROW]
[ROW][C]21[/C][C]0.038988[/C][C]0.4679[/C][C]0.320296[/C][/ROW]
[ROW][C]22[/C][C]0.117859[/C][C]1.4143[/C][C]0.079714[/C][/ROW]
[ROW][C]23[/C][C]0.095131[/C][C]1.1416[/C][C]0.127764[/C][/ROW]
[ROW][C]24[/C][C]0.118838[/C][C]1.4261[/C][C]0.078009[/C][/ROW]
[ROW][C]25[/C][C]-0.073739[/C][C]-0.8849[/C][C]0.188853[/C][/ROW]
[ROW][C]26[/C][C]0.079998[/C][C]0.96[/C][C]0.169337[/C][/ROW]
[ROW][C]27[/C][C]-0.121093[/C][C]-1.4531[/C][C]0.074184[/C][/ROW]
[ROW][C]28[/C][C]0.001814[/C][C]0.0218[/C][C]0.49133[/C][/ROW]
[ROW][C]29[/C][C]0.064807[/C][C]0.7777[/C][C]0.219017[/C][/ROW]
[ROW][C]30[/C][C]-0.07287[/C][C]-0.8744[/C][C]0.191669[/C][/ROW]
[ROW][C]31[/C][C]0.059053[/C][C]0.7086[/C][C]0.239849[/C][/ROW]
[ROW][C]32[/C][C]-0.024457[/C][C]-0.2935[/C][C]0.384787[/C][/ROW]
[ROW][C]33[/C][C]-0.061164[/C][C]-0.734[/C][C]0.23208[/C][/ROW]
[ROW][C]34[/C][C]0.012425[/C][C]0.1491[/C][C]0.44084[/C][/ROW]
[ROW][C]35[/C][C]-0.014378[/C][C]-0.1725[/C][C]0.431631[/C][/ROW]
[ROW][C]36[/C][C]0.001357[/C][C]0.0163[/C][C]0.493517[/C][/ROW]
[ROW][C]37[/C][C]-0.025903[/C][C]-0.3108[/C][C]0.378188[/C][/ROW]
[ROW][C]38[/C][C]-0.044216[/C][C]-0.5306[/C][C]0.29826[/C][/ROW]
[ROW][C]39[/C][C]-0.021772[/C][C]-0.2613[/C][C]0.397133[/C][/ROW]
[ROW][C]40[/C][C]-0.027879[/C][C]-0.3345[/C][C]0.369226[/C][/ROW]
[ROW][C]41[/C][C]-0.047794[/C][C]-0.5735[/C][C]0.28359[/C][/ROW]
[ROW][C]42[/C][C]0.011684[/C][C]0.1402[/C][C]0.444346[/C][/ROW]
[ROW][C]43[/C][C]-0.018699[/C][C]-0.2244[/C][C]0.411387[/C][/ROW]
[ROW][C]44[/C][C]-0.024753[/C][C]-0.297[/C][C]0.383431[/C][/ROW]
[ROW][C]45[/C][C]0.084037[/C][C]1.0084[/C][C]0.157468[/C][/ROW]
[ROW][C]46[/C][C]0.043708[/C][C]0.5245[/C][C]0.300371[/C][/ROW]
[ROW][C]47[/C][C]0.02975[/C][C]0.357[/C][C]0.360809[/C][/ROW]
[ROW][C]48[/C][C]-0.025811[/C][C]-0.3097[/C][C]0.378606[/C][/ROW]
[/TABLE]
Source: https://freestatistics.org/blog/index.php?pk=279291&T=2

Globally Unique Identifier (entire table): ba.freestatistics.org/blog/index.php?pk=279291&T=2

As an alternative you can also use a QR Code:  

The GUIDs for individual cells are displayed in the table below:

Partial Autocorrelation Function
Time lag kPACF(k)T-STATP-value
10.7762399.31490
2-0.118098-1.41720.079296
30.2673753.20850.000822
40.0979191.1750.12096
5-0.108095-1.29710.098328
60.0944451.13330.129477
70.1230171.47620.071037
80.0092650.11120.455817
9-0.067017-0.80420.211302
100.1643061.97170.025282
110.3091493.70980.000148
120.2110242.53230.006202
13-0.744297-8.93160
14-0.075688-0.90830.182629
15-0.00231-0.02770.48896
16-0.066325-0.79590.2137
17-0.023997-0.2880.386894
18-0.026567-0.31880.375168
19-0.085344-1.02410.153745
200.1465851.7590.040349
210.0389880.46790.320296
220.1178591.41430.079714
230.0951311.14160.127764
240.1188381.42610.078009
25-0.073739-0.88490.188853
260.0799980.960.169337
27-0.121093-1.45310.074184
280.0018140.02180.49133
290.0648070.77770.219017
30-0.07287-0.87440.191669
310.0590530.70860.239849
32-0.024457-0.29350.384787
33-0.061164-0.7340.23208
340.0124250.14910.44084
35-0.014378-0.17250.431631
360.0013570.01630.493517
37-0.025903-0.31080.378188
38-0.044216-0.53060.29826
39-0.021772-0.26130.397133
40-0.027879-0.33450.369226
41-0.047794-0.57350.28359
420.0116840.14020.444346
43-0.018699-0.22440.411387
44-0.024753-0.2970.383431
450.0840371.00840.157468
460.0437080.52450.300371
470.029750.3570.360809
48-0.025811-0.30970.378606


Parameters (Session):
par1 = 48 ; par2 = 1 ; par3 = 0 ; par4 = 0 ; par5 = 12 ; par6 = White Noise ; par7 = 0.95 ;
Parameters (R input):
par1 = 48 ; par2 = 1 ; par3 = 0 ; par4 = 0 ; par5 = 12 ; par6 = White Noise ; par7 = 0.95 ; par8 = ;
R code (references can be found in the software module):
if (par1 == 'Default') {
par1 = 10*log10(length(x))
} else {
par1 <- as.numeric(par1)
}
par2 <- as.numeric(par2)
par3 <- as.numeric(par3)
par4 <- as.numeric(par4)
par5 <- as.numeric(par5)
if (par6 == 'White Noise') par6 <- 'white' else par6 <- 'ma'
par7 <- as.numeric(par7)
if (par8 != '') par8 <- as.numeric(par8)
ox <- x
if (par8 == '') {
if (par2 == 0) {
x <- log(x)
} else {
x <- (x ^ par2 - 1) / par2
}
} else {
x <- log(x,base=par8)
}
if (par3 > 0) x <- diff(x,lag=1,difference=par3)
if (par4 > 0) x <- diff(x,lag=par5,difference=par4)
bitmap(file='picts.png')
op <- par(mfrow=c(2,1))
plot(ox,type='l',main='Original Time Series',xlab='time',ylab='value')
if (par8=='') {
mytitle <- paste('Working Time Series (lambda=',par2,', d=',par3,', D=',par4,')',sep='')
mysub <- paste('(lambda=',par2,', d=',par3,', D=',par4,', CI=', par7, ', CI type=',par6,')',sep='')
} else {
mytitle <- paste('Working Time Series (base=',par8,', d=',par3,', D=',par4,')',sep='')
mysub <- paste('(base=',par8,', d=',par3,', D=',par4,', CI=', par7, ', CI type=',par6,')',sep='')
}
plot(x,type='l', main=mytitle,xlab='time',ylab='value')
par(op)
dev.off()
bitmap(file='pic1.png')
racf <- acf(x, par1, main='Autocorrelation', xlab='time lag', ylab='ACF', ci.type=par6, ci=par7, sub=mysub)
dev.off()
bitmap(file='pic2.png')
rpacf <- pacf(x,par1,main='Partial Autocorrelation',xlab='lags',ylab='PACF',sub=mysub)
dev.off()
(myacf <- c(racf$acf))
(mypacf <- c(rpacf$acf))
lengthx <- length(x)
sqrtn <- sqrt(lengthx)
load(file='createtable')
a<-table.start()
a<-table.row.start(a)
a<-table.element(a,'Autocorrelation Function',4,TRUE)
a<-table.row.end(a)
a<-table.row.start(a)
a<-table.element(a,'Time lag k',header=TRUE)
a<-table.element(a,hyperlink('basics.htm','ACF(k)','click here for more information about the Autocorrelation Function'),header=TRUE)
a<-table.element(a,'T-STAT',header=TRUE)
a<-table.element(a,'P-value',header=TRUE)
a<-table.row.end(a)
for (i in 2:(par1+1)) {
a<-table.row.start(a)
a<-table.element(a,i-1,header=TRUE)
a<-table.element(a,round(myacf[i],6))
mytstat <- myacf[i]*sqrtn
a<-table.element(a,round(mytstat,4))
a<-table.element(a,round(1-pt(abs(mytstat),lengthx),6))
a<-table.row.end(a)
}
a<-table.end(a)
table.save(a,file='mytable.tab')
a<-table.start()
a<-table.row.start(a)
a<-table.element(a,'Partial Autocorrelation Function',4,TRUE)
a<-table.row.end(a)
a<-table.row.start(a)
a<-table.element(a,'Time lag k',header=TRUE)
a<-table.element(a,hyperlink('basics.htm','PACF(k)','click here for more information about the Partial Autocorrelation Function'),header=TRUE)
a<-table.element(a,'T-STAT',header=TRUE)
a<-table.element(a,'P-value',header=TRUE)
a<-table.row.end(a)
for (i in 1:par1) {
a<-table.row.start(a)
a<-table.element(a,i,header=TRUE)
a<-table.element(a,round(mypacf[i],6))
mytstat <- mypacf[i]*sqrtn
a<-table.element(a,round(mytstat,4))
a<-table.element(a,round(1-pt(abs(mytstat),lengthx),6))
a<-table.row.end(a)
}
a<-table.end(a)
table.save(a,file='mytable1.tab')