Free Statistics

of Irreproducible Research!

Author's title

Author*Unverified author*
R Software Modulerwasp_smp.wasp
Title produced by softwareStandard Deviation-Mean Plot
Date of computationTue, 19 May 2015 15:31:53 +0100
Cite this page as followsStatistical Computations at FreeStatistics.org, Office for Research Development and Education, URL https://freestatistics.org/blog/index.php?v=date/2015/May/19/t1432045926c4725g8vmgv8wm1.htm/, Retrieved Sun, 05 May 2024 13:57:14 +0000
Statistical Computations at FreeStatistics.org, Office for Research Development and Education, URL https://freestatistics.org/blog/index.php?pk=279128, Retrieved Sun, 05 May 2024 13:57:14 +0000
QR Codes:

Original text written by user:
IsPrivate?No (this computation is public)
User-defined keywords
Estimated Impact172
Family? (F = Feedback message, R = changed R code, M = changed R Module, P = changed Parameters, D = changed Data)
-       [Standard Deviation-Mean Plot] [] [2015-05-19 14:31:53] [76c30f62b7052b57088120e90a652e05] [Current]
Feedback Forum

Post a new message
Dataseries X:
132
41
273
182
188
162
140
186
178
236
202
184
119
16
340
151
240
235
174
309
174
207
209
171
117
10
339
139
186
155
153
222
102
107
188
162
185
24
394
209
248
254
202
258
215
309
240
258
276
48
455
345
311
346
310
297
300
274
292
304
186
14
321
206
160
217
204
246
234
175
364
328
158
40
556
193
221
278
230
253
240
252
228
306
206
48
557
279
399
364
306
471
293
333
316
329
265
61
679
428
394
352
387
590
177
199
203
255
261
115


Summary of computational transaction
Raw Inputview raw input (R code)
Raw Outputview raw output of R engine
Computing time1 seconds
R Server'Gwilym Jenkins' @ jenkins.wessa.net

\begin{tabular}{lllllllll}
\hline
Summary of computational transaction \tabularnewline
Raw Input & view raw input (R code)  \tabularnewline
Raw Output & view raw output of R engine  \tabularnewline
Computing time & 1 seconds \tabularnewline
R Server & 'Gwilym Jenkins' @ jenkins.wessa.net \tabularnewline
\hline
\end{tabular}
%Source: https://freestatistics.org/blog/index.php?pk=279128&T=0

[TABLE]
[ROW][C]Summary of computational transaction[/C][/ROW]
[ROW][C]Raw Input[/C][C]view raw input (R code) [/C][/ROW]
[ROW][C]Raw Output[/C][C]view raw output of R engine [/C][/ROW]
[ROW][C]Computing time[/C][C]1 seconds[/C][/ROW]
[ROW][C]R Server[/C][C]'Gwilym Jenkins' @ jenkins.wessa.net[/C][/ROW]
[/TABLE]
Source: https://freestatistics.org/blog/index.php?pk=279128&T=0

Globally Unique Identifier (entire table): ba.freestatistics.org/blog/index.php?pk=279128&T=0

As an alternative you can also use a QR Code:  

The GUIDs for individual cells are displayed in the table below:

Summary of computational transaction
Raw Inputview raw input (R code)
Raw Outputview raw output of R engine
Computing time1 seconds
R Server'Gwilym Jenkins' @ jenkins.wessa.net


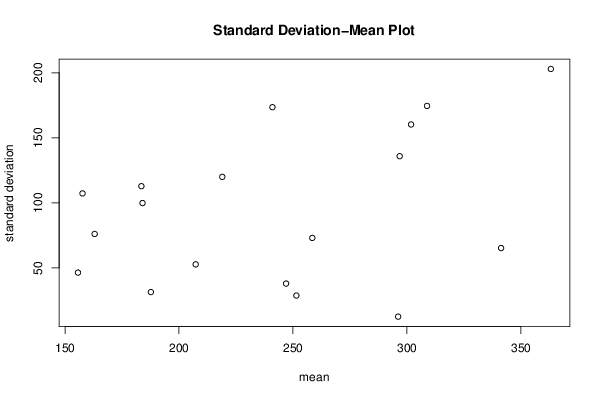
Standard Deviation-Mean Plot
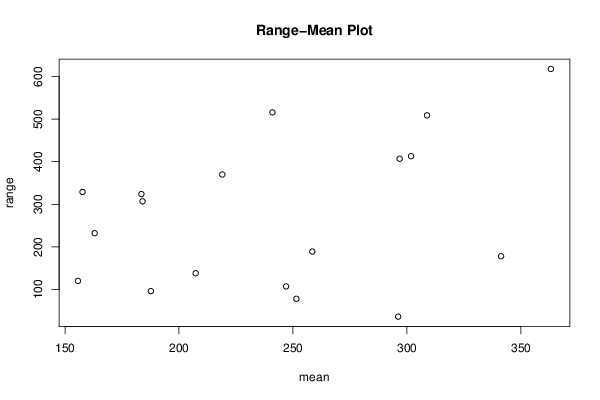
SectionMeanStandard DeviationRange
116376.0683902813777232
2187.66666666666731.379398762032896
3183.5112.791400381412324
4207.33333333333352.6902900605668138
5157.666666666667107.237431275962329
6155.66666666666746.3493976947561120
7219119.976664397707370
824737.9051447695428107
9296.833333333333135.87261190787407
10296.16666666666712.464616587230736
1118499.8218412973834307
12258.573.0198603121096189
13241173.544230673336516
14251.528.703658303428878
15308.833333333333174.504345695649509
16341.33333333333365.209406274453178
17363.166666666667202.963461407877618
18301.833333333333160.257813122065413

\begin{tabular}{lllllllll}
\hline
Standard Deviation-Mean Plot \tabularnewline
Section & Mean & Standard Deviation & Range \tabularnewline
1 & 163 & 76.0683902813777 & 232 \tabularnewline
2 & 187.666666666667 & 31.3793987620328 & 96 \tabularnewline
3 & 183.5 & 112.791400381412 & 324 \tabularnewline
4 & 207.333333333333 & 52.6902900605668 & 138 \tabularnewline
5 & 157.666666666667 & 107.237431275962 & 329 \tabularnewline
6 & 155.666666666667 & 46.3493976947561 & 120 \tabularnewline
7 & 219 & 119.976664397707 & 370 \tabularnewline
8 & 247 & 37.9051447695428 & 107 \tabularnewline
9 & 296.833333333333 & 135.87261190787 & 407 \tabularnewline
10 & 296.166666666667 & 12.4646165872307 & 36 \tabularnewline
11 & 184 & 99.8218412973834 & 307 \tabularnewline
12 & 258.5 & 73.0198603121096 & 189 \tabularnewline
13 & 241 & 173.544230673336 & 516 \tabularnewline
14 & 251.5 & 28.7036583034288 & 78 \tabularnewline
15 & 308.833333333333 & 174.504345695649 & 509 \tabularnewline
16 & 341.333333333333 & 65.209406274453 & 178 \tabularnewline
17 & 363.166666666667 & 202.963461407877 & 618 \tabularnewline
18 & 301.833333333333 & 160.257813122065 & 413 \tabularnewline
\hline
\end{tabular}
%Source: https://freestatistics.org/blog/index.php?pk=279128&T=1

[TABLE]
[ROW][C]Standard Deviation-Mean Plot[/C][/ROW]
[ROW][C]Section[/C][C]Mean[/C][C]Standard Deviation[/C][C]Range[/C][/ROW]
[ROW][C]1[/C][C]163[/C][C]76.0683902813777[/C][C]232[/C][/ROW]
[ROW][C]2[/C][C]187.666666666667[/C][C]31.3793987620328[/C][C]96[/C][/ROW]
[ROW][C]3[/C][C]183.5[/C][C]112.791400381412[/C][C]324[/C][/ROW]
[ROW][C]4[/C][C]207.333333333333[/C][C]52.6902900605668[/C][C]138[/C][/ROW]
[ROW][C]5[/C][C]157.666666666667[/C][C]107.237431275962[/C][C]329[/C][/ROW]
[ROW][C]6[/C][C]155.666666666667[/C][C]46.3493976947561[/C][C]120[/C][/ROW]
[ROW][C]7[/C][C]219[/C][C]119.976664397707[/C][C]370[/C][/ROW]
[ROW][C]8[/C][C]247[/C][C]37.9051447695428[/C][C]107[/C][/ROW]
[ROW][C]9[/C][C]296.833333333333[/C][C]135.87261190787[/C][C]407[/C][/ROW]
[ROW][C]10[/C][C]296.166666666667[/C][C]12.4646165872307[/C][C]36[/C][/ROW]
[ROW][C]11[/C][C]184[/C][C]99.8218412973834[/C][C]307[/C][/ROW]
[ROW][C]12[/C][C]258.5[/C][C]73.0198603121096[/C][C]189[/C][/ROW]
[ROW][C]13[/C][C]241[/C][C]173.544230673336[/C][C]516[/C][/ROW]
[ROW][C]14[/C][C]251.5[/C][C]28.7036583034288[/C][C]78[/C][/ROW]
[ROW][C]15[/C][C]308.833333333333[/C][C]174.504345695649[/C][C]509[/C][/ROW]
[ROW][C]16[/C][C]341.333333333333[/C][C]65.209406274453[/C][C]178[/C][/ROW]
[ROW][C]17[/C][C]363.166666666667[/C][C]202.963461407877[/C][C]618[/C][/ROW]
[ROW][C]18[/C][C]301.833333333333[/C][C]160.257813122065[/C][C]413[/C][/ROW]
[/TABLE]
Source: https://freestatistics.org/blog/index.php?pk=279128&T=1

Globally Unique Identifier (entire table): ba.freestatistics.org/blog/index.php?pk=279128&T=1

As an alternative you can also use a QR Code:  

The GUIDs for individual cells are displayed in the table below:

Standard Deviation-Mean Plot
SectionMeanStandard DeviationRange
116376.0683902813777232
2187.66666666666731.379398762032896
3183.5112.791400381412324
4207.33333333333352.6902900605668138
5157.666666666667107.237431275962329
6155.66666666666746.3493976947561120
7219119.976664397707370
824737.9051447695428107
9296.833333333333135.87261190787407
10296.16666666666712.464616587230736
1118499.8218412973834307
12258.573.0198603121096189
13241173.544230673336516
14251.528.703658303428878
15308.833333333333174.504345695649509
16341.33333333333365.209406274453178
17363.166666666667202.963461407877618
18301.833333333333160.257813122065413


Regression: S.E.(k) = alpha + beta * Mean(k)
alpha15.2004172593832
beta0.329319993706659
S.D.0.204990350053652
T-STAT1.60651461700742
p-value0.127713611868352

\begin{tabular}{lllllllll}
\hline
Regression: S.E.(k) = alpha + beta * Mean(k) \tabularnewline
alpha & 15.2004172593832 \tabularnewline
beta & 0.329319993706659 \tabularnewline
S.D. & 0.204990350053652 \tabularnewline
T-STAT & 1.60651461700742 \tabularnewline
p-value & 0.127713611868352 \tabularnewline
\hline
\end{tabular}
%Source: https://freestatistics.org/blog/index.php?pk=279128&T=2

[TABLE]
[ROW][C]Regression: S.E.(k) = alpha + beta * Mean(k)[/C][/ROW]
[ROW][C]alpha[/C][C]15.2004172593832[/C][/ROW]
[ROW][C]beta[/C][C]0.329319993706659[/C][/ROW]
[ROW][C]S.D.[/C][C]0.204990350053652[/C][/ROW]
[ROW][C]T-STAT[/C][C]1.60651461700742[/C][/ROW]
[ROW][C]p-value[/C][C]0.127713611868352[/C][/ROW]
[/TABLE]
Source: https://freestatistics.org/blog/index.php?pk=279128&T=2

Globally Unique Identifier (entire table): ba.freestatistics.org/blog/index.php?pk=279128&T=2

As an alternative you can also use a QR Code:  

The GUIDs for individual cells are displayed in the table below:

Regression: S.E.(k) = alpha + beta * Mean(k)
alpha15.2004172593832
beta0.329319993706659
S.D.0.204990350053652
T-STAT1.60651461700742
p-value0.127713611868352


Regression: ln S.E.(k) = alpha + beta * ln Mean(k)
alpha2.00053843303416
beta0.427245250531626
S.D.0.688457973641996
T-STAT0.620582906856995
p-value0.543613448752886
Lambda0.572754749468374

\begin{tabular}{lllllllll}
\hline
Regression: ln S.E.(k) = alpha + beta * ln Mean(k) \tabularnewline
alpha & 2.00053843303416 \tabularnewline
beta & 0.427245250531626 \tabularnewline
S.D. & 0.688457973641996 \tabularnewline
T-STAT & 0.620582906856995 \tabularnewline
p-value & 0.543613448752886 \tabularnewline
Lambda & 0.572754749468374 \tabularnewline
\hline
\end{tabular}
%Source: https://freestatistics.org/blog/index.php?pk=279128&T=3

[TABLE]
[ROW][C]Regression: ln S.E.(k) = alpha + beta * ln Mean(k)[/C][/ROW]
[ROW][C]alpha[/C][C]2.00053843303416[/C][/ROW]
[ROW][C]beta[/C][C]0.427245250531626[/C][/ROW]
[ROW][C]S.D.[/C][C]0.688457973641996[/C][/ROW]
[ROW][C]T-STAT[/C][C]0.620582906856995[/C][/ROW]
[ROW][C]p-value[/C][C]0.543613448752886[/C][/ROW]
[ROW][C]Lambda[/C][C]0.572754749468374[/C][/ROW]
[/TABLE]
Source: https://freestatistics.org/blog/index.php?pk=279128&T=3

Globally Unique Identifier (entire table): ba.freestatistics.org/blog/index.php?pk=279128&T=3

As an alternative you can also use a QR Code:  

The GUIDs for individual cells are displayed in the table below:

Regression: ln S.E.(k) = alpha + beta * ln Mean(k)
alpha2.00053843303416
beta0.427245250531626
S.D.0.688457973641996
T-STAT0.620582906856995
p-value0.543613448752886
Lambda0.572754749468374


Parameters (Session):
par1 = 6 ;
Parameters (R input):
par1 = 6 ;
R code (references can be found in the software module):
par1 <- as.numeric(par1)
(n <- length(x))
(np <- floor(n / par1))
arr <- array(NA,dim=c(par1,np))
j <- 0
k <- 1
for (i in 1:(np*par1))
{
j = j + 1
arr[j,k] <- x[i]
if (j == par1) {
j = 0
k=k+1
}
}
arr
arr.mean <- array(NA,dim=np)
arr.sd <- array(NA,dim=np)
arr.range <- array(NA,dim=np)
for (j in 1:np)
{
arr.mean[j] <- mean(arr[,j],na.rm=TRUE)
arr.sd[j] <- sd(arr[,j],na.rm=TRUE)
arr.range[j] <- max(arr[,j],na.rm=TRUE) - min(arr[,j],na.rm=TRUE)
}
arr.mean
arr.sd
arr.range
(lm1 <- lm(arr.sd~arr.mean))
(lnlm1 <- lm(log(arr.sd)~log(arr.mean)))
(lm2 <- lm(arr.range~arr.mean))
bitmap(file='test1.png')
plot(arr.mean,arr.sd,main='Standard Deviation-Mean Plot',xlab='mean',ylab='standard deviation')
dev.off()
bitmap(file='test2.png')
plot(arr.mean,arr.range,main='Range-Mean Plot',xlab='mean',ylab='range')
dev.off()
load(file='createtable')
a<-table.start()
a<-table.row.start(a)
a<-table.element(a,'Standard Deviation-Mean Plot',4,TRUE)
a<-table.row.end(a)
a<-table.row.start(a)
a<-table.element(a,'Section',header=TRUE)
a<-table.element(a,'Mean',header=TRUE)
a<-table.element(a,'Standard Deviation',header=TRUE)
a<-table.element(a,'Range',header=TRUE)
a<-table.row.end(a)
for (j in 1:np) {
a<-table.row.start(a)
a<-table.element(a,j,header=TRUE)
a<-table.element(a,arr.mean[j])
a<-table.element(a,arr.sd[j] )
a<-table.element(a,arr.range[j] )
a<-table.row.end(a)
}
a<-table.end(a)
table.save(a,file='mytable.tab')
a<-table.start()
a<-table.row.start(a)
a<-table.element(a,'Regression: S.E.(k) = alpha + beta * Mean(k)',2,TRUE)
a<-table.row.end(a)
a<-table.row.start(a)
a<-table.element(a,'alpha',header=TRUE)
a<-table.element(a,lm1$coefficients[[1]])
a<-table.row.end(a)
a<-table.row.start(a)
a<-table.element(a,'beta',header=TRUE)
a<-table.element(a,lm1$coefficients[[2]])
a<-table.row.end(a)
a<-table.row.start(a)
a<-table.element(a,'S.D.',header=TRUE)
a<-table.element(a,summary(lm1)$coefficients[2,2])
a<-table.row.end(a)
a<-table.row.start(a)
a<-table.element(a,'T-STAT',header=TRUE)
a<-table.element(a,summary(lm1)$coefficients[2,3])
a<-table.row.end(a)
a<-table.row.start(a)
a<-table.element(a,'p-value',header=TRUE)
a<-table.element(a,summary(lm1)$coefficients[2,4])
a<-table.row.end(a)
a<-table.end(a)
table.save(a,file='mytable1.tab')
a<-table.start()
a<-table.row.start(a)
a<-table.element(a,'Regression: ln S.E.(k) = alpha + beta * ln Mean(k)',2,TRUE)
a<-table.row.end(a)
a<-table.row.start(a)
a<-table.element(a,'alpha',header=TRUE)
a<-table.element(a,lnlm1$coefficients[[1]])
a<-table.row.end(a)
a<-table.row.start(a)
a<-table.element(a,'beta',header=TRUE)
a<-table.element(a,lnlm1$coefficients[[2]])
a<-table.row.end(a)
a<-table.row.start(a)
a<-table.element(a,'S.D.',header=TRUE)
a<-table.element(a,summary(lnlm1)$coefficients[2,2])
a<-table.row.end(a)
a<-table.row.start(a)
a<-table.element(a,'T-STAT',header=TRUE)
a<-table.element(a,summary(lnlm1)$coefficients[2,3])
a<-table.row.end(a)
a<-table.row.start(a)
a<-table.element(a,'p-value',header=TRUE)
a<-table.element(a,summary(lnlm1)$coefficients[2,4])
a<-table.row.end(a)
a<-table.row.start(a)
a<-table.element(a,'Lambda',header=TRUE)
a<-table.element(a,1-lnlm1$coefficients[[2]])
a<-table.row.end(a)
a<-table.end(a)
table.save(a,file='mytable2.tab')