Free Statistics

of Irreproducible Research!

Author's title

Author*Unverified author*
R Software Modulerwasp_smp.wasp
Title produced by softwareStandard Deviation-Mean Plot
Date of computationMon, 18 May 2015 21:17:37 +0100
Cite this page as followsStatistical Computations at FreeStatistics.org, Office for Research Development and Education, URL https://freestatistics.org/blog/index.php?v=date/2015/May/18/t14319802675x7i1xr2vzy7j8h.htm/, Retrieved Thu, 02 May 2024 03:28:14 +0000
Statistical Computations at FreeStatistics.org, Office for Research Development and Education, URL https://freestatistics.org/blog/index.php?pk=279121, Retrieved Thu, 02 May 2024 03:28:14 +0000
QR Codes:

Original text written by user:
IsPrivate?No (this computation is public)
User-defined keywords
Estimated Impact134
Family? (F = Feedback message, R = changed R code, M = changed R Module, P = changed Parameters, D = changed Data)
-       [Standard Deviation-Mean Plot] [] [2015-05-18 20:17:37] [d95fe07e11cd60b998b93c9c7758de3b] [Current]
Feedback Forum

Post a new message
Dataseries X:
81
85
90
84
94
131
130
99
101
82
90
85
105
110
115
110
114
149
147
113
113
107
109
103
113
112
114
106
107
134
135
105
105
90
92
83
95
98
95
81
83
106
114
80
82
76
78
70
82
86
87
74
79
110
117
82
71
67
66
57
71
77
76
69
74
101
105
73
68
65
70
65
80
92
93
90
96
125
134
100
97
97
101
90
108
113
112
103
103
125
128
91
84
83
83
69
77
83
78
70
75
101
117
80
87
81
78
73
93
105
102
97
100
127
138
107
107
106
109
107
129
138
137
134
134
166
180
131
135
127
121
116


Summary of computational transaction
Raw Inputview raw input (R code)
Raw Outputview raw output of R engine
Computing time1 seconds
R Server'George Udny Yule' @ yule.wessa.net

\begin{tabular}{lllllllll}
\hline
Summary of computational transaction \tabularnewline
Raw Input & view raw input (R code)  \tabularnewline
Raw Output & view raw output of R engine  \tabularnewline
Computing time & 1 seconds \tabularnewline
R Server & 'George Udny Yule' @ yule.wessa.net \tabularnewline
\hline
\end{tabular}
%Source: https://freestatistics.org/blog/index.php?pk=279121&T=0

[TABLE]
[ROW][C]Summary of computational transaction[/C][/ROW]
[ROW][C]Raw Input[/C][C]view raw input (R code) [/C][/ROW]
[ROW][C]Raw Output[/C][C]view raw output of R engine [/C][/ROW]
[ROW][C]Computing time[/C][C]1 seconds[/C][/ROW]
[ROW][C]R Server[/C][C]'George Udny Yule' @ yule.wessa.net[/C][/ROW]
[/TABLE]
Source: https://freestatistics.org/blog/index.php?pk=279121&T=0

Globally Unique Identifier (entire table): ba.freestatistics.org/blog/index.php?pk=279121&T=0

As an alternative you can also use a QR Code:  

The GUIDs for individual cells are displayed in the table below:

Summary of computational transaction
Raw Inputview raw input (R code)
Raw Outputview raw output of R engine
Computing time1 seconds
R Server'George Udny Yule' @ yule.wessa.net


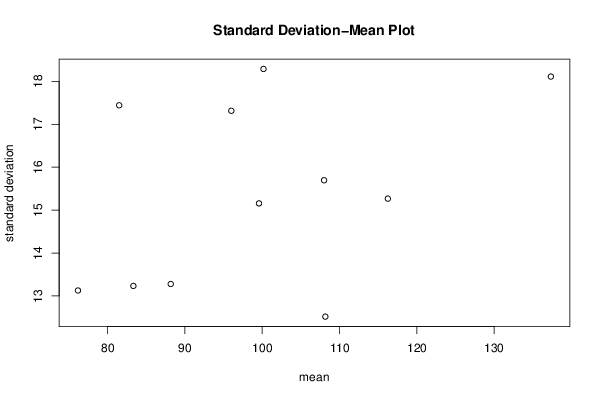
Standard Deviation-Mean Plot
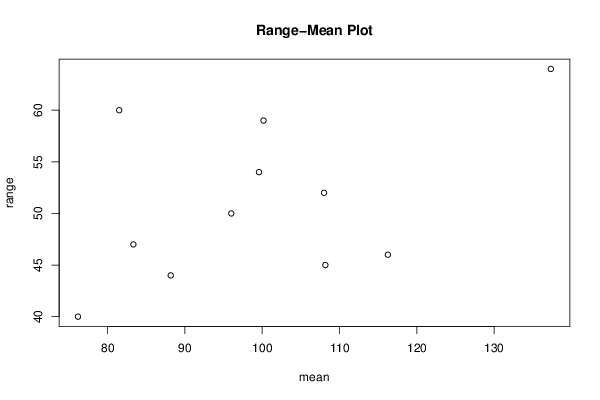
SectionMeanStandard DeviationRange
19617.315258641388650
2116.2515.268059351588746
310815.695975164469352
488.166666666666713.279056191361444
581.517.443415011766760
676.166666666666713.127579111676840
799.583333333333315.156506753526654
8100.16666666666718.289755370566159
983.333333333333313.234482050745947
10108.16666666666712.517866020091845
11137.33333333333318.112443403931164

\begin{tabular}{lllllllll}
\hline
Standard Deviation-Mean Plot \tabularnewline
Section & Mean & Standard Deviation & Range \tabularnewline
1 & 96 & 17.3152586413886 & 50 \tabularnewline
2 & 116.25 & 15.2680593515887 & 46 \tabularnewline
3 & 108 & 15.6959751644693 & 52 \tabularnewline
4 & 88.1666666666667 & 13.2790561913614 & 44 \tabularnewline
5 & 81.5 & 17.4434150117667 & 60 \tabularnewline
6 & 76.1666666666667 & 13.1275791116768 & 40 \tabularnewline
7 & 99.5833333333333 & 15.1565067535266 & 54 \tabularnewline
8 & 100.166666666667 & 18.2897553705661 & 59 \tabularnewline
9 & 83.3333333333333 & 13.2344820507459 & 47 \tabularnewline
10 & 108.166666666667 & 12.5178660200918 & 45 \tabularnewline
11 & 137.333333333333 & 18.1124434039311 & 64 \tabularnewline
\hline
\end{tabular}
%Source: https://freestatistics.org/blog/index.php?pk=279121&T=1

[TABLE]
[ROW][C]Standard Deviation-Mean Plot[/C][/ROW]
[ROW][C]Section[/C][C]Mean[/C][C]Standard Deviation[/C][C]Range[/C][/ROW]
[ROW][C]1[/C][C]96[/C][C]17.3152586413886[/C][C]50[/C][/ROW]
[ROW][C]2[/C][C]116.25[/C][C]15.2680593515887[/C][C]46[/C][/ROW]
[ROW][C]3[/C][C]108[/C][C]15.6959751644693[/C][C]52[/C][/ROW]
[ROW][C]4[/C][C]88.1666666666667[/C][C]13.2790561913614[/C][C]44[/C][/ROW]
[ROW][C]5[/C][C]81.5[/C][C]17.4434150117667[/C][C]60[/C][/ROW]
[ROW][C]6[/C][C]76.1666666666667[/C][C]13.1275791116768[/C][C]40[/C][/ROW]
[ROW][C]7[/C][C]99.5833333333333[/C][C]15.1565067535266[/C][C]54[/C][/ROW]
[ROW][C]8[/C][C]100.166666666667[/C][C]18.2897553705661[/C][C]59[/C][/ROW]
[ROW][C]9[/C][C]83.3333333333333[/C][C]13.2344820507459[/C][C]47[/C][/ROW]
[ROW][C]10[/C][C]108.166666666667[/C][C]12.5178660200918[/C][C]45[/C][/ROW]
[ROW][C]11[/C][C]137.333333333333[/C][C]18.1124434039311[/C][C]64[/C][/ROW]
[/TABLE]
Source: https://freestatistics.org/blog/index.php?pk=279121&T=1

Globally Unique Identifier (entire table): ba.freestatistics.org/blog/index.php?pk=279121&T=1

As an alternative you can also use a QR Code:  

The GUIDs for individual cells are displayed in the table below:

Standard Deviation-Mean Plot
SectionMeanStandard DeviationRange
19617.315258641388650
2116.2515.268059351588746
310815.695975164469352
488.166666666666713.279056191361444
581.517.443415011766760
676.166666666666713.127579111676840
799.583333333333315.156506753526654
8100.16666666666718.289755370566159
983.333333333333313.234482050745947
10108.16666666666712.517866020091845
11137.33333333333318.112443403931164


Regression: S.E.(k) = alpha + beta * Mean(k)
alpha10.6845738035135
beta0.0474209061197912
S.D.0.0373664397756705
T-STAT1.26907745036677
p-value0.236249370969696

\begin{tabular}{lllllllll}
\hline
Regression: S.E.(k) = alpha + beta * Mean(k) \tabularnewline
alpha & 10.6845738035135 \tabularnewline
beta & 0.0474209061197912 \tabularnewline
S.D. & 0.0373664397756705 \tabularnewline
T-STAT & 1.26907745036677 \tabularnewline
p-value & 0.236249370969696 \tabularnewline
\hline
\end{tabular}
%Source: https://freestatistics.org/blog/index.php?pk=279121&T=2

[TABLE]
[ROW][C]Regression: S.E.(k) = alpha + beta * Mean(k)[/C][/ROW]
[ROW][C]alpha[/C][C]10.6845738035135[/C][/ROW]
[ROW][C]beta[/C][C]0.0474209061197912[/C][/ROW]
[ROW][C]S.D.[/C][C]0.0373664397756705[/C][/ROW]
[ROW][C]T-STAT[/C][C]1.26907745036677[/C][/ROW]
[ROW][C]p-value[/C][C]0.236249370969696[/C][/ROW]
[/TABLE]
Source: https://freestatistics.org/blog/index.php?pk=279121&T=2

Globally Unique Identifier (entire table): ba.freestatistics.org/blog/index.php?pk=279121&T=2

As an alternative you can also use a QR Code:  

The GUIDs for individual cells are displayed in the table below:

Regression: S.E.(k) = alpha + beta * Mean(k)
alpha10.6845738035135
beta0.0474209061197912
S.D.0.0373664397756705
T-STAT1.26907745036677
p-value0.236249370969696


Regression: ln S.E.(k) = alpha + beta * ln Mean(k)
alpha1.2894908244314
beta0.313122486475977
S.D.0.250964325577615
T-STAT1.24767727745886
p-value0.243635000043068
Lambda0.686877513524023

\begin{tabular}{lllllllll}
\hline
Regression: ln S.E.(k) = alpha + beta * ln Mean(k) \tabularnewline
alpha & 1.2894908244314 \tabularnewline
beta & 0.313122486475977 \tabularnewline
S.D. & 0.250964325577615 \tabularnewline
T-STAT & 1.24767727745886 \tabularnewline
p-value & 0.243635000043068 \tabularnewline
Lambda & 0.686877513524023 \tabularnewline
\hline
\end{tabular}
%Source: https://freestatistics.org/blog/index.php?pk=279121&T=3

[TABLE]
[ROW][C]Regression: ln S.E.(k) = alpha + beta * ln Mean(k)[/C][/ROW]
[ROW][C]alpha[/C][C]1.2894908244314[/C][/ROW]
[ROW][C]beta[/C][C]0.313122486475977[/C][/ROW]
[ROW][C]S.D.[/C][C]0.250964325577615[/C][/ROW]
[ROW][C]T-STAT[/C][C]1.24767727745886[/C][/ROW]
[ROW][C]p-value[/C][C]0.243635000043068[/C][/ROW]
[ROW][C]Lambda[/C][C]0.686877513524023[/C][/ROW]
[/TABLE]
Source: https://freestatistics.org/blog/index.php?pk=279121&T=3

Globally Unique Identifier (entire table): ba.freestatistics.org/blog/index.php?pk=279121&T=3

As an alternative you can also use a QR Code:  

The GUIDs for individual cells are displayed in the table below:

Regression: ln S.E.(k) = alpha + beta * ln Mean(k)
alpha1.2894908244314
beta0.313122486475977
S.D.0.250964325577615
T-STAT1.24767727745886
p-value0.243635000043068
Lambda0.686877513524023


Parameters (Session):
par1 = 12 ;
Parameters (R input):
par1 = 12 ;
R code (references can be found in the software module):
par1 <- as.numeric(par1)
(n <- length(x))
(np <- floor(n / par1))
arr <- array(NA,dim=c(par1,np))
j <- 0
k <- 1
for (i in 1:(np*par1))
{
j = j + 1
arr[j,k] <- x[i]
if (j == par1) {
j = 0
k=k+1
}
}
arr
arr.mean <- array(NA,dim=np)
arr.sd <- array(NA,dim=np)
arr.range <- array(NA,dim=np)
for (j in 1:np)
{
arr.mean[j] <- mean(arr[,j],na.rm=TRUE)
arr.sd[j] <- sd(arr[,j],na.rm=TRUE)
arr.range[j] <- max(arr[,j],na.rm=TRUE) - min(arr[,j],na.rm=TRUE)
}
arr.mean
arr.sd
arr.range
(lm1 <- lm(arr.sd~arr.mean))
(lnlm1 <- lm(log(arr.sd)~log(arr.mean)))
(lm2 <- lm(arr.range~arr.mean))
bitmap(file='test1.png')
plot(arr.mean,arr.sd,main='Standard Deviation-Mean Plot',xlab='mean',ylab='standard deviation')
dev.off()
bitmap(file='test2.png')
plot(arr.mean,arr.range,main='Range-Mean Plot',xlab='mean',ylab='range')
dev.off()
load(file='createtable')
a<-table.start()
a<-table.row.start(a)
a<-table.element(a,'Standard Deviation-Mean Plot',4,TRUE)
a<-table.row.end(a)
a<-table.row.start(a)
a<-table.element(a,'Section',header=TRUE)
a<-table.element(a,'Mean',header=TRUE)
a<-table.element(a,'Standard Deviation',header=TRUE)
a<-table.element(a,'Range',header=TRUE)
a<-table.row.end(a)
for (j in 1:np) {
a<-table.row.start(a)
a<-table.element(a,j,header=TRUE)
a<-table.element(a,arr.mean[j])
a<-table.element(a,arr.sd[j] )
a<-table.element(a,arr.range[j] )
a<-table.row.end(a)
}
a<-table.end(a)
table.save(a,file='mytable.tab')
a<-table.start()
a<-table.row.start(a)
a<-table.element(a,'Regression: S.E.(k) = alpha + beta * Mean(k)',2,TRUE)
a<-table.row.end(a)
a<-table.row.start(a)
a<-table.element(a,'alpha',header=TRUE)
a<-table.element(a,lm1$coefficients[[1]])
a<-table.row.end(a)
a<-table.row.start(a)
a<-table.element(a,'beta',header=TRUE)
a<-table.element(a,lm1$coefficients[[2]])
a<-table.row.end(a)
a<-table.row.start(a)
a<-table.element(a,'S.D.',header=TRUE)
a<-table.element(a,summary(lm1)$coefficients[2,2])
a<-table.row.end(a)
a<-table.row.start(a)
a<-table.element(a,'T-STAT',header=TRUE)
a<-table.element(a,summary(lm1)$coefficients[2,3])
a<-table.row.end(a)
a<-table.row.start(a)
a<-table.element(a,'p-value',header=TRUE)
a<-table.element(a,summary(lm1)$coefficients[2,4])
a<-table.row.end(a)
a<-table.end(a)
table.save(a,file='mytable1.tab')
a<-table.start()
a<-table.row.start(a)
a<-table.element(a,'Regression: ln S.E.(k) = alpha + beta * ln Mean(k)',2,TRUE)
a<-table.row.end(a)
a<-table.row.start(a)
a<-table.element(a,'alpha',header=TRUE)
a<-table.element(a,lnlm1$coefficients[[1]])
a<-table.row.end(a)
a<-table.row.start(a)
a<-table.element(a,'beta',header=TRUE)
a<-table.element(a,lnlm1$coefficients[[2]])
a<-table.row.end(a)
a<-table.row.start(a)
a<-table.element(a,'S.D.',header=TRUE)
a<-table.element(a,summary(lnlm1)$coefficients[2,2])
a<-table.row.end(a)
a<-table.row.start(a)
a<-table.element(a,'T-STAT',header=TRUE)
a<-table.element(a,summary(lnlm1)$coefficients[2,3])
a<-table.row.end(a)
a<-table.row.start(a)
a<-table.element(a,'p-value',header=TRUE)
a<-table.element(a,summary(lnlm1)$coefficients[2,4])
a<-table.row.end(a)
a<-table.row.start(a)
a<-table.element(a,'Lambda',header=TRUE)
a<-table.element(a,1-lnlm1$coefficients[[2]])
a<-table.row.end(a)
a<-table.end(a)
table.save(a,file='mytable2.tab')