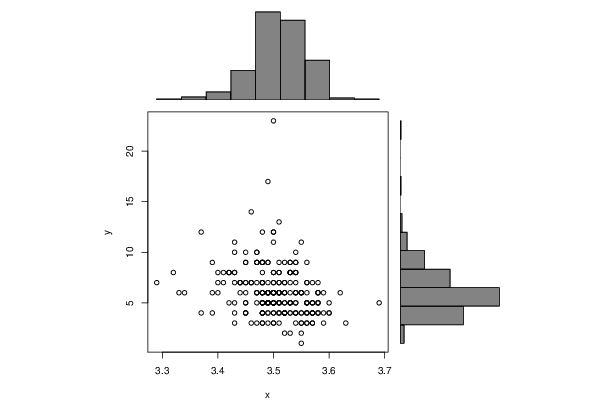
| Pearson Product Moment Correlation - Ungrouped Data | ||
| Statistic | Variable X | Variable Y |
| Mean | 3.50311740890688 | 6.08097165991903 |
| Biased Variance | 0.00298663803701093 | 6.31733022996607 |
| Biased Standard Deviation | 0.0546501421499609 | 2.51342997315741 |
| Covariance | -0.0350095454395839 | |
| Correlation | -0.253843788076435 | |
| Determination | 0.0644366687449941 | |
| T-Test | -4.107834957736 | |
| p-value (2 sided) | 5.44794492276262e-05 | |
| p-value (1 sided) | 2.72397246138131e-05 | |
| Degrees of Freedom | 245 | |
| Number of Observations | 247 | |
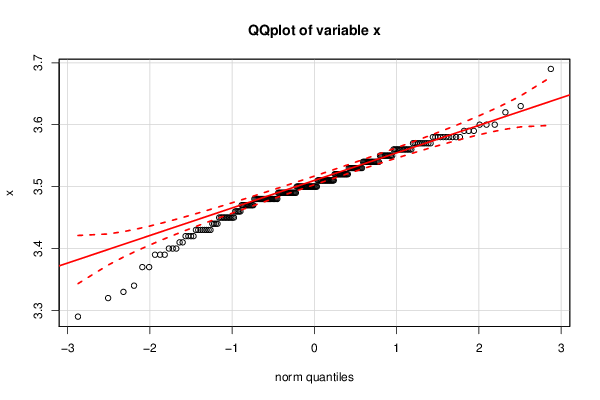
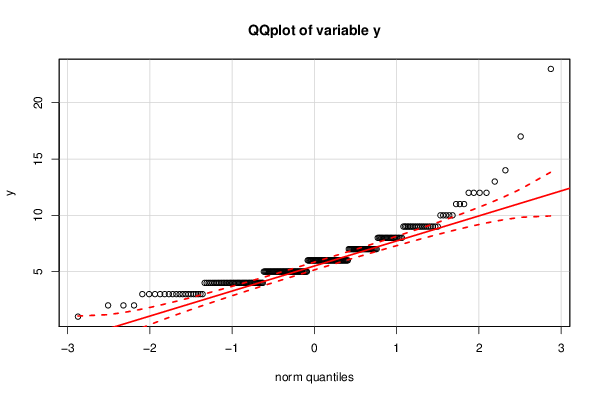
| Normality Tests |
> jarque.x Jarque-Bera Normality Test data: x JB = 34.4365, p-value = 3.328e-08 alternative hypothesis: greater |
> jarque.y Jarque-Bera Normality Test data: y JB = 951.3736, p-value < 2.2e-16 alternative hypothesis: greater |
> ad.x Anderson-Darling normality test data: x A = 1.6783, p-value = 0.0002575 |
> ad.y Anderson-Darling normality test data: y A = 6.4269, p-value = 8.201e-16 |