Free Statistics

of Irreproducible Research!

Author's title

Author*Unverified author*
R Software Modulerwasp_autocorrelation.wasp
Title produced by software(Partial) Autocorrelation Function
Date of computationThu, 05 Mar 2015 19:54:46 +0000
Cite this page as followsStatistical Computations at FreeStatistics.org, Office for Research Development and Education, URL https://freestatistics.org/blog/index.php?v=date/2015/Mar/05/t1425585318zv4v01jtt9sd5fp.htm/, Retrieved Fri, 17 May 2024 01:42:16 +0000
Statistical Computations at FreeStatistics.org, Office for Research Development and Education, URL https://freestatistics.org/blog/index.php?pk=278006, Retrieved Fri, 17 May 2024 01:42:16 +0000
QR Codes:

Original text written by user:
IsPrivate?No (this computation is public)
User-defined keywords
Estimated Impact58
Family? (F = Feedback message, R = changed R code, M = changed R Module, P = changed Parameters, D = changed Data)
-       [(Partial) Autocorrelation Function] [Inflatie Europese...] [2015-03-05 19:54:46] [c5b33e4153b13210102bee47a487e864] [Current]
Feedback Forum

Post a new message
Dataseries X:
100,64
100,93
101,41
102,07
102,42
102,53
102,43
102,6
102,65
102,74
102,82
103,2
102,75
103,09
103,71
104,3
104,58
104,71
104,44
104,57
104,95
105,49
106,03
106,48
106,25
106,7
107,6
108,05
108,72
109,17
109,08
109,04
109,34
109,37
108,96
108,77
108,11
108,67
109,05
109,43
109,62
109,85
109,34
109,65
109,69
109,91
110,09
110,44
109,9
110,25
111,26
111,74
111,91
111,95
111,63
111,85
112,16
112,49
112,66
113,39
112,92
113,44
114,68
115,38
115,48
115,41
114,92
115,16
115,89
116,25
116,43
116,83
116,17
116,78
117,98
118,53
118,43
118,29
117,85
118,27
119
119,33
119,17
119,57
118,62
119,09
120,19
120,17
120,29
120,35
119,88
120,04
120,52
120,43
120,34
120,75


Summary of computational transaction
Raw Inputview raw input (R code)
Raw Outputview raw output of R engine
Computing time1 seconds
R Server'Gwilym Jenkins' @ jenkins.wessa.net

\begin{tabular}{lllllllll}
\hline
Summary of computational transaction \tabularnewline
Raw Input & view raw input (R code)  \tabularnewline
Raw Output & view raw output of R engine  \tabularnewline
Computing time & 1 seconds \tabularnewline
R Server & 'Gwilym Jenkins' @ jenkins.wessa.net \tabularnewline
\hline
\end{tabular}
%Source: https://freestatistics.org/blog/index.php?pk=278006&T=0

[TABLE]
[ROW][C]Summary of computational transaction[/C][/ROW]
[ROW][C]Raw Input[/C][C]view raw input (R code) [/C][/ROW]
[ROW][C]Raw Output[/C][C]view raw output of R engine [/C][/ROW]
[ROW][C]Computing time[/C][C]1 seconds[/C][/ROW]
[ROW][C]R Server[/C][C]'Gwilym Jenkins' @ jenkins.wessa.net[/C][/ROW]
[/TABLE]
Source: https://freestatistics.org/blog/index.php?pk=278006&T=0

Globally Unique Identifier (entire table): ba.freestatistics.org/blog/index.php?pk=278006&T=0

As an alternative you can also use a QR Code:  

The GUIDs for individual cells are displayed in the table below:

Summary of computational transaction
Raw Inputview raw input (R code)
Raw Outputview raw output of R engine
Computing time1 seconds
R Server'Gwilym Jenkins' @ jenkins.wessa.net


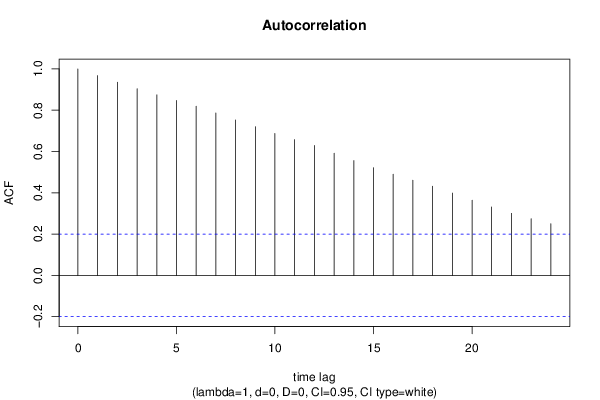
Autocorrelation Function
Time lag kACF(k)T-STATP-value
10.9675879.48040
20.9354299.16530
30.9043258.86050
40.8746248.56950
50.8472128.3010
60.8194788.02920
70.7864857.7060
80.7531227.37910
90.7203937.05840
100.6875656.73670
110.6577746.44480
120.628966.16250
130.5918625.7990
140.555775.44540
150.5213815.10851e-06
160.4895484.79663e-06
170.4604964.51199e-06
180.4319544.23232.6e-05
190.3983563.90318.8e-05
200.3640883.56730.000282
210.3309293.24240.000815
220.3005262.94450.002029
230.2744772.68930.004222
240.2502912.45230.008

\begin{tabular}{lllllllll}
\hline
Autocorrelation Function \tabularnewline
Time lag k & ACF(k) & T-STAT & P-value \tabularnewline
1 & 0.967587 & 9.4804 & 0 \tabularnewline
2 & 0.935429 & 9.1653 & 0 \tabularnewline
3 & 0.904325 & 8.8605 & 0 \tabularnewline
4 & 0.874624 & 8.5695 & 0 \tabularnewline
5 & 0.847212 & 8.301 & 0 \tabularnewline
6 & 0.819478 & 8.0292 & 0 \tabularnewline
7 & 0.786485 & 7.706 & 0 \tabularnewline
8 & 0.753122 & 7.3791 & 0 \tabularnewline
9 & 0.720393 & 7.0584 & 0 \tabularnewline
10 & 0.687565 & 6.7367 & 0 \tabularnewline
11 & 0.657774 & 6.4448 & 0 \tabularnewline
12 & 0.62896 & 6.1625 & 0 \tabularnewline
13 & 0.591862 & 5.799 & 0 \tabularnewline
14 & 0.55577 & 5.4454 & 0 \tabularnewline
15 & 0.521381 & 5.1085 & 1e-06 \tabularnewline
16 & 0.489548 & 4.7966 & 3e-06 \tabularnewline
17 & 0.460496 & 4.5119 & 9e-06 \tabularnewline
18 & 0.431954 & 4.2323 & 2.6e-05 \tabularnewline
19 & 0.398356 & 3.9031 & 8.8e-05 \tabularnewline
20 & 0.364088 & 3.5673 & 0.000282 \tabularnewline
21 & 0.330929 & 3.2424 & 0.000815 \tabularnewline
22 & 0.300526 & 2.9445 & 0.002029 \tabularnewline
23 & 0.274477 & 2.6893 & 0.004222 \tabularnewline
24 & 0.250291 & 2.4523 & 0.008 \tabularnewline
\hline
\end{tabular}
%Source: https://freestatistics.org/blog/index.php?pk=278006&T=1

[TABLE]
[ROW][C]Autocorrelation Function[/C][/ROW]
[ROW][C]Time lag k[/C][C]ACF(k)[/C][C]T-STAT[/C][C]P-value[/C][/ROW]
[ROW][C]1[/C][C]0.967587[/C][C]9.4804[/C][C]0[/C][/ROW]
[ROW][C]2[/C][C]0.935429[/C][C]9.1653[/C][C]0[/C][/ROW]
[ROW][C]3[/C][C]0.904325[/C][C]8.8605[/C][C]0[/C][/ROW]
[ROW][C]4[/C][C]0.874624[/C][C]8.5695[/C][C]0[/C][/ROW]
[ROW][C]5[/C][C]0.847212[/C][C]8.301[/C][C]0[/C][/ROW]
[ROW][C]6[/C][C]0.819478[/C][C]8.0292[/C][C]0[/C][/ROW]
[ROW][C]7[/C][C]0.786485[/C][C]7.706[/C][C]0[/C][/ROW]
[ROW][C]8[/C][C]0.753122[/C][C]7.3791[/C][C]0[/C][/ROW]
[ROW][C]9[/C][C]0.720393[/C][C]7.0584[/C][C]0[/C][/ROW]
[ROW][C]10[/C][C]0.687565[/C][C]6.7367[/C][C]0[/C][/ROW]
[ROW][C]11[/C][C]0.657774[/C][C]6.4448[/C][C]0[/C][/ROW]
[ROW][C]12[/C][C]0.62896[/C][C]6.1625[/C][C]0[/C][/ROW]
[ROW][C]13[/C][C]0.591862[/C][C]5.799[/C][C]0[/C][/ROW]
[ROW][C]14[/C][C]0.55577[/C][C]5.4454[/C][C]0[/C][/ROW]
[ROW][C]15[/C][C]0.521381[/C][C]5.1085[/C][C]1e-06[/C][/ROW]
[ROW][C]16[/C][C]0.489548[/C][C]4.7966[/C][C]3e-06[/C][/ROW]
[ROW][C]17[/C][C]0.460496[/C][C]4.5119[/C][C]9e-06[/C][/ROW]
[ROW][C]18[/C][C]0.431954[/C][C]4.2323[/C][C]2.6e-05[/C][/ROW]
[ROW][C]19[/C][C]0.398356[/C][C]3.9031[/C][C]8.8e-05[/C][/ROW]
[ROW][C]20[/C][C]0.364088[/C][C]3.5673[/C][C]0.000282[/C][/ROW]
[ROW][C]21[/C][C]0.330929[/C][C]3.2424[/C][C]0.000815[/C][/ROW]
[ROW][C]22[/C][C]0.300526[/C][C]2.9445[/C][C]0.002029[/C][/ROW]
[ROW][C]23[/C][C]0.274477[/C][C]2.6893[/C][C]0.004222[/C][/ROW]
[ROW][C]24[/C][C]0.250291[/C][C]2.4523[/C][C]0.008[/C][/ROW]
[/TABLE]
Source: https://freestatistics.org/blog/index.php?pk=278006&T=1

Globally Unique Identifier (entire table): ba.freestatistics.org/blog/index.php?pk=278006&T=1

As an alternative you can also use a QR Code:  

The GUIDs for individual cells are displayed in the table below:

Autocorrelation Function
Time lag kACF(k)T-STATP-value
10.9675879.48040
20.9354299.16530
30.9043258.86050
40.8746248.56950
50.8472128.3010
60.8194788.02920
70.7864857.7060
80.7531227.37910
90.7203937.05840
100.6875656.73670
110.6577746.44480
120.628966.16250
130.5918625.7990
140.555775.44540
150.5213815.10851e-06
160.4895484.79663e-06
170.4604964.51199e-06
180.4319544.23232.6e-05
190.3983563.90318.8e-05
200.3640883.56730.000282
210.3309293.24240.000815
220.3005262.94450.002029
230.2744772.68930.004222
240.2502912.45230.008


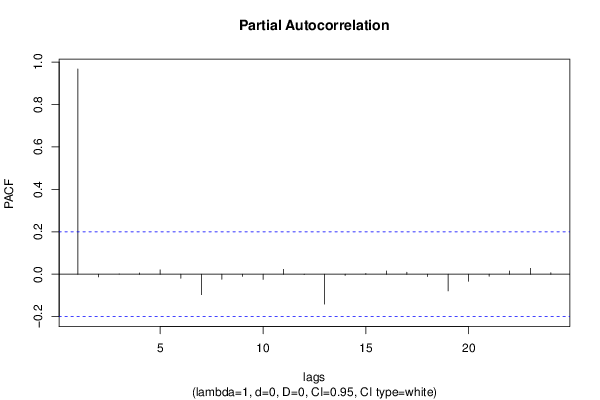
Partial Autocorrelation Function
Time lag kPACF(k)T-STATP-value
10.9675879.48040
2-0.012471-0.12220.451502
3-8.3e-05-8e-040.499676
40.0057990.05680.477405
50.0204570.20040.420782
6-0.019029-0.18640.426245
7-0.096259-0.94310.173989
8-0.023649-0.23170.408626
9-0.010382-0.10170.459595
10-0.024329-0.23840.406049
110.0228750.22410.411568
12-0.001607-0.01570.493735
13-0.140874-1.38030.085353
14-0.005654-0.05540.477968
150.0037910.03710.485223
160.0149570.14650.4419
170.0096720.09480.462351
18-0.010839-0.10620.457824
19-0.07872-0.77130.221212
20-0.032858-0.32190.374099
21-0.009453-0.09260.463201
220.0151910.14880.440997
230.0274390.26880.394312
240.0067040.06570.473882

\begin{tabular}{lllllllll}
\hline
Partial Autocorrelation Function \tabularnewline
Time lag k & PACF(k) & T-STAT & P-value \tabularnewline
1 & 0.967587 & 9.4804 & 0 \tabularnewline
2 & -0.012471 & -0.1222 & 0.451502 \tabularnewline
3 & -8.3e-05 & -8e-04 & 0.499676 \tabularnewline
4 & 0.005799 & 0.0568 & 0.477405 \tabularnewline
5 & 0.020457 & 0.2004 & 0.420782 \tabularnewline
6 & -0.019029 & -0.1864 & 0.426245 \tabularnewline
7 & -0.096259 & -0.9431 & 0.173989 \tabularnewline
8 & -0.023649 & -0.2317 & 0.408626 \tabularnewline
9 & -0.010382 & -0.1017 & 0.459595 \tabularnewline
10 & -0.024329 & -0.2384 & 0.406049 \tabularnewline
11 & 0.022875 & 0.2241 & 0.411568 \tabularnewline
12 & -0.001607 & -0.0157 & 0.493735 \tabularnewline
13 & -0.140874 & -1.3803 & 0.085353 \tabularnewline
14 & -0.005654 & -0.0554 & 0.477968 \tabularnewline
15 & 0.003791 & 0.0371 & 0.485223 \tabularnewline
16 & 0.014957 & 0.1465 & 0.4419 \tabularnewline
17 & 0.009672 & 0.0948 & 0.462351 \tabularnewline
18 & -0.010839 & -0.1062 & 0.457824 \tabularnewline
19 & -0.07872 & -0.7713 & 0.221212 \tabularnewline
20 & -0.032858 & -0.3219 & 0.374099 \tabularnewline
21 & -0.009453 & -0.0926 & 0.463201 \tabularnewline
22 & 0.015191 & 0.1488 & 0.440997 \tabularnewline
23 & 0.027439 & 0.2688 & 0.394312 \tabularnewline
24 & 0.006704 & 0.0657 & 0.473882 \tabularnewline
\hline
\end{tabular}
%Source: https://freestatistics.org/blog/index.php?pk=278006&T=2

[TABLE]
[ROW][C]Partial Autocorrelation Function[/C][/ROW]
[ROW][C]Time lag k[/C][C]PACF(k)[/C][C]T-STAT[/C][C]P-value[/C][/ROW]
[ROW][C]1[/C][C]0.967587[/C][C]9.4804[/C][C]0[/C][/ROW]
[ROW][C]2[/C][C]-0.012471[/C][C]-0.1222[/C][C]0.451502[/C][/ROW]
[ROW][C]3[/C][C]-8.3e-05[/C][C]-8e-04[/C][C]0.499676[/C][/ROW]
[ROW][C]4[/C][C]0.005799[/C][C]0.0568[/C][C]0.477405[/C][/ROW]
[ROW][C]5[/C][C]0.020457[/C][C]0.2004[/C][C]0.420782[/C][/ROW]
[ROW][C]6[/C][C]-0.019029[/C][C]-0.1864[/C][C]0.426245[/C][/ROW]
[ROW][C]7[/C][C]-0.096259[/C][C]-0.9431[/C][C]0.173989[/C][/ROW]
[ROW][C]8[/C][C]-0.023649[/C][C]-0.2317[/C][C]0.408626[/C][/ROW]
[ROW][C]9[/C][C]-0.010382[/C][C]-0.1017[/C][C]0.459595[/C][/ROW]
[ROW][C]10[/C][C]-0.024329[/C][C]-0.2384[/C][C]0.406049[/C][/ROW]
[ROW][C]11[/C][C]0.022875[/C][C]0.2241[/C][C]0.411568[/C][/ROW]
[ROW][C]12[/C][C]-0.001607[/C][C]-0.0157[/C][C]0.493735[/C][/ROW]
[ROW][C]13[/C][C]-0.140874[/C][C]-1.3803[/C][C]0.085353[/C][/ROW]
[ROW][C]14[/C][C]-0.005654[/C][C]-0.0554[/C][C]0.477968[/C][/ROW]
[ROW][C]15[/C][C]0.003791[/C][C]0.0371[/C][C]0.485223[/C][/ROW]
[ROW][C]16[/C][C]0.014957[/C][C]0.1465[/C][C]0.4419[/C][/ROW]
[ROW][C]17[/C][C]0.009672[/C][C]0.0948[/C][C]0.462351[/C][/ROW]
[ROW][C]18[/C][C]-0.010839[/C][C]-0.1062[/C][C]0.457824[/C][/ROW]
[ROW][C]19[/C][C]-0.07872[/C][C]-0.7713[/C][C]0.221212[/C][/ROW]
[ROW][C]20[/C][C]-0.032858[/C][C]-0.3219[/C][C]0.374099[/C][/ROW]
[ROW][C]21[/C][C]-0.009453[/C][C]-0.0926[/C][C]0.463201[/C][/ROW]
[ROW][C]22[/C][C]0.015191[/C][C]0.1488[/C][C]0.440997[/C][/ROW]
[ROW][C]23[/C][C]0.027439[/C][C]0.2688[/C][C]0.394312[/C][/ROW]
[ROW][C]24[/C][C]0.006704[/C][C]0.0657[/C][C]0.473882[/C][/ROW]
[/TABLE]
Source: https://freestatistics.org/blog/index.php?pk=278006&T=2

Globally Unique Identifier (entire table): ba.freestatistics.org/blog/index.php?pk=278006&T=2

As an alternative you can also use a QR Code:  

The GUIDs for individual cells are displayed in the table below:

Partial Autocorrelation Function
Time lag kPACF(k)T-STATP-value
10.9675879.48040
2-0.012471-0.12220.451502
3-8.3e-05-8e-040.499676
40.0057990.05680.477405
50.0204570.20040.420782
6-0.019029-0.18640.426245
7-0.096259-0.94310.173989
8-0.023649-0.23170.408626
9-0.010382-0.10170.459595
10-0.024329-0.23840.406049
110.0228750.22410.411568
12-0.001607-0.01570.493735
13-0.140874-1.38030.085353
14-0.005654-0.05540.477968
150.0037910.03710.485223
160.0149570.14650.4419
170.0096720.09480.462351
18-0.010839-0.10620.457824
19-0.07872-0.77130.221212
20-0.032858-0.32190.374099
21-0.009453-0.09260.463201
220.0151910.14880.440997
230.0274390.26880.394312
240.0067040.06570.473882


Parameters (Session):
par1 = 24 ; par2 = 1 ; par3 = 0 ; par4 = 0 ; par5 = 12 ; par6 = White Noise ; par7 = 0.95 ;
Parameters (R input):
par1 = 24 ; par2 = 1 ; par3 = 0 ; par4 = 0 ; par5 = 12 ; par6 = White Noise ; par7 = 0.95 ; par8 = ;
R code (references can be found in the software module):
if (par1 == 'Default') {
par1 = 10*log10(length(x))
} else {
par1 <- as.numeric(par1)
}
par2 <- as.numeric(par2)
par3 <- as.numeric(par3)
par4 <- as.numeric(par4)
par5 <- as.numeric(par5)
if (par6 == 'White Noise') par6 <- 'white' else par6 <- 'ma'
par7 <- as.numeric(par7)
if (par8 != '') par8 <- as.numeric(par8)
ox <- x
if (par8 == '') {
if (par2 == 0) {
x <- log(x)
} else {
x <- (x ^ par2 - 1) / par2
}
} else {
x <- log(x,base=par8)
}
if (par3 > 0) x <- diff(x,lag=1,difference=par3)
if (par4 > 0) x <- diff(x,lag=par5,difference=par4)
bitmap(file='picts.png')
op <- par(mfrow=c(2,1))
plot(ox,type='l',main='Original Time Series',xlab='time',ylab='value')
if (par8=='') {
mytitle <- paste('Working Time Series (lambda=',par2,', d=',par3,', D=',par4,')',sep='')
mysub <- paste('(lambda=',par2,', d=',par3,', D=',par4,', CI=', par7, ', CI type=',par6,')',sep='')
} else {
mytitle <- paste('Working Time Series (base=',par8,', d=',par3,', D=',par4,')',sep='')
mysub <- paste('(base=',par8,', d=',par3,', D=',par4,', CI=', par7, ', CI type=',par6,')',sep='')
}
plot(x,type='l', main=mytitle,xlab='time',ylab='value')
par(op)
dev.off()
bitmap(file='pic1.png')
racf <- acf(x, par1, main='Autocorrelation', xlab='time lag', ylab='ACF', ci.type=par6, ci=par7, sub=mysub)
dev.off()
bitmap(file='pic2.png')
rpacf <- pacf(x,par1,main='Partial Autocorrelation',xlab='lags',ylab='PACF',sub=mysub)
dev.off()
(myacf <- c(racf$acf))
(mypacf <- c(rpacf$acf))
lengthx <- length(x)
sqrtn <- sqrt(lengthx)
load(file='createtable')
a<-table.start()
a<-table.row.start(a)
a<-table.element(a,'Autocorrelation Function',4,TRUE)
a<-table.row.end(a)
a<-table.row.start(a)
a<-table.element(a,'Time lag k',header=TRUE)
a<-table.element(a,hyperlink('basics.htm','ACF(k)','click here for more information about the Autocorrelation Function'),header=TRUE)
a<-table.element(a,'T-STAT',header=TRUE)
a<-table.element(a,'P-value',header=TRUE)
a<-table.row.end(a)
for (i in 2:(par1+1)) {
a<-table.row.start(a)
a<-table.element(a,i-1,header=TRUE)
a<-table.element(a,round(myacf[i],6))
mytstat <- myacf[i]*sqrtn
a<-table.element(a,round(mytstat,4))
a<-table.element(a,round(1-pt(abs(mytstat),lengthx),6))
a<-table.row.end(a)
}
a<-table.end(a)
table.save(a,file='mytable.tab')
a<-table.start()
a<-table.row.start(a)
a<-table.element(a,'Partial Autocorrelation Function',4,TRUE)
a<-table.row.end(a)
a<-table.row.start(a)
a<-table.element(a,'Time lag k',header=TRUE)
a<-table.element(a,hyperlink('basics.htm','PACF(k)','click here for more information about the Partial Autocorrelation Function'),header=TRUE)
a<-table.element(a,'T-STAT',header=TRUE)
a<-table.element(a,'P-value',header=TRUE)
a<-table.row.end(a)
for (i in 1:par1) {
a<-table.row.start(a)
a<-table.element(a,i,header=TRUE)
a<-table.element(a,round(mypacf[i],6))
mytstat <- mypacf[i]*sqrtn
a<-table.element(a,round(mytstat,4))
a<-table.element(a,round(1-pt(abs(mytstat),lengthx),6))
a<-table.row.end(a)
}
a<-table.end(a)
table.save(a,file='mytable1.tab')