Free Statistics

of Irreproducible Research!

Author's title

Author*Unverified author*
R Software Modulerwasp_autocorrelation.wasp
Title produced by software(Partial) Autocorrelation Function
Date of computationThu, 05 Mar 2015 19:39:45 +0000
Cite this page as followsStatistical Computations at FreeStatistics.org, Office for Research Development and Education, URL https://freestatistics.org/blog/index.php?v=date/2015/Mar/05/t1425584498owtgi2cm1tg6xef.htm/, Retrieved Fri, 17 May 2024 05:02:47 +0000
Statistical Computations at FreeStatistics.org, Office for Research Development and Education, URL https://freestatistics.org/blog/index.php?pk=277999, Retrieved Fri, 17 May 2024 05:02:47 +0000
QR Codes:

Original text written by user:
IsPrivate?No (this computation is public)
User-defined keywords
Estimated Impact83
Family? (F = Feedback message, R = changed R code, M = changed R Module, P = changed Parameters, D = changed Data)
-       [(Partial) Autocorrelation Function] [] [2015-03-05 19:39:45] [bad5dfd772bc354c7f8aa9414b1d4071] [Current]
Feedback Forum

Post a new message
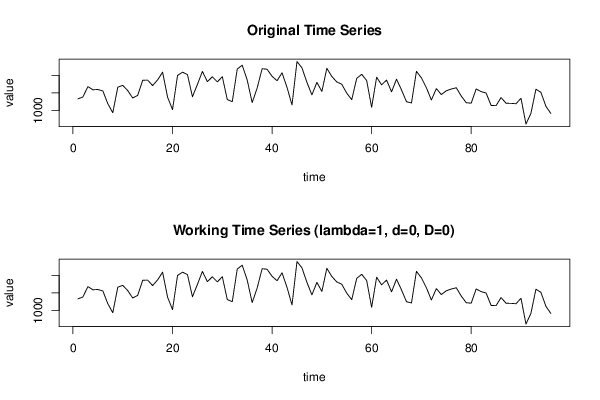
Dataseries X:
1329
1385
1681
1591
1598
1557
1190
932
1664
1717
1567
1355
1430
1863
1868
1711
1873
2095
1379
1021
1999
2094
2026
1390
1744
2117
1823
1963
1816
1966
1309
1250
2184
2295
1870
1222
1640
2194
2179
1976
1850
2077
1658
1156
2400
2218
1802
1444
1804
1541
2206
1972
1815
1749
1492
1307
1916
2035
1855
1086
1951
1733
1868
1532
1894
1586
1247
1212
2119
1931
1649
1296
1625
1454
1562
1612
1648
1412
1219
1207
1614
1537
1497
1141
1135
1368
1203
1201
1190
1347
607
914
1606
1518
1120
910


Summary of computational transaction
Raw Inputview raw input (R code)
Raw Outputview raw output of R engine
Computing time1 seconds
R Server'Sir Maurice George Kendall' @ kendall.wessa.net

\begin{tabular}{lllllllll}
\hline
Summary of computational transaction \tabularnewline
Raw Input & view raw input (R code)  \tabularnewline
Raw Output & view raw output of R engine  \tabularnewline
Computing time & 1 seconds \tabularnewline
R Server & 'Sir Maurice George Kendall' @ kendall.wessa.net \tabularnewline
\hline
\end{tabular}
%Source: https://freestatistics.org/blog/index.php?pk=277999&T=0

[TABLE]
[ROW][C]Summary of computational transaction[/C][/ROW]
[ROW][C]Raw Input[/C][C]view raw input (R code) [/C][/ROW]
[ROW][C]Raw Output[/C][C]view raw output of R engine [/C][/ROW]
[ROW][C]Computing time[/C][C]1 seconds[/C][/ROW]
[ROW][C]R Server[/C][C]'Sir Maurice George Kendall' @ kendall.wessa.net[/C][/ROW]
[/TABLE]
Source: https://freestatistics.org/blog/index.php?pk=277999&T=0

Globally Unique Identifier (entire table): ba.freestatistics.org/blog/index.php?pk=277999&T=0

As an alternative you can also use a QR Code:  

The GUIDs for individual cells are displayed in the table below:

Summary of computational transaction
Raw Inputview raw input (R code)
Raw Outputview raw output of R engine
Computing time1 seconds
R Server'Sir Maurice George Kendall' @ kendall.wessa.net


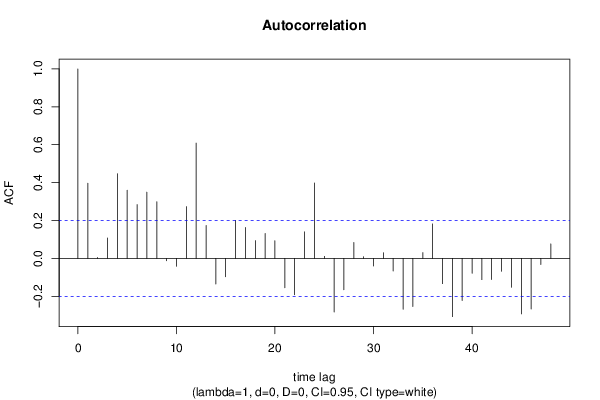
Autocorrelation Function
Time lag kACF(k)T-STATP-value
10.3971593.89139.2e-05
20.0048650.04770.481041
30.1080441.05860.146217
40.4470874.38051.5e-05
50.3594473.52190.000329
60.2840262.78290.003244
70.3497053.42640.000451
80.2992812.93230.002103
9-0.012853-0.12590.450026
10-0.041548-0.40710.342424
110.2734312.67910.004344
120.6084865.96190
130.1737211.70210.045986
14-0.135567-1.32830.093618
15-0.096483-0.94530.173431
160.2006161.96560.026116
170.1627871.5950.057002
180.0939340.92040.179846
190.1317521.29090.09992
200.0934570.91570.181063
21-0.154702-1.51580.066433
22-0.192195-1.88310.031356
230.1402731.37440.08626
240.3978593.89829e-05
250.0108290.10610.457859
26-0.283182-2.77460.003321
27-0.165646-1.6230.053935
280.0843080.8260.205413
290.0086840.08510.466184
30-0.040281-0.39470.346981
310.0298170.29210.385402
32-0.066926-0.65570.25678
33-0.26866-2.63230.004941
34-0.253724-2.4860.007324
350.0305260.29910.38276
360.1820991.78420.038775
37-0.133258-1.30570.097394
38-0.307468-3.01260.001656
39-0.222007-2.17520.016035
40-0.078304-0.76720.222417
41-0.111999-1.09740.137614
42-0.111572-1.09320.138526
43-0.067878-0.66510.2538
44-0.152653-1.49570.069007
45-0.292727-2.86810.002538
46-0.266928-2.61530.005176
47-0.032463-0.31810.37556
480.0765290.74980.227596

\begin{tabular}{lllllllll}
\hline
Autocorrelation Function \tabularnewline
Time lag k & ACF(k) & T-STAT & P-value \tabularnewline
1 & 0.397159 & 3.8913 & 9.2e-05 \tabularnewline
2 & 0.004865 & 0.0477 & 0.481041 \tabularnewline
3 & 0.108044 & 1.0586 & 0.146217 \tabularnewline
4 & 0.447087 & 4.3805 & 1.5e-05 \tabularnewline
5 & 0.359447 & 3.5219 & 0.000329 \tabularnewline
6 & 0.284026 & 2.7829 & 0.003244 \tabularnewline
7 & 0.349705 & 3.4264 & 0.000451 \tabularnewline
8 & 0.299281 & 2.9323 & 0.002103 \tabularnewline
9 & -0.012853 & -0.1259 & 0.450026 \tabularnewline
10 & -0.041548 & -0.4071 & 0.342424 \tabularnewline
11 & 0.273431 & 2.6791 & 0.004344 \tabularnewline
12 & 0.608486 & 5.9619 & 0 \tabularnewline
13 & 0.173721 & 1.7021 & 0.045986 \tabularnewline
14 & -0.135567 & -1.3283 & 0.093618 \tabularnewline
15 & -0.096483 & -0.9453 & 0.173431 \tabularnewline
16 & 0.200616 & 1.9656 & 0.026116 \tabularnewline
17 & 0.162787 & 1.595 & 0.057002 \tabularnewline
18 & 0.093934 & 0.9204 & 0.179846 \tabularnewline
19 & 0.131752 & 1.2909 & 0.09992 \tabularnewline
20 & 0.093457 & 0.9157 & 0.181063 \tabularnewline
21 & -0.154702 & -1.5158 & 0.066433 \tabularnewline
22 & -0.192195 & -1.8831 & 0.031356 \tabularnewline
23 & 0.140273 & 1.3744 & 0.08626 \tabularnewline
24 & 0.397859 & 3.8982 & 9e-05 \tabularnewline
25 & 0.010829 & 0.1061 & 0.457859 \tabularnewline
26 & -0.283182 & -2.7746 & 0.003321 \tabularnewline
27 & -0.165646 & -1.623 & 0.053935 \tabularnewline
28 & 0.084308 & 0.826 & 0.205413 \tabularnewline
29 & 0.008684 & 0.0851 & 0.466184 \tabularnewline
30 & -0.040281 & -0.3947 & 0.346981 \tabularnewline
31 & 0.029817 & 0.2921 & 0.385402 \tabularnewline
32 & -0.066926 & -0.6557 & 0.25678 \tabularnewline
33 & -0.26866 & -2.6323 & 0.004941 \tabularnewline
34 & -0.253724 & -2.486 & 0.007324 \tabularnewline
35 & 0.030526 & 0.2991 & 0.38276 \tabularnewline
36 & 0.182099 & 1.7842 & 0.038775 \tabularnewline
37 & -0.133258 & -1.3057 & 0.097394 \tabularnewline
38 & -0.307468 & -3.0126 & 0.001656 \tabularnewline
39 & -0.222007 & -2.1752 & 0.016035 \tabularnewline
40 & -0.078304 & -0.7672 & 0.222417 \tabularnewline
41 & -0.111999 & -1.0974 & 0.137614 \tabularnewline
42 & -0.111572 & -1.0932 & 0.138526 \tabularnewline
43 & -0.067878 & -0.6651 & 0.2538 \tabularnewline
44 & -0.152653 & -1.4957 & 0.069007 \tabularnewline
45 & -0.292727 & -2.8681 & 0.002538 \tabularnewline
46 & -0.266928 & -2.6153 & 0.005176 \tabularnewline
47 & -0.032463 & -0.3181 & 0.37556 \tabularnewline
48 & 0.076529 & 0.7498 & 0.227596 \tabularnewline
\hline
\end{tabular}
%Source: https://freestatistics.org/blog/index.php?pk=277999&T=1

[TABLE]
[ROW][C]Autocorrelation Function[/C][/ROW]
[ROW][C]Time lag k[/C][C]ACF(k)[/C][C]T-STAT[/C][C]P-value[/C][/ROW]
[ROW][C]1[/C][C]0.397159[/C][C]3.8913[/C][C]9.2e-05[/C][/ROW]
[ROW][C]2[/C][C]0.004865[/C][C]0.0477[/C][C]0.481041[/C][/ROW]
[ROW][C]3[/C][C]0.108044[/C][C]1.0586[/C][C]0.146217[/C][/ROW]
[ROW][C]4[/C][C]0.447087[/C][C]4.3805[/C][C]1.5e-05[/C][/ROW]
[ROW][C]5[/C][C]0.359447[/C][C]3.5219[/C][C]0.000329[/C][/ROW]
[ROW][C]6[/C][C]0.284026[/C][C]2.7829[/C][C]0.003244[/C][/ROW]
[ROW][C]7[/C][C]0.349705[/C][C]3.4264[/C][C]0.000451[/C][/ROW]
[ROW][C]8[/C][C]0.299281[/C][C]2.9323[/C][C]0.002103[/C][/ROW]
[ROW][C]9[/C][C]-0.012853[/C][C]-0.1259[/C][C]0.450026[/C][/ROW]
[ROW][C]10[/C][C]-0.041548[/C][C]-0.4071[/C][C]0.342424[/C][/ROW]
[ROW][C]11[/C][C]0.273431[/C][C]2.6791[/C][C]0.004344[/C][/ROW]
[ROW][C]12[/C][C]0.608486[/C][C]5.9619[/C][C]0[/C][/ROW]
[ROW][C]13[/C][C]0.173721[/C][C]1.7021[/C][C]0.045986[/C][/ROW]
[ROW][C]14[/C][C]-0.135567[/C][C]-1.3283[/C][C]0.093618[/C][/ROW]
[ROW][C]15[/C][C]-0.096483[/C][C]-0.9453[/C][C]0.173431[/C][/ROW]
[ROW][C]16[/C][C]0.200616[/C][C]1.9656[/C][C]0.026116[/C][/ROW]
[ROW][C]17[/C][C]0.162787[/C][C]1.595[/C][C]0.057002[/C][/ROW]
[ROW][C]18[/C][C]0.093934[/C][C]0.9204[/C][C]0.179846[/C][/ROW]
[ROW][C]19[/C][C]0.131752[/C][C]1.2909[/C][C]0.09992[/C][/ROW]
[ROW][C]20[/C][C]0.093457[/C][C]0.9157[/C][C]0.181063[/C][/ROW]
[ROW][C]21[/C][C]-0.154702[/C][C]-1.5158[/C][C]0.066433[/C][/ROW]
[ROW][C]22[/C][C]-0.192195[/C][C]-1.8831[/C][C]0.031356[/C][/ROW]
[ROW][C]23[/C][C]0.140273[/C][C]1.3744[/C][C]0.08626[/C][/ROW]
[ROW][C]24[/C][C]0.397859[/C][C]3.8982[/C][C]9e-05[/C][/ROW]
[ROW][C]25[/C][C]0.010829[/C][C]0.1061[/C][C]0.457859[/C][/ROW]
[ROW][C]26[/C][C]-0.283182[/C][C]-2.7746[/C][C]0.003321[/C][/ROW]
[ROW][C]27[/C][C]-0.165646[/C][C]-1.623[/C][C]0.053935[/C][/ROW]
[ROW][C]28[/C][C]0.084308[/C][C]0.826[/C][C]0.205413[/C][/ROW]
[ROW][C]29[/C][C]0.008684[/C][C]0.0851[/C][C]0.466184[/C][/ROW]
[ROW][C]30[/C][C]-0.040281[/C][C]-0.3947[/C][C]0.346981[/C][/ROW]
[ROW][C]31[/C][C]0.029817[/C][C]0.2921[/C][C]0.385402[/C][/ROW]
[ROW][C]32[/C][C]-0.066926[/C][C]-0.6557[/C][C]0.25678[/C][/ROW]
[ROW][C]33[/C][C]-0.26866[/C][C]-2.6323[/C][C]0.004941[/C][/ROW]
[ROW][C]34[/C][C]-0.253724[/C][C]-2.486[/C][C]0.007324[/C][/ROW]
[ROW][C]35[/C][C]0.030526[/C][C]0.2991[/C][C]0.38276[/C][/ROW]
[ROW][C]36[/C][C]0.182099[/C][C]1.7842[/C][C]0.038775[/C][/ROW]
[ROW][C]37[/C][C]-0.133258[/C][C]-1.3057[/C][C]0.097394[/C][/ROW]
[ROW][C]38[/C][C]-0.307468[/C][C]-3.0126[/C][C]0.001656[/C][/ROW]
[ROW][C]39[/C][C]-0.222007[/C][C]-2.1752[/C][C]0.016035[/C][/ROW]
[ROW][C]40[/C][C]-0.078304[/C][C]-0.7672[/C][C]0.222417[/C][/ROW]
[ROW][C]41[/C][C]-0.111999[/C][C]-1.0974[/C][C]0.137614[/C][/ROW]
[ROW][C]42[/C][C]-0.111572[/C][C]-1.0932[/C][C]0.138526[/C][/ROW]
[ROW][C]43[/C][C]-0.067878[/C][C]-0.6651[/C][C]0.2538[/C][/ROW]
[ROW][C]44[/C][C]-0.152653[/C][C]-1.4957[/C][C]0.069007[/C][/ROW]
[ROW][C]45[/C][C]-0.292727[/C][C]-2.8681[/C][C]0.002538[/C][/ROW]
[ROW][C]46[/C][C]-0.266928[/C][C]-2.6153[/C][C]0.005176[/C][/ROW]
[ROW][C]47[/C][C]-0.032463[/C][C]-0.3181[/C][C]0.37556[/C][/ROW]
[ROW][C]48[/C][C]0.076529[/C][C]0.7498[/C][C]0.227596[/C][/ROW]
[/TABLE]
Source: https://freestatistics.org/blog/index.php?pk=277999&T=1

Globally Unique Identifier (entire table): ba.freestatistics.org/blog/index.php?pk=277999&T=1

As an alternative you can also use a QR Code:  

The GUIDs for individual cells are displayed in the table below:

Autocorrelation Function
Time lag kACF(k)T-STATP-value
10.3971593.89139.2e-05
20.0048650.04770.481041
30.1080441.05860.146217
40.4470874.38051.5e-05
50.3594473.52190.000329
60.2840262.78290.003244
70.3497053.42640.000451
80.2992812.93230.002103
9-0.012853-0.12590.450026
10-0.041548-0.40710.342424
110.2734312.67910.004344
120.6084865.96190
130.1737211.70210.045986
14-0.135567-1.32830.093618
15-0.096483-0.94530.173431
160.2006161.96560.026116
170.1627871.5950.057002
180.0939340.92040.179846
190.1317521.29090.09992
200.0934570.91570.181063
21-0.154702-1.51580.066433
22-0.192195-1.88310.031356
230.1402731.37440.08626
240.3978593.89829e-05
250.0108290.10610.457859
26-0.283182-2.77460.003321
27-0.165646-1.6230.053935
280.0843080.8260.205413
290.0086840.08510.466184
30-0.040281-0.39470.346981
310.0298170.29210.385402
32-0.066926-0.65570.25678
33-0.26866-2.63230.004941
34-0.253724-2.4860.007324
350.0305260.29910.38276
360.1820991.78420.038775
37-0.133258-1.30570.097394
38-0.307468-3.01260.001656
39-0.222007-2.17520.016035
40-0.078304-0.76720.222417
41-0.111999-1.09740.137614
42-0.111572-1.09320.138526
43-0.067878-0.66510.2538
44-0.152653-1.49570.069007
45-0.292727-2.86810.002538
46-0.266928-2.61530.005176
47-0.032463-0.31810.37556
480.0765290.74980.227596


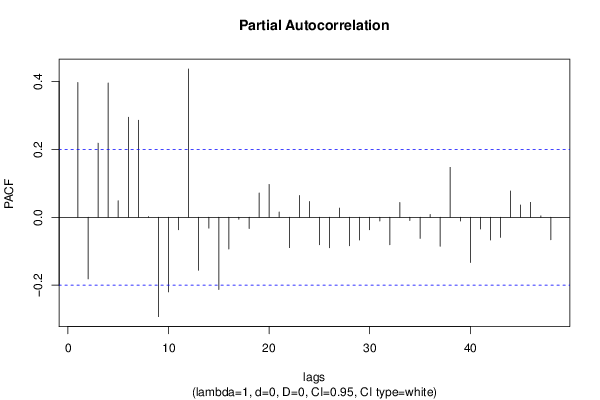
Partial Autocorrelation Function
Time lag kPACF(k)T-STATP-value
10.3971593.89139.2e-05
2-0.1815-1.77830.039258
30.2183442.13930.017473
40.3954823.87499.7e-05
50.0488070.47820.316794
60.2944952.88540.002413
70.2856462.79880.0031
80.0020280.01990.492095
9-0.292654-2.86740.002544
10-0.219713-2.15270.016923
11-0.036533-0.3580.360583
120.4368724.28052.2e-05
13-0.155973-1.52820.064874
14-0.032062-0.31410.377046
15-0.212548-2.08250.019976
16-0.093534-0.91640.180865
17-0.005849-0.05730.477208
18-0.033032-0.32360.373454
190.0714620.70020.242752
200.0968370.94880.172551
210.0157560.15440.438817
22-0.089472-0.87660.191433
230.0642030.62910.265402
240.0467450.4580.323992
25-0.081001-0.79360.21468
26-0.089557-0.87750.191209
270.0269490.2640.396156
28-0.084107-0.82410.205968
29-0.066793-0.65440.257197
30-0.036867-0.36120.359363
31-0.010808-0.10590.457943
32-0.08085-0.79220.215108
330.0433860.42510.33586
34-0.009422-0.09230.463319
35-0.062062-0.60810.272286
360.0083210.08150.467595
37-0.085353-0.83630.202534
380.1469971.44030.076523
39-0.010782-0.10560.458043
40-0.133462-1.30770.097056
41-0.034782-0.34080.367003
42-0.067098-0.65740.256242
43-0.059204-0.58010.281612
440.0776790.76110.224234
450.0361360.35410.362035
460.0440460.43160.333515
470.0042180.04130.483562
48-0.066031-0.6470.259596

\begin{tabular}{lllllllll}
\hline
Partial Autocorrelation Function \tabularnewline
Time lag k & PACF(k) & T-STAT & P-value \tabularnewline
1 & 0.397159 & 3.8913 & 9.2e-05 \tabularnewline
2 & -0.1815 & -1.7783 & 0.039258 \tabularnewline
3 & 0.218344 & 2.1393 & 0.017473 \tabularnewline
4 & 0.395482 & 3.8749 & 9.7e-05 \tabularnewline
5 & 0.048807 & 0.4782 & 0.316794 \tabularnewline
6 & 0.294495 & 2.8854 & 0.002413 \tabularnewline
7 & 0.285646 & 2.7988 & 0.0031 \tabularnewline
8 & 0.002028 & 0.0199 & 0.492095 \tabularnewline
9 & -0.292654 & -2.8674 & 0.002544 \tabularnewline
10 & -0.219713 & -2.1527 & 0.016923 \tabularnewline
11 & -0.036533 & -0.358 & 0.360583 \tabularnewline
12 & 0.436872 & 4.2805 & 2.2e-05 \tabularnewline
13 & -0.155973 & -1.5282 & 0.064874 \tabularnewline
14 & -0.032062 & -0.3141 & 0.377046 \tabularnewline
15 & -0.212548 & -2.0825 & 0.019976 \tabularnewline
16 & -0.093534 & -0.9164 & 0.180865 \tabularnewline
17 & -0.005849 & -0.0573 & 0.477208 \tabularnewline
18 & -0.033032 & -0.3236 & 0.373454 \tabularnewline
19 & 0.071462 & 0.7002 & 0.242752 \tabularnewline
20 & 0.096837 & 0.9488 & 0.172551 \tabularnewline
21 & 0.015756 & 0.1544 & 0.438817 \tabularnewline
22 & -0.089472 & -0.8766 & 0.191433 \tabularnewline
23 & 0.064203 & 0.6291 & 0.265402 \tabularnewline
24 & 0.046745 & 0.458 & 0.323992 \tabularnewline
25 & -0.081001 & -0.7936 & 0.21468 \tabularnewline
26 & -0.089557 & -0.8775 & 0.191209 \tabularnewline
27 & 0.026949 & 0.264 & 0.396156 \tabularnewline
28 & -0.084107 & -0.8241 & 0.205968 \tabularnewline
29 & -0.066793 & -0.6544 & 0.257197 \tabularnewline
30 & -0.036867 & -0.3612 & 0.359363 \tabularnewline
31 & -0.010808 & -0.1059 & 0.457943 \tabularnewline
32 & -0.08085 & -0.7922 & 0.215108 \tabularnewline
33 & 0.043386 & 0.4251 & 0.33586 \tabularnewline
34 & -0.009422 & -0.0923 & 0.463319 \tabularnewline
35 & -0.062062 & -0.6081 & 0.272286 \tabularnewline
36 & 0.008321 & 0.0815 & 0.467595 \tabularnewline
37 & -0.085353 & -0.8363 & 0.202534 \tabularnewline
38 & 0.146997 & 1.4403 & 0.076523 \tabularnewline
39 & -0.010782 & -0.1056 & 0.458043 \tabularnewline
40 & -0.133462 & -1.3077 & 0.097056 \tabularnewline
41 & -0.034782 & -0.3408 & 0.367003 \tabularnewline
42 & -0.067098 & -0.6574 & 0.256242 \tabularnewline
43 & -0.059204 & -0.5801 & 0.281612 \tabularnewline
44 & 0.077679 & 0.7611 & 0.224234 \tabularnewline
45 & 0.036136 & 0.3541 & 0.362035 \tabularnewline
46 & 0.044046 & 0.4316 & 0.333515 \tabularnewline
47 & 0.004218 & 0.0413 & 0.483562 \tabularnewline
48 & -0.066031 & -0.647 & 0.259596 \tabularnewline
\hline
\end{tabular}
%Source: https://freestatistics.org/blog/index.php?pk=277999&T=2

[TABLE]
[ROW][C]Partial Autocorrelation Function[/C][/ROW]
[ROW][C]Time lag k[/C][C]PACF(k)[/C][C]T-STAT[/C][C]P-value[/C][/ROW]
[ROW][C]1[/C][C]0.397159[/C][C]3.8913[/C][C]9.2e-05[/C][/ROW]
[ROW][C]2[/C][C]-0.1815[/C][C]-1.7783[/C][C]0.039258[/C][/ROW]
[ROW][C]3[/C][C]0.218344[/C][C]2.1393[/C][C]0.017473[/C][/ROW]
[ROW][C]4[/C][C]0.395482[/C][C]3.8749[/C][C]9.7e-05[/C][/ROW]
[ROW][C]5[/C][C]0.048807[/C][C]0.4782[/C][C]0.316794[/C][/ROW]
[ROW][C]6[/C][C]0.294495[/C][C]2.8854[/C][C]0.002413[/C][/ROW]
[ROW][C]7[/C][C]0.285646[/C][C]2.7988[/C][C]0.0031[/C][/ROW]
[ROW][C]8[/C][C]0.002028[/C][C]0.0199[/C][C]0.492095[/C][/ROW]
[ROW][C]9[/C][C]-0.292654[/C][C]-2.8674[/C][C]0.002544[/C][/ROW]
[ROW][C]10[/C][C]-0.219713[/C][C]-2.1527[/C][C]0.016923[/C][/ROW]
[ROW][C]11[/C][C]-0.036533[/C][C]-0.358[/C][C]0.360583[/C][/ROW]
[ROW][C]12[/C][C]0.436872[/C][C]4.2805[/C][C]2.2e-05[/C][/ROW]
[ROW][C]13[/C][C]-0.155973[/C][C]-1.5282[/C][C]0.064874[/C][/ROW]
[ROW][C]14[/C][C]-0.032062[/C][C]-0.3141[/C][C]0.377046[/C][/ROW]
[ROW][C]15[/C][C]-0.212548[/C][C]-2.0825[/C][C]0.019976[/C][/ROW]
[ROW][C]16[/C][C]-0.093534[/C][C]-0.9164[/C][C]0.180865[/C][/ROW]
[ROW][C]17[/C][C]-0.005849[/C][C]-0.0573[/C][C]0.477208[/C][/ROW]
[ROW][C]18[/C][C]-0.033032[/C][C]-0.3236[/C][C]0.373454[/C][/ROW]
[ROW][C]19[/C][C]0.071462[/C][C]0.7002[/C][C]0.242752[/C][/ROW]
[ROW][C]20[/C][C]0.096837[/C][C]0.9488[/C][C]0.172551[/C][/ROW]
[ROW][C]21[/C][C]0.015756[/C][C]0.1544[/C][C]0.438817[/C][/ROW]
[ROW][C]22[/C][C]-0.089472[/C][C]-0.8766[/C][C]0.191433[/C][/ROW]
[ROW][C]23[/C][C]0.064203[/C][C]0.6291[/C][C]0.265402[/C][/ROW]
[ROW][C]24[/C][C]0.046745[/C][C]0.458[/C][C]0.323992[/C][/ROW]
[ROW][C]25[/C][C]-0.081001[/C][C]-0.7936[/C][C]0.21468[/C][/ROW]
[ROW][C]26[/C][C]-0.089557[/C][C]-0.8775[/C][C]0.191209[/C][/ROW]
[ROW][C]27[/C][C]0.026949[/C][C]0.264[/C][C]0.396156[/C][/ROW]
[ROW][C]28[/C][C]-0.084107[/C][C]-0.8241[/C][C]0.205968[/C][/ROW]
[ROW][C]29[/C][C]-0.066793[/C][C]-0.6544[/C][C]0.257197[/C][/ROW]
[ROW][C]30[/C][C]-0.036867[/C][C]-0.3612[/C][C]0.359363[/C][/ROW]
[ROW][C]31[/C][C]-0.010808[/C][C]-0.1059[/C][C]0.457943[/C][/ROW]
[ROW][C]32[/C][C]-0.08085[/C][C]-0.7922[/C][C]0.215108[/C][/ROW]
[ROW][C]33[/C][C]0.043386[/C][C]0.4251[/C][C]0.33586[/C][/ROW]
[ROW][C]34[/C][C]-0.009422[/C][C]-0.0923[/C][C]0.463319[/C][/ROW]
[ROW][C]35[/C][C]-0.062062[/C][C]-0.6081[/C][C]0.272286[/C][/ROW]
[ROW][C]36[/C][C]0.008321[/C][C]0.0815[/C][C]0.467595[/C][/ROW]
[ROW][C]37[/C][C]-0.085353[/C][C]-0.8363[/C][C]0.202534[/C][/ROW]
[ROW][C]38[/C][C]0.146997[/C][C]1.4403[/C][C]0.076523[/C][/ROW]
[ROW][C]39[/C][C]-0.010782[/C][C]-0.1056[/C][C]0.458043[/C][/ROW]
[ROW][C]40[/C][C]-0.133462[/C][C]-1.3077[/C][C]0.097056[/C][/ROW]
[ROW][C]41[/C][C]-0.034782[/C][C]-0.3408[/C][C]0.367003[/C][/ROW]
[ROW][C]42[/C][C]-0.067098[/C][C]-0.6574[/C][C]0.256242[/C][/ROW]
[ROW][C]43[/C][C]-0.059204[/C][C]-0.5801[/C][C]0.281612[/C][/ROW]
[ROW][C]44[/C][C]0.077679[/C][C]0.7611[/C][C]0.224234[/C][/ROW]
[ROW][C]45[/C][C]0.036136[/C][C]0.3541[/C][C]0.362035[/C][/ROW]
[ROW][C]46[/C][C]0.044046[/C][C]0.4316[/C][C]0.333515[/C][/ROW]
[ROW][C]47[/C][C]0.004218[/C][C]0.0413[/C][C]0.483562[/C][/ROW]
[ROW][C]48[/C][C]-0.066031[/C][C]-0.647[/C][C]0.259596[/C][/ROW]
[/TABLE]
Source: https://freestatistics.org/blog/index.php?pk=277999&T=2

Globally Unique Identifier (entire table): ba.freestatistics.org/blog/index.php?pk=277999&T=2

As an alternative you can also use a QR Code:  

The GUIDs for individual cells are displayed in the table below:

Partial Autocorrelation Function
Time lag kPACF(k)T-STATP-value
10.3971593.89139.2e-05
2-0.1815-1.77830.039258
30.2183442.13930.017473
40.3954823.87499.7e-05
50.0488070.47820.316794
60.2944952.88540.002413
70.2856462.79880.0031
80.0020280.01990.492095
9-0.292654-2.86740.002544
10-0.219713-2.15270.016923
11-0.036533-0.3580.360583
120.4368724.28052.2e-05
13-0.155973-1.52820.064874
14-0.032062-0.31410.377046
15-0.212548-2.08250.019976
16-0.093534-0.91640.180865
17-0.005849-0.05730.477208
18-0.033032-0.32360.373454
190.0714620.70020.242752
200.0968370.94880.172551
210.0157560.15440.438817
22-0.089472-0.87660.191433
230.0642030.62910.265402
240.0467450.4580.323992
25-0.081001-0.79360.21468
26-0.089557-0.87750.191209
270.0269490.2640.396156
28-0.084107-0.82410.205968
29-0.066793-0.65440.257197
30-0.036867-0.36120.359363
31-0.010808-0.10590.457943
32-0.08085-0.79220.215108
330.0433860.42510.33586
34-0.009422-0.09230.463319
35-0.062062-0.60810.272286
360.0083210.08150.467595
37-0.085353-0.83630.202534
380.1469971.44030.076523
39-0.010782-0.10560.458043
40-0.133462-1.30770.097056
41-0.034782-0.34080.367003
42-0.067098-0.65740.256242
43-0.059204-0.58010.281612
440.0776790.76110.224234
450.0361360.35410.362035
460.0440460.43160.333515
470.0042180.04130.483562
48-0.066031-0.6470.259596


Parameters (Session):
par1 = 48 ; par2 = 1 ; par3 = 0 ; par4 = 0 ; par5 = 12 ; par6 = White Noise ; par7 = 0.95 ;
Parameters (R input):
par1 = 48 ; par2 = 1 ; par3 = 0 ; par4 = 0 ; par5 = 12 ; par6 = White Noise ; par7 = 0.95 ; par8 = ;
R code (references can be found in the software module):
if (par1 == 'Default') {
par1 = 10*log10(length(x))
} else {
par1 <- as.numeric(par1)
}
par2 <- as.numeric(par2)
par3 <- as.numeric(par3)
par4 <- as.numeric(par4)
par5 <- as.numeric(par5)
if (par6 == 'White Noise') par6 <- 'white' else par6 <- 'ma'
par7 <- as.numeric(par7)
if (par8 != '') par8 <- as.numeric(par8)
ox <- x
if (par8 == '') {
if (par2 == 0) {
x <- log(x)
} else {
x <- (x ^ par2 - 1) / par2
}
} else {
x <- log(x,base=par8)
}
if (par3 > 0) x <- diff(x,lag=1,difference=par3)
if (par4 > 0) x <- diff(x,lag=par5,difference=par4)
bitmap(file='picts.png')
op <- par(mfrow=c(2,1))
plot(ox,type='l',main='Original Time Series',xlab='time',ylab='value')
if (par8=='') {
mytitle <- paste('Working Time Series (lambda=',par2,', d=',par3,', D=',par4,')',sep='')
mysub <- paste('(lambda=',par2,', d=',par3,', D=',par4,', CI=', par7, ', CI type=',par6,')',sep='')
} else {
mytitle <- paste('Working Time Series (base=',par8,', d=',par3,', D=',par4,')',sep='')
mysub <- paste('(base=',par8,', d=',par3,', D=',par4,', CI=', par7, ', CI type=',par6,')',sep='')
}
plot(x,type='l', main=mytitle,xlab='time',ylab='value')
par(op)
dev.off()
bitmap(file='pic1.png')
racf <- acf(x, par1, main='Autocorrelation', xlab='time lag', ylab='ACF', ci.type=par6, ci=par7, sub=mysub)
dev.off()
bitmap(file='pic2.png')
rpacf <- pacf(x,par1,main='Partial Autocorrelation',xlab='lags',ylab='PACF',sub=mysub)
dev.off()
(myacf <- c(racf$acf))
(mypacf <- c(rpacf$acf))
lengthx <- length(x)
sqrtn <- sqrt(lengthx)
load(file='createtable')
a<-table.start()
a<-table.row.start(a)
a<-table.element(a,'Autocorrelation Function',4,TRUE)
a<-table.row.end(a)
a<-table.row.start(a)
a<-table.element(a,'Time lag k',header=TRUE)
a<-table.element(a,hyperlink('basics.htm','ACF(k)','click here for more information about the Autocorrelation Function'),header=TRUE)
a<-table.element(a,'T-STAT',header=TRUE)
a<-table.element(a,'P-value',header=TRUE)
a<-table.row.end(a)
for (i in 2:(par1+1)) {
a<-table.row.start(a)
a<-table.element(a,i-1,header=TRUE)
a<-table.element(a,round(myacf[i],6))
mytstat <- myacf[i]*sqrtn
a<-table.element(a,round(mytstat,4))
a<-table.element(a,round(1-pt(abs(mytstat),lengthx),6))
a<-table.row.end(a)
}
a<-table.end(a)
table.save(a,file='mytable.tab')
a<-table.start()
a<-table.row.start(a)
a<-table.element(a,'Partial Autocorrelation Function',4,TRUE)
a<-table.row.end(a)
a<-table.row.start(a)
a<-table.element(a,'Time lag k',header=TRUE)
a<-table.element(a,hyperlink('basics.htm','PACF(k)','click here for more information about the Partial Autocorrelation Function'),header=TRUE)
a<-table.element(a,'T-STAT',header=TRUE)
a<-table.element(a,'P-value',header=TRUE)
a<-table.row.end(a)
for (i in 1:par1) {
a<-table.row.start(a)
a<-table.element(a,i,header=TRUE)
a<-table.element(a,round(mypacf[i],6))
mytstat <- mypacf[i]*sqrtn
a<-table.element(a,round(mytstat,4))
a<-table.element(a,round(1-pt(abs(mytstat),lengthx),6))
a<-table.row.end(a)
}
a<-table.end(a)
table.save(a,file='mytable1.tab')