Free Statistics

of Irreproducible Research!

Author's title

Author*Unverified author*
R Software Modulerwasp_autocorrelation.wasp
Title produced by software(Partial) Autocorrelation Function
Date of computationThu, 05 Mar 2015 19:06:14 +0000
Cite this page as followsStatistical Computations at FreeStatistics.org, Office for Research Development and Education, URL https://freestatistics.org/blog/index.php?v=date/2015/Mar/05/t1425582445ly42spclv7d1y7c.htm/, Retrieved Fri, 17 May 2024 05:15:31 +0000
Statistical Computations at FreeStatistics.org, Office for Research Development and Education, URL https://freestatistics.org/blog/index.php?pk=277993, Retrieved Fri, 17 May 2024 05:15:31 +0000
QR Codes:

Original text written by user:
IsPrivate?No (this computation is public)
User-defined keywords
Estimated Impact59
Family? (F = Feedback message, R = changed R code, M = changed R Module, P = changed Parameters, D = changed Data)
-       [(Partial) Autocorrelation Function] [] [2015-03-05 19:06:14] [efb69546851bccb1c0576f78d5afa44b] [Current]
Feedback Forum

Post a new message
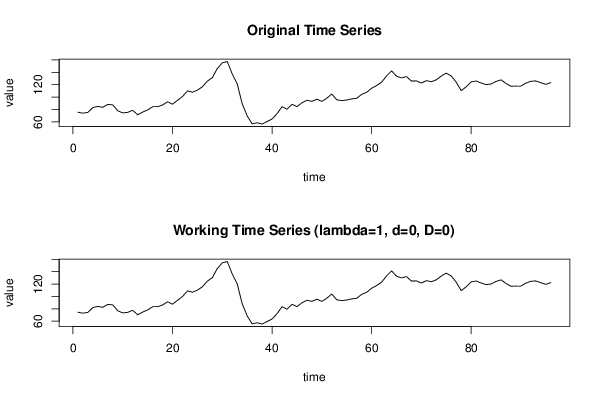
Dataseries X:
75.6
74
75.3
83.1
84.9
83.5
88.2
87.4
77.8
74.5
75.3
78.7
71.4
75.8
79.2
84.4
84.4
87.2
92.4
88.5
94.8
100.9
110
107.9
111.2
116.7
125.8
131.5
146.2
155.4
157.5
137.2
121.3
89.1
69.6
56.7
58.5
56.4
60.5
64.6
73.2
84.6
80.4
88.4
84.6
90.8
94.9
93.1
96.6
93.1
98.3
105
95.6
94.3
95.3
97.1
98.1
104.4
107.8
114.3
118.7
124.1
134.2
142.4
133.8
131
133.2
125.9
126.2
122.7
126.6
124.8
128
134.1
138.8
134
124
110.4
116.7
124.7
126
122.8
120.2
121.2
125.4
127.9
122
117.5
117.9
117.9
122.7
125.7
126.1
123.2
120.6
123.5


Summary of computational transaction
Raw Inputview raw input (R code)
Raw Outputview raw output of R engine
Computing time2 seconds
R Server'Sir Maurice George Kendall' @ kendall.wessa.net

\begin{tabular}{lllllllll}
\hline
Summary of computational transaction \tabularnewline
Raw Input & view raw input (R code)  \tabularnewline
Raw Output & view raw output of R engine  \tabularnewline
Computing time & 2 seconds \tabularnewline
R Server & 'Sir Maurice George Kendall' @ kendall.wessa.net \tabularnewline
\hline
\end{tabular}
%Source: https://freestatistics.org/blog/index.php?pk=277993&T=0

[TABLE]
[ROW][C]Summary of computational transaction[/C][/ROW]
[ROW][C]Raw Input[/C][C]view raw input (R code) [/C][/ROW]
[ROW][C]Raw Output[/C][C]view raw output of R engine [/C][/ROW]
[ROW][C]Computing time[/C][C]2 seconds[/C][/ROW]
[ROW][C]R Server[/C][C]'Sir Maurice George Kendall' @ kendall.wessa.net[/C][/ROW]
[/TABLE]
Source: https://freestatistics.org/blog/index.php?pk=277993&T=0

Globally Unique Identifier (entire table): ba.freestatistics.org/blog/index.php?pk=277993&T=0

As an alternative you can also use a QR Code:  

The GUIDs for individual cells are displayed in the table below:

Summary of computational transaction
Raw Inputview raw input (R code)
Raw Outputview raw output of R engine
Computing time2 seconds
R Server'Sir Maurice George Kendall' @ kendall.wessa.net


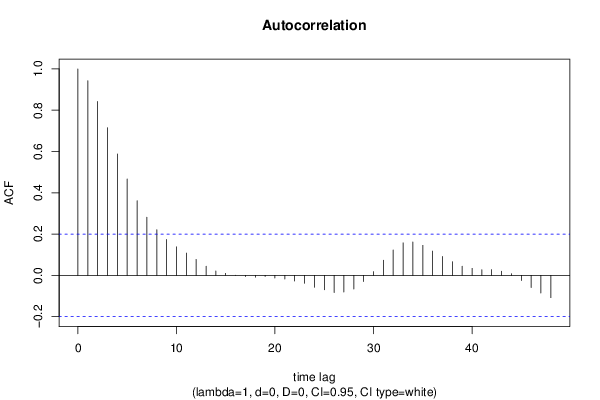
Autocorrelation Function
Time lag kACF(k)T-STATP-value
10.9432489.24190
20.8423098.25290
30.7148777.00430
40.5881475.76260
50.4665544.57137e-06
60.3612813.53980.00031
70.281872.76180.003445
80.2214242.16950.016257
90.1734211.69920.046263
100.1382361.35440.089388
110.1077281.05550.14692
120.0773120.75750.225302
130.0438150.42930.334335
140.0214930.21060.416826
150.0095920.0940.462661
160.0005510.00540.497851
17-0.005959-0.05840.476781
18-0.00853-0.08360.466783
19-0.005147-0.05040.479944
20-0.012918-0.12660.449773
21-0.017837-0.17480.430817
22-0.027098-0.26550.395596
23-0.038146-0.37380.354706
24-0.057446-0.56290.287422
25-0.06947-0.68070.248862
26-0.083443-0.81760.207813
27-0.080982-0.79350.214734
28-0.065862-0.64530.260133
29-0.03005-0.29440.384534
300.0179710.17610.430303
310.0734630.71980.236702
320.1228811.2040.115777
330.1573111.54130.063264
340.161711.58440.058193
350.1452991.42360.078897
360.1175081.15130.126227
370.0916380.89790.185752
380.0658370.64510.260211
390.0445670.43670.331668
400.0337650.33080.370747
410.0272560.26710.394999
420.0279040.27340.392568
430.0195720.19180.424166
440.0077140.07560.469956
45-0.025093-0.24590.403158
46-0.058448-0.57270.284103
47-0.085404-0.83680.202397
48-0.107804-1.05630.146751

\begin{tabular}{lllllllll}
\hline
Autocorrelation Function \tabularnewline
Time lag k & ACF(k) & T-STAT & P-value \tabularnewline
1 & 0.943248 & 9.2419 & 0 \tabularnewline
2 & 0.842309 & 8.2529 & 0 \tabularnewline
3 & 0.714877 & 7.0043 & 0 \tabularnewline
4 & 0.588147 & 5.7626 & 0 \tabularnewline
5 & 0.466554 & 4.5713 & 7e-06 \tabularnewline
6 & 0.361281 & 3.5398 & 0.00031 \tabularnewline
7 & 0.28187 & 2.7618 & 0.003445 \tabularnewline
8 & 0.221424 & 2.1695 & 0.016257 \tabularnewline
9 & 0.173421 & 1.6992 & 0.046263 \tabularnewline
10 & 0.138236 & 1.3544 & 0.089388 \tabularnewline
11 & 0.107728 & 1.0555 & 0.14692 \tabularnewline
12 & 0.077312 & 0.7575 & 0.225302 \tabularnewline
13 & 0.043815 & 0.4293 & 0.334335 \tabularnewline
14 & 0.021493 & 0.2106 & 0.416826 \tabularnewline
15 & 0.009592 & 0.094 & 0.462661 \tabularnewline
16 & 0.000551 & 0.0054 & 0.497851 \tabularnewline
17 & -0.005959 & -0.0584 & 0.476781 \tabularnewline
18 & -0.00853 & -0.0836 & 0.466783 \tabularnewline
19 & -0.005147 & -0.0504 & 0.479944 \tabularnewline
20 & -0.012918 & -0.1266 & 0.449773 \tabularnewline
21 & -0.017837 & -0.1748 & 0.430817 \tabularnewline
22 & -0.027098 & -0.2655 & 0.395596 \tabularnewline
23 & -0.038146 & -0.3738 & 0.354706 \tabularnewline
24 & -0.057446 & -0.5629 & 0.287422 \tabularnewline
25 & -0.06947 & -0.6807 & 0.248862 \tabularnewline
26 & -0.083443 & -0.8176 & 0.207813 \tabularnewline
27 & -0.080982 & -0.7935 & 0.214734 \tabularnewline
28 & -0.065862 & -0.6453 & 0.260133 \tabularnewline
29 & -0.03005 & -0.2944 & 0.384534 \tabularnewline
30 & 0.017971 & 0.1761 & 0.430303 \tabularnewline
31 & 0.073463 & 0.7198 & 0.236702 \tabularnewline
32 & 0.122881 & 1.204 & 0.115777 \tabularnewline
33 & 0.157311 & 1.5413 & 0.063264 \tabularnewline
34 & 0.16171 & 1.5844 & 0.058193 \tabularnewline
35 & 0.145299 & 1.4236 & 0.078897 \tabularnewline
36 & 0.117508 & 1.1513 & 0.126227 \tabularnewline
37 & 0.091638 & 0.8979 & 0.185752 \tabularnewline
38 & 0.065837 & 0.6451 & 0.260211 \tabularnewline
39 & 0.044567 & 0.4367 & 0.331668 \tabularnewline
40 & 0.033765 & 0.3308 & 0.370747 \tabularnewline
41 & 0.027256 & 0.2671 & 0.394999 \tabularnewline
42 & 0.027904 & 0.2734 & 0.392568 \tabularnewline
43 & 0.019572 & 0.1918 & 0.424166 \tabularnewline
44 & 0.007714 & 0.0756 & 0.469956 \tabularnewline
45 & -0.025093 & -0.2459 & 0.403158 \tabularnewline
46 & -0.058448 & -0.5727 & 0.284103 \tabularnewline
47 & -0.085404 & -0.8368 & 0.202397 \tabularnewline
48 & -0.107804 & -1.0563 & 0.146751 \tabularnewline
\hline
\end{tabular}
%Source: https://freestatistics.org/blog/index.php?pk=277993&T=1

[TABLE]
[ROW][C]Autocorrelation Function[/C][/ROW]
[ROW][C]Time lag k[/C][C]ACF(k)[/C][C]T-STAT[/C][C]P-value[/C][/ROW]
[ROW][C]1[/C][C]0.943248[/C][C]9.2419[/C][C]0[/C][/ROW]
[ROW][C]2[/C][C]0.842309[/C][C]8.2529[/C][C]0[/C][/ROW]
[ROW][C]3[/C][C]0.714877[/C][C]7.0043[/C][C]0[/C][/ROW]
[ROW][C]4[/C][C]0.588147[/C][C]5.7626[/C][C]0[/C][/ROW]
[ROW][C]5[/C][C]0.466554[/C][C]4.5713[/C][C]7e-06[/C][/ROW]
[ROW][C]6[/C][C]0.361281[/C][C]3.5398[/C][C]0.00031[/C][/ROW]
[ROW][C]7[/C][C]0.28187[/C][C]2.7618[/C][C]0.003445[/C][/ROW]
[ROW][C]8[/C][C]0.221424[/C][C]2.1695[/C][C]0.016257[/C][/ROW]
[ROW][C]9[/C][C]0.173421[/C][C]1.6992[/C][C]0.046263[/C][/ROW]
[ROW][C]10[/C][C]0.138236[/C][C]1.3544[/C][C]0.089388[/C][/ROW]
[ROW][C]11[/C][C]0.107728[/C][C]1.0555[/C][C]0.14692[/C][/ROW]
[ROW][C]12[/C][C]0.077312[/C][C]0.7575[/C][C]0.225302[/C][/ROW]
[ROW][C]13[/C][C]0.043815[/C][C]0.4293[/C][C]0.334335[/C][/ROW]
[ROW][C]14[/C][C]0.021493[/C][C]0.2106[/C][C]0.416826[/C][/ROW]
[ROW][C]15[/C][C]0.009592[/C][C]0.094[/C][C]0.462661[/C][/ROW]
[ROW][C]16[/C][C]0.000551[/C][C]0.0054[/C][C]0.497851[/C][/ROW]
[ROW][C]17[/C][C]-0.005959[/C][C]-0.0584[/C][C]0.476781[/C][/ROW]
[ROW][C]18[/C][C]-0.00853[/C][C]-0.0836[/C][C]0.466783[/C][/ROW]
[ROW][C]19[/C][C]-0.005147[/C][C]-0.0504[/C][C]0.479944[/C][/ROW]
[ROW][C]20[/C][C]-0.012918[/C][C]-0.1266[/C][C]0.449773[/C][/ROW]
[ROW][C]21[/C][C]-0.017837[/C][C]-0.1748[/C][C]0.430817[/C][/ROW]
[ROW][C]22[/C][C]-0.027098[/C][C]-0.2655[/C][C]0.395596[/C][/ROW]
[ROW][C]23[/C][C]-0.038146[/C][C]-0.3738[/C][C]0.354706[/C][/ROW]
[ROW][C]24[/C][C]-0.057446[/C][C]-0.5629[/C][C]0.287422[/C][/ROW]
[ROW][C]25[/C][C]-0.06947[/C][C]-0.6807[/C][C]0.248862[/C][/ROW]
[ROW][C]26[/C][C]-0.083443[/C][C]-0.8176[/C][C]0.207813[/C][/ROW]
[ROW][C]27[/C][C]-0.080982[/C][C]-0.7935[/C][C]0.214734[/C][/ROW]
[ROW][C]28[/C][C]-0.065862[/C][C]-0.6453[/C][C]0.260133[/C][/ROW]
[ROW][C]29[/C][C]-0.03005[/C][C]-0.2944[/C][C]0.384534[/C][/ROW]
[ROW][C]30[/C][C]0.017971[/C][C]0.1761[/C][C]0.430303[/C][/ROW]
[ROW][C]31[/C][C]0.073463[/C][C]0.7198[/C][C]0.236702[/C][/ROW]
[ROW][C]32[/C][C]0.122881[/C][C]1.204[/C][C]0.115777[/C][/ROW]
[ROW][C]33[/C][C]0.157311[/C][C]1.5413[/C][C]0.063264[/C][/ROW]
[ROW][C]34[/C][C]0.16171[/C][C]1.5844[/C][C]0.058193[/C][/ROW]
[ROW][C]35[/C][C]0.145299[/C][C]1.4236[/C][C]0.078897[/C][/ROW]
[ROW][C]36[/C][C]0.117508[/C][C]1.1513[/C][C]0.126227[/C][/ROW]
[ROW][C]37[/C][C]0.091638[/C][C]0.8979[/C][C]0.185752[/C][/ROW]
[ROW][C]38[/C][C]0.065837[/C][C]0.6451[/C][C]0.260211[/C][/ROW]
[ROW][C]39[/C][C]0.044567[/C][C]0.4367[/C][C]0.331668[/C][/ROW]
[ROW][C]40[/C][C]0.033765[/C][C]0.3308[/C][C]0.370747[/C][/ROW]
[ROW][C]41[/C][C]0.027256[/C][C]0.2671[/C][C]0.394999[/C][/ROW]
[ROW][C]42[/C][C]0.027904[/C][C]0.2734[/C][C]0.392568[/C][/ROW]
[ROW][C]43[/C][C]0.019572[/C][C]0.1918[/C][C]0.424166[/C][/ROW]
[ROW][C]44[/C][C]0.007714[/C][C]0.0756[/C][C]0.469956[/C][/ROW]
[ROW][C]45[/C][C]-0.025093[/C][C]-0.2459[/C][C]0.403158[/C][/ROW]
[ROW][C]46[/C][C]-0.058448[/C][C]-0.5727[/C][C]0.284103[/C][/ROW]
[ROW][C]47[/C][C]-0.085404[/C][C]-0.8368[/C][C]0.202397[/C][/ROW]
[ROW][C]48[/C][C]-0.107804[/C][C]-1.0563[/C][C]0.146751[/C][/ROW]
[/TABLE]
Source: https://freestatistics.org/blog/index.php?pk=277993&T=1

Globally Unique Identifier (entire table): ba.freestatistics.org/blog/index.php?pk=277993&T=1

As an alternative you can also use a QR Code:  

The GUIDs for individual cells are displayed in the table below:

Autocorrelation Function
Time lag kACF(k)T-STATP-value
10.9432489.24190
20.8423098.25290
30.7148777.00430
40.5881475.76260
50.4665544.57137e-06
60.3612813.53980.00031
70.281872.76180.003445
80.2214242.16950.016257
90.1734211.69920.046263
100.1382361.35440.089388
110.1077281.05550.14692
120.0773120.75750.225302
130.0438150.42930.334335
140.0214930.21060.416826
150.0095920.0940.462661
160.0005510.00540.497851
17-0.005959-0.05840.476781
18-0.00853-0.08360.466783
19-0.005147-0.05040.479944
20-0.012918-0.12660.449773
21-0.017837-0.17480.430817
22-0.027098-0.26550.395596
23-0.038146-0.37380.354706
24-0.057446-0.56290.287422
25-0.06947-0.68070.248862
26-0.083443-0.81760.207813
27-0.080982-0.79350.214734
28-0.065862-0.64530.260133
29-0.03005-0.29440.384534
300.0179710.17610.430303
310.0734630.71980.236702
320.1228811.2040.115777
330.1573111.54130.063264
340.161711.58440.058193
350.1452991.42360.078897
360.1175081.15130.126227
370.0916380.89790.185752
380.0658370.64510.260211
390.0445670.43670.331668
400.0337650.33080.370747
410.0272560.26710.394999
420.0279040.27340.392568
430.0195720.19180.424166
440.0077140.07560.469956
45-0.025093-0.24590.403158
46-0.058448-0.57270.284103
47-0.085404-0.83680.202397
48-0.107804-1.05630.146751


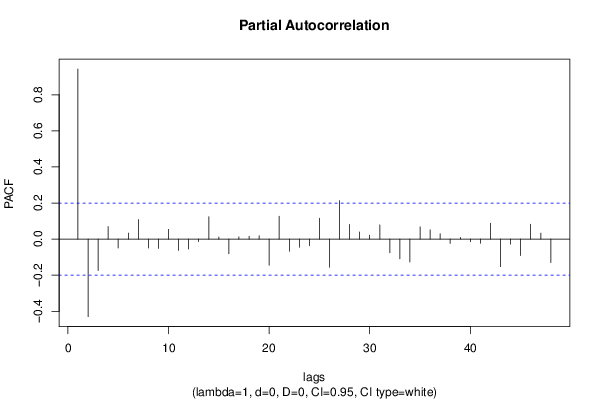
Partial Autocorrelation Function
Time lag kPACF(k)T-STATP-value
10.9432489.24190
2-0.429881-4.2122.9e-05
3-0.174502-1.70980.04527
40.0693380.67940.249268
5-0.049633-0.48630.31393
60.0333320.32660.372347
70.1086131.06420.144958
8-0.049406-0.48410.314718
9-0.051519-0.50480.307436
100.0539590.52870.299123
11-0.063121-0.61850.268868
12-0.055293-0.54180.29462
13-0.013835-0.13560.446228
140.1243251.21810.113079
150.0112880.11060.456082
16-0.081282-0.79640.213884
170.0125030.12250.451379
180.015210.1490.440921
190.0182830.17910.429104
20-0.144583-1.41660.079915
210.1268071.24240.108549
22-0.067205-0.65850.255906
23-0.045109-0.4420.329749
24-0.037027-0.36280.35878
250.1154181.13090.130466
26-0.156548-1.53380.064178
270.2134072.0910.019587
280.0807540.79120.215382
290.03970.3890.349078
300.0213050.20870.417546
310.0787540.77160.221114
32-0.075992-0.74460.229175
33-0.109422-1.07210.143179
34-0.126511-1.23960.109081
350.0677510.66380.254197
360.0510630.50030.308999
370.0294440.28850.386796
38-0.023895-0.23410.407693
390.0094370.09250.463263
40-0.015024-0.14720.441638
41-0.02282-0.22360.411777
420.0877720.860.19597
43-0.152553-1.49470.069135
44-0.02776-0.2720.393107
45-0.090552-0.88720.188587
460.0828290.81160.209527
470.0331090.32440.37317
48-0.130269-1.27640.102452

\begin{tabular}{lllllllll}
\hline
Partial Autocorrelation Function \tabularnewline
Time lag k & PACF(k) & T-STAT & P-value \tabularnewline
1 & 0.943248 & 9.2419 & 0 \tabularnewline
2 & -0.429881 & -4.212 & 2.9e-05 \tabularnewline
3 & -0.174502 & -1.7098 & 0.04527 \tabularnewline
4 & 0.069338 & 0.6794 & 0.249268 \tabularnewline
5 & -0.049633 & -0.4863 & 0.31393 \tabularnewline
6 & 0.033332 & 0.3266 & 0.372347 \tabularnewline
7 & 0.108613 & 1.0642 & 0.144958 \tabularnewline
8 & -0.049406 & -0.4841 & 0.314718 \tabularnewline
9 & -0.051519 & -0.5048 & 0.307436 \tabularnewline
10 & 0.053959 & 0.5287 & 0.299123 \tabularnewline
11 & -0.063121 & -0.6185 & 0.268868 \tabularnewline
12 & -0.055293 & -0.5418 & 0.29462 \tabularnewline
13 & -0.013835 & -0.1356 & 0.446228 \tabularnewline
14 & 0.124325 & 1.2181 & 0.113079 \tabularnewline
15 & 0.011288 & 0.1106 & 0.456082 \tabularnewline
16 & -0.081282 & -0.7964 & 0.213884 \tabularnewline
17 & 0.012503 & 0.1225 & 0.451379 \tabularnewline
18 & 0.01521 & 0.149 & 0.440921 \tabularnewline
19 & 0.018283 & 0.1791 & 0.429104 \tabularnewline
20 & -0.144583 & -1.4166 & 0.079915 \tabularnewline
21 & 0.126807 & 1.2424 & 0.108549 \tabularnewline
22 & -0.067205 & -0.6585 & 0.255906 \tabularnewline
23 & -0.045109 & -0.442 & 0.329749 \tabularnewline
24 & -0.037027 & -0.3628 & 0.35878 \tabularnewline
25 & 0.115418 & 1.1309 & 0.130466 \tabularnewline
26 & -0.156548 & -1.5338 & 0.064178 \tabularnewline
27 & 0.213407 & 2.091 & 0.019587 \tabularnewline
28 & 0.080754 & 0.7912 & 0.215382 \tabularnewline
29 & 0.0397 & 0.389 & 0.349078 \tabularnewline
30 & 0.021305 & 0.2087 & 0.417546 \tabularnewline
31 & 0.078754 & 0.7716 & 0.221114 \tabularnewline
32 & -0.075992 & -0.7446 & 0.229175 \tabularnewline
33 & -0.109422 & -1.0721 & 0.143179 \tabularnewline
34 & -0.126511 & -1.2396 & 0.109081 \tabularnewline
35 & 0.067751 & 0.6638 & 0.254197 \tabularnewline
36 & 0.051063 & 0.5003 & 0.308999 \tabularnewline
37 & 0.029444 & 0.2885 & 0.386796 \tabularnewline
38 & -0.023895 & -0.2341 & 0.407693 \tabularnewline
39 & 0.009437 & 0.0925 & 0.463263 \tabularnewline
40 & -0.015024 & -0.1472 & 0.441638 \tabularnewline
41 & -0.02282 & -0.2236 & 0.411777 \tabularnewline
42 & 0.087772 & 0.86 & 0.19597 \tabularnewline
43 & -0.152553 & -1.4947 & 0.069135 \tabularnewline
44 & -0.02776 & -0.272 & 0.393107 \tabularnewline
45 & -0.090552 & -0.8872 & 0.188587 \tabularnewline
46 & 0.082829 & 0.8116 & 0.209527 \tabularnewline
47 & 0.033109 & 0.3244 & 0.37317 \tabularnewline
48 & -0.130269 & -1.2764 & 0.102452 \tabularnewline
\hline
\end{tabular}
%Source: https://freestatistics.org/blog/index.php?pk=277993&T=2

[TABLE]
[ROW][C]Partial Autocorrelation Function[/C][/ROW]
[ROW][C]Time lag k[/C][C]PACF(k)[/C][C]T-STAT[/C][C]P-value[/C][/ROW]
[ROW][C]1[/C][C]0.943248[/C][C]9.2419[/C][C]0[/C][/ROW]
[ROW][C]2[/C][C]-0.429881[/C][C]-4.212[/C][C]2.9e-05[/C][/ROW]
[ROW][C]3[/C][C]-0.174502[/C][C]-1.7098[/C][C]0.04527[/C][/ROW]
[ROW][C]4[/C][C]0.069338[/C][C]0.6794[/C][C]0.249268[/C][/ROW]
[ROW][C]5[/C][C]-0.049633[/C][C]-0.4863[/C][C]0.31393[/C][/ROW]
[ROW][C]6[/C][C]0.033332[/C][C]0.3266[/C][C]0.372347[/C][/ROW]
[ROW][C]7[/C][C]0.108613[/C][C]1.0642[/C][C]0.144958[/C][/ROW]
[ROW][C]8[/C][C]-0.049406[/C][C]-0.4841[/C][C]0.314718[/C][/ROW]
[ROW][C]9[/C][C]-0.051519[/C][C]-0.5048[/C][C]0.307436[/C][/ROW]
[ROW][C]10[/C][C]0.053959[/C][C]0.5287[/C][C]0.299123[/C][/ROW]
[ROW][C]11[/C][C]-0.063121[/C][C]-0.6185[/C][C]0.268868[/C][/ROW]
[ROW][C]12[/C][C]-0.055293[/C][C]-0.5418[/C][C]0.29462[/C][/ROW]
[ROW][C]13[/C][C]-0.013835[/C][C]-0.1356[/C][C]0.446228[/C][/ROW]
[ROW][C]14[/C][C]0.124325[/C][C]1.2181[/C][C]0.113079[/C][/ROW]
[ROW][C]15[/C][C]0.011288[/C][C]0.1106[/C][C]0.456082[/C][/ROW]
[ROW][C]16[/C][C]-0.081282[/C][C]-0.7964[/C][C]0.213884[/C][/ROW]
[ROW][C]17[/C][C]0.012503[/C][C]0.1225[/C][C]0.451379[/C][/ROW]
[ROW][C]18[/C][C]0.01521[/C][C]0.149[/C][C]0.440921[/C][/ROW]
[ROW][C]19[/C][C]0.018283[/C][C]0.1791[/C][C]0.429104[/C][/ROW]
[ROW][C]20[/C][C]-0.144583[/C][C]-1.4166[/C][C]0.079915[/C][/ROW]
[ROW][C]21[/C][C]0.126807[/C][C]1.2424[/C][C]0.108549[/C][/ROW]
[ROW][C]22[/C][C]-0.067205[/C][C]-0.6585[/C][C]0.255906[/C][/ROW]
[ROW][C]23[/C][C]-0.045109[/C][C]-0.442[/C][C]0.329749[/C][/ROW]
[ROW][C]24[/C][C]-0.037027[/C][C]-0.3628[/C][C]0.35878[/C][/ROW]
[ROW][C]25[/C][C]0.115418[/C][C]1.1309[/C][C]0.130466[/C][/ROW]
[ROW][C]26[/C][C]-0.156548[/C][C]-1.5338[/C][C]0.064178[/C][/ROW]
[ROW][C]27[/C][C]0.213407[/C][C]2.091[/C][C]0.019587[/C][/ROW]
[ROW][C]28[/C][C]0.080754[/C][C]0.7912[/C][C]0.215382[/C][/ROW]
[ROW][C]29[/C][C]0.0397[/C][C]0.389[/C][C]0.349078[/C][/ROW]
[ROW][C]30[/C][C]0.021305[/C][C]0.2087[/C][C]0.417546[/C][/ROW]
[ROW][C]31[/C][C]0.078754[/C][C]0.7716[/C][C]0.221114[/C][/ROW]
[ROW][C]32[/C][C]-0.075992[/C][C]-0.7446[/C][C]0.229175[/C][/ROW]
[ROW][C]33[/C][C]-0.109422[/C][C]-1.0721[/C][C]0.143179[/C][/ROW]
[ROW][C]34[/C][C]-0.126511[/C][C]-1.2396[/C][C]0.109081[/C][/ROW]
[ROW][C]35[/C][C]0.067751[/C][C]0.6638[/C][C]0.254197[/C][/ROW]
[ROW][C]36[/C][C]0.051063[/C][C]0.5003[/C][C]0.308999[/C][/ROW]
[ROW][C]37[/C][C]0.029444[/C][C]0.2885[/C][C]0.386796[/C][/ROW]
[ROW][C]38[/C][C]-0.023895[/C][C]-0.2341[/C][C]0.407693[/C][/ROW]
[ROW][C]39[/C][C]0.009437[/C][C]0.0925[/C][C]0.463263[/C][/ROW]
[ROW][C]40[/C][C]-0.015024[/C][C]-0.1472[/C][C]0.441638[/C][/ROW]
[ROW][C]41[/C][C]-0.02282[/C][C]-0.2236[/C][C]0.411777[/C][/ROW]
[ROW][C]42[/C][C]0.087772[/C][C]0.86[/C][C]0.19597[/C][/ROW]
[ROW][C]43[/C][C]-0.152553[/C][C]-1.4947[/C][C]0.069135[/C][/ROW]
[ROW][C]44[/C][C]-0.02776[/C][C]-0.272[/C][C]0.393107[/C][/ROW]
[ROW][C]45[/C][C]-0.090552[/C][C]-0.8872[/C][C]0.188587[/C][/ROW]
[ROW][C]46[/C][C]0.082829[/C][C]0.8116[/C][C]0.209527[/C][/ROW]
[ROW][C]47[/C][C]0.033109[/C][C]0.3244[/C][C]0.37317[/C][/ROW]
[ROW][C]48[/C][C]-0.130269[/C][C]-1.2764[/C][C]0.102452[/C][/ROW]
[/TABLE]
Source: https://freestatistics.org/blog/index.php?pk=277993&T=2

Globally Unique Identifier (entire table): ba.freestatistics.org/blog/index.php?pk=277993&T=2

As an alternative you can also use a QR Code:  

The GUIDs for individual cells are displayed in the table below:

Partial Autocorrelation Function
Time lag kPACF(k)T-STATP-value
10.9432489.24190
2-0.429881-4.2122.9e-05
3-0.174502-1.70980.04527
40.0693380.67940.249268
5-0.049633-0.48630.31393
60.0333320.32660.372347
70.1086131.06420.144958
8-0.049406-0.48410.314718
9-0.051519-0.50480.307436
100.0539590.52870.299123
11-0.063121-0.61850.268868
12-0.055293-0.54180.29462
13-0.013835-0.13560.446228
140.1243251.21810.113079
150.0112880.11060.456082
16-0.081282-0.79640.213884
170.0125030.12250.451379
180.015210.1490.440921
190.0182830.17910.429104
20-0.144583-1.41660.079915
210.1268071.24240.108549
22-0.067205-0.65850.255906
23-0.045109-0.4420.329749
24-0.037027-0.36280.35878
250.1154181.13090.130466
26-0.156548-1.53380.064178
270.2134072.0910.019587
280.0807540.79120.215382
290.03970.3890.349078
300.0213050.20870.417546
310.0787540.77160.221114
32-0.075992-0.74460.229175
33-0.109422-1.07210.143179
34-0.126511-1.23960.109081
350.0677510.66380.254197
360.0510630.50030.308999
370.0294440.28850.386796
38-0.023895-0.23410.407693
390.0094370.09250.463263
40-0.015024-0.14720.441638
41-0.02282-0.22360.411777
420.0877720.860.19597
43-0.152553-1.49470.069135
44-0.02776-0.2720.393107
45-0.090552-0.88720.188587
460.0828290.81160.209527
470.0331090.32440.37317
48-0.130269-1.27640.102452


Parameters (Session):
par1 = 48 ; par2 = 1 ; par3 = 0 ; par4 = 0 ; par5 = 12 ; par6 = White Noise ; par7 = 0.95 ;
Parameters (R input):
par1 = 48 ; par2 = 1 ; par3 = 0 ; par4 = 0 ; par5 = 12 ; par6 = White Noise ; par7 = 0.95 ; par8 = ;
R code (references can be found in the software module):
par8 <- ''
par7 <- '0.95'
par6 <- 'White Noise'
par5 <- '12'
par4 <- '0'
par3 <- '1'
par2 <- '1'
par1 <- '48'
if (par1 == 'Default') {
par1 = 10*log10(length(x))
} else {
par1 <- as.numeric(par1)
}
par2 <- as.numeric(par2)
par3 <- as.numeric(par3)
par4 <- as.numeric(par4)
par5 <- as.numeric(par5)
if (par6 == 'White Noise') par6 <- 'white' else par6 <- 'ma'
par7 <- as.numeric(par7)
if (par8 != '') par8 <- as.numeric(par8)
ox <- x
if (par8 == '') {
if (par2 == 0) {
x <- log(x)
} else {
x <- (x ^ par2 - 1) / par2
}
} else {
x <- log(x,base=par8)
}
if (par3 > 0) x <- diff(x,lag=1,difference=par3)
if (par4 > 0) x <- diff(x,lag=par5,difference=par4)
bitmap(file='picts.png')
op <- par(mfrow=c(2,1))
plot(ox,type='l',main='Original Time Series',xlab='time',ylab='value')
if (par8=='') {
mytitle <- paste('Working Time Series (lambda=',par2,', d=',par3,', D=',par4,')',sep='')
mysub <- paste('(lambda=',par2,', d=',par3,', D=',par4,', CI=', par7, ', CI type=',par6,')',sep='')
} else {
mytitle <- paste('Working Time Series (base=',par8,', d=',par3,', D=',par4,')',sep='')
mysub <- paste('(base=',par8,', d=',par3,', D=',par4,', CI=', par7, ', CI type=',par6,')',sep='')
}
plot(x,type='l', main=mytitle,xlab='time',ylab='value')
par(op)
dev.off()
bitmap(file='pic1.png')
racf <- acf(x, par1, main='Autocorrelation', xlab='time lag', ylab='ACF', ci.type=par6, ci=par7, sub=mysub)
dev.off()
bitmap(file='pic2.png')
rpacf <- pacf(x,par1,main='Partial Autocorrelation',xlab='lags',ylab='PACF',sub=mysub)
dev.off()
(myacf <- c(racf$acf))
(mypacf <- c(rpacf$acf))
lengthx <- length(x)
sqrtn <- sqrt(lengthx)
load(file='createtable')
a<-table.start()
a<-table.row.start(a)
a<-table.element(a,'Autocorrelation Function',4,TRUE)
a<-table.row.end(a)
a<-table.row.start(a)
a<-table.element(a,'Time lag k',header=TRUE)
a<-table.element(a,hyperlink('basics.htm','ACF(k)','click here for more information about the Autocorrelation Function'),header=TRUE)
a<-table.element(a,'T-STAT',header=TRUE)
a<-table.element(a,'P-value',header=TRUE)
a<-table.row.end(a)
for (i in 2:(par1+1)) {
a<-table.row.start(a)
a<-table.element(a,i-1,header=TRUE)
a<-table.element(a,round(myacf[i],6))
mytstat <- myacf[i]*sqrtn
a<-table.element(a,round(mytstat,4))
a<-table.element(a,round(1-pt(abs(mytstat),lengthx),6))
a<-table.row.end(a)
}
a<-table.end(a)
table.save(a,file='mytable.tab')
a<-table.start()
a<-table.row.start(a)
a<-table.element(a,'Partial Autocorrelation Function',4,TRUE)
a<-table.row.end(a)
a<-table.row.start(a)
a<-table.element(a,'Time lag k',header=TRUE)
a<-table.element(a,hyperlink('basics.htm','PACF(k)','click here for more information about the Partial Autocorrelation Function'),header=TRUE)
a<-table.element(a,'T-STAT',header=TRUE)
a<-table.element(a,'P-value',header=TRUE)
a<-table.row.end(a)
for (i in 1:par1) {
a<-table.row.start(a)
a<-table.element(a,i,header=TRUE)
a<-table.element(a,round(mypacf[i],6))
mytstat <- mypacf[i]*sqrtn
a<-table.element(a,round(mytstat,4))
a<-table.element(a,round(1-pt(abs(mytstat),lengthx),6))
a<-table.row.end(a)
}
a<-table.end(a)
table.save(a,file='mytable1.tab')