Free Statistics
of Irreproducible Research!
Description of Statistical Computation | |||||||||||||||||||||||||||||||||||||||||
|---|---|---|---|---|---|---|---|---|---|---|---|---|---|---|---|---|---|---|---|---|---|---|---|---|---|---|---|---|---|---|---|---|---|---|---|---|---|---|---|---|---|
| Author's title | |||||||||||||||||||||||||||||||||||||||||
| Author | *Unverified author* | ||||||||||||||||||||||||||||||||||||||||
| R Software Module | rwasp_univariatedataseries.wasp | ||||||||||||||||||||||||||||||||||||||||
| Title produced by software | Univariate Data Series | ||||||||||||||||||||||||||||||||||||||||
| Date of computation | Mon, 13 Jul 2015 15:22:06 +0100 | ||||||||||||||||||||||||||||||||||||||||
| Cite this page as follows | Statistical Computations at FreeStatistics.org, Office for Research Development and Education, URL https://freestatistics.org/blog/index.php?v=date/2015/Jul/13/t1436797426fv7wvvwft8seb2y.htm/, Retrieved Sun, 19 May 2024 14:07:00 +0000 | ||||||||||||||||||||||||||||||||||||||||
| Statistical Computations at FreeStatistics.org, Office for Research Development and Education, URL https://freestatistics.org/blog/index.php?pk=279553, Retrieved Sun, 19 May 2024 14:07:00 +0000 | |||||||||||||||||||||||||||||||||||||||||
| QR Codes: | |||||||||||||||||||||||||||||||||||||||||
|
| |||||||||||||||||||||||||||||||||||||||||
| Original text written by user: | |||||||||||||||||||||||||||||||||||||||||
| IsPrivate? | No (this computation is public) | ||||||||||||||||||||||||||||||||||||||||
| User-defined keywords | |||||||||||||||||||||||||||||||||||||||||
| Estimated Impact | 165 | ||||||||||||||||||||||||||||||||||||||||
Tree of Dependent Computations | |||||||||||||||||||||||||||||||||||||||||
| Family? (F = Feedback message, R = changed R code, M = changed R Module, P = changed Parameters, D = changed Data) | |||||||||||||||||||||||||||||||||||||||||
| - [Univariate Data Series] [REEKS B: oefening 1] [2015-07-13 14:22:06] [b81b5adcb18a6dd731e9cb79a54989dd] [Current] - RMP [Histogram] [REEKS B: oefening 2] [2015-07-13 14:26:38] [6b666be92a2717ec998be34b30849c21] - RMP [Kernel Density Estimation] [REEKS B: oefening 3] [2015-07-13 14:36:10] [6b666be92a2717ec998be34b30849c21] - RMP [Harrell-Davis Quantiles] [REEKS B: oefening 5] [2015-07-13 14:48:50] [6b666be92a2717ec998be34b30849c21] - RMP [Harrell-Davis Quantiles] [REEKS B: oefening...] [2015-07-13 14:56:32] [6b666be92a2717ec998be34b30849c21] - RMP [Central Tendency] [REEKS B: oefening 6] [2015-07-13 15:04:57] [6b666be92a2717ec998be34b30849c21] | |||||||||||||||||||||||||||||||||||||||||
| Feedback Forum | |||||||||||||||||||||||||||||||||||||||||
Post a new message | |||||||||||||||||||||||||||||||||||||||||
Dataset | |||||||||||||||||||||||||||||||||||||||||
| Dataseries X: | |||||||||||||||||||||||||||||||||||||||||
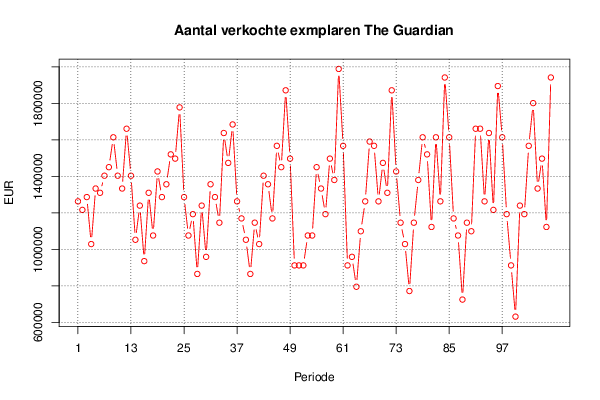
1263600 1216800 1287000 1029600 1333800 1310400 1404000 1450800 1614600 1404000 1333800 1661400 1404000 1053000 1240200 936000 1310400 1076400 1427400 1287000 1357200 1521000 1497600 1778400 1287000 1076400 1193400 865800 1240200 959400 1357200 1287000 1146600 1638000 1474200 1684800 1263600 1170000 1053000 865800 1146600 1029600 1404000 1357200 1170000 1567800 1450800 1872000 1497600 912600 912600 912600 1076400 1076400 1450800 1333800 1193400 1497600 1380600 1989000 1567800 912600 959400 795600 1099800 1263600 1591200 1567800 1263600 1474200 1310400 1872000 1427400 1146600 1029600 772200 1146600 1380600 1614600 1521000 1123200 1614600 1263600 1942200 1614600 1170000 1076400 725400 1146600 1099800 1661400 1661400 1263600 1638000 1216800 1895400 1614600 1193400 912600 631800 1240200 1193400 1567800 1801800 1333800 1497600 1123200 1942200 | |||||||||||||||||||||||||||||||||||||||||
Tables (Output of Computation) | |||||||||||||||||||||||||||||||||||||||||
| |||||||||||||||||||||||||||||||||||||||||
Figures (Output of Computation) | |||||||||||||||||||||||||||||||||||||||||
Input Parameters & R Code | |||||||||||||||||||||||||||||||||||||||||
| Parameters (Session): | |||||||||||||||||||||||||||||||||||||||||
| par1 = Aantal verkochte exemplaren The Guardian ; par2 = niet gekend ; par3 = maandelijkse overzicht van het aantal verkochte exemplaren tussen de 01/2006 - 12/0214 ; par4 = 12 ; | |||||||||||||||||||||||||||||||||||||||||
| Parameters (R input): | |||||||||||||||||||||||||||||||||||||||||
| par1 = Aantal verkochte exemplaren The Guardian ; par2 = niet gekend ; par3 = maandelijkse overzicht van het aantal verkochte exemplaren tussen de 01/2006 - 12/0214 ; par4 = 12 ; | |||||||||||||||||||||||||||||||||||||||||
| R code (references can be found in the software module): | |||||||||||||||||||||||||||||||||||||||||
par4 <- '12' | |||||||||||||||||||||||||||||||||||||||||