Free Statistics

of Irreproducible Research!

Author's title

Author*Unverified author*
R Software Modulerwasp_kendall.wasp
Title produced by softwareKendall tau Rank Correlation
Date of computationSat, 31 Jan 2015 21:47:19 +0000
Cite this page as followsStatistical Computations at FreeStatistics.org, Office for Research Development and Education, URL https://freestatistics.org/blog/index.php?v=date/2015/Jan/31/t14227408883cbt9bivedakikg.htm/, Retrieved Tue, 14 May 2024 12:49:35 +0000
Statistical Computations at FreeStatistics.org, Office for Research Development and Education, URL https://freestatistics.org/blog/index.php?pk=276302, Retrieved Tue, 14 May 2024 12:49:35 +0000
QR Codes:

Original text written by user:
IsPrivate?No (this computation is public)
User-defined keywords
Estimated Impact133
Family? (F = Feedback message, R = changed R code, M = changed R Module, P = changed Parameters, D = changed Data)
-       [Kendall tau Rank Correlation] [SMAD Type IIA All] [2015-01-31 21:47:19] [d41d8cd98f00b204e9800998ecf8427e] [Current]
Feedback Forum

Post a new message
Dataseries X:
0.587968037
0.597615421
0.296704732
0.368135765
0.305807188
0.49589774
0.409323052
0.489160433
0.424264476
0.566382885
0.434957847
0.328553453
Dataseries Y:
32
31.25
30.4
33.1
3.8
29.85
48.35
7.05
49.15
17.95
13.8
25.95


Summary of computational transaction
Raw Inputview raw input (R code)
Raw Outputview raw output of R engine
Computing time1 seconds
R Server'Sir Maurice George Kendall' @ kendall.wessa.net

\begin{tabular}{lllllllll}
\hline
Summary of computational transaction \tabularnewline
Raw Input & view raw input (R code)  \tabularnewline
Raw Output & view raw output of R engine  \tabularnewline
Computing time & 1 seconds \tabularnewline
R Server & 'Sir Maurice George Kendall' @ kendall.wessa.net \tabularnewline
\hline
\end{tabular}
%Source: https://freestatistics.org/blog/index.php?pk=276302&T=0

[TABLE]
[ROW][C]Summary of computational transaction[/C][/ROW]
[ROW][C]Raw Input[/C][C]view raw input (R code) [/C][/ROW]
[ROW][C]Raw Output[/C][C]view raw output of R engine [/C][/ROW]
[ROW][C]Computing time[/C][C]1 seconds[/C][/ROW]
[ROW][C]R Server[/C][C]'Sir Maurice George Kendall' @ kendall.wessa.net[/C][/ROW]
[/TABLE]
Source: https://freestatistics.org/blog/index.php?pk=276302&T=0

Globally Unique Identifier (entire table): ba.freestatistics.org/blog/index.php?pk=276302&T=0

As an alternative you can also use a QR Code:  

The GUIDs for individual cells are displayed in the table below:

Summary of computational transaction
Raw Inputview raw input (R code)
Raw Outputview raw output of R engine
Computing time1 seconds
R Server'Sir Maurice George Kendall' @ kendall.wessa.net


Kendall tau Rank Correlation
Kendall tau0.0909090787172318
2-sided p-value0.731701731681824
Score6
Var(Score)212.66667175293
Denominator66.0000076293945

\begin{tabular}{lllllllll}
\hline
Kendall tau Rank Correlation \tabularnewline
Kendall tau & 0.0909090787172318 \tabularnewline
2-sided p-value & 0.731701731681824 \tabularnewline
Score & 6 \tabularnewline
Var(Score) & 212.66667175293 \tabularnewline
Denominator & 66.0000076293945 \tabularnewline
\hline
\end{tabular}
%Source: https://freestatistics.org/blog/index.php?pk=276302&T=1

[TABLE]
[ROW][C]Kendall tau Rank Correlation[/C][/ROW]
[ROW][C]Kendall tau[/C][C]0.0909090787172318[/C][/ROW]
[ROW][C]2-sided p-value[/C][C]0.731701731681824[/C][/ROW]
[ROW][C]Score[/C][C]6[/C][/ROW]
[ROW][C]Var(Score)[/C][C]212.66667175293[/C][/ROW]
[ROW][C]Denominator[/C][C]66.0000076293945[/C][/ROW]
[/TABLE]
Source: https://freestatistics.org/blog/index.php?pk=276302&T=1

Globally Unique Identifier (entire table): ba.freestatistics.org/blog/index.php?pk=276302&T=1

As an alternative you can also use a QR Code:  

The GUIDs for individual cells are displayed in the table below:

Kendall tau Rank Correlation
Kendall tau0.0909090787172318
2-sided p-value0.731701731681824
Score6
Var(Score)212.66667175293
Denominator66.0000076293945


Parameters (Session):
Parameters (R input):
R code (references can be found in the software module):
library('Kendall')
k <- Kendall(x,y)
bitmap(file='test1.png')
par(bg=rgb(0.2,0.4,0.6))
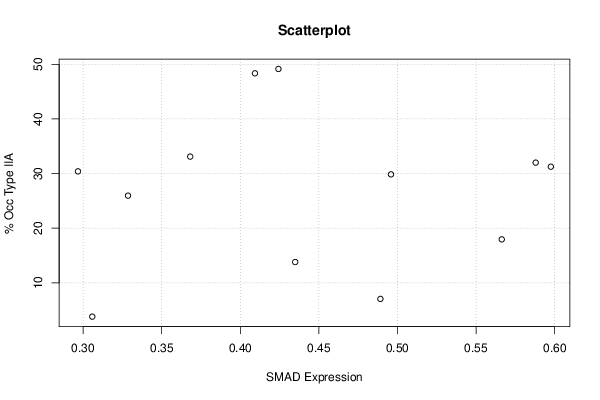
plot(x,y,main='Scatterplot',xlab=xlab,ylab=ylab)
grid()
dev.off()
bitmap(file='test2.png')
par(bg=rgb(0.2,0.4,0.6))
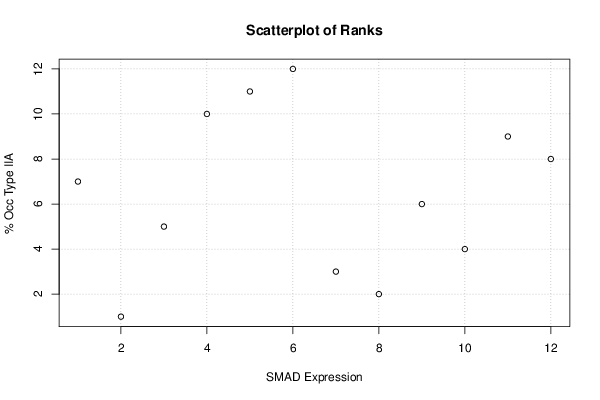
plot(rank(x),rank(y),main='Scatterplot of Ranks',xlab=xlab,ylab=ylab)
grid()
dev.off()
load(file='createtable')
a<-table.start()
a<-table.row.start(a)
a<-table.element(a,'Kendall tau Rank Correlation',2,TRUE)
a<-table.row.end(a)
a<-table.row.start(a)
a<-table.element(a,'Kendall tau',header=TRUE)
a<-table.element(a,k$tau)
a<-table.row.end(a)
a<-table.row.start(a)
a<-table.element(a,'2-sided p-value',header=TRUE)
a<-table.element(a,k$sl)
a<-table.row.end(a)
a<-table.row.start(a)
a<-table.element(a,'Score',header=TRUE)
a<-table.element(a,k$S)
a<-table.row.end(a)
a<-table.row.start(a)
a<-table.element(a,'Var(Score)',header=TRUE)
a<-table.element(a,k$varS)
a<-table.row.end(a)
a<-table.row.start(a)
a<-table.element(a,'Denominator',header=TRUE)
a<-table.element(a,k$D)
a<-table.row.end(a)
a<-table.end(a)
table.save(a,file='mytable.tab')