Free Statistics
of Irreproducible Research!
Description of Statistical Computation | |||||||||||||||||||||||||||||||||||||||||
|---|---|---|---|---|---|---|---|---|---|---|---|---|---|---|---|---|---|---|---|---|---|---|---|---|---|---|---|---|---|---|---|---|---|---|---|---|---|---|---|---|---|
| Author's title | |||||||||||||||||||||||||||||||||||||||||
| Author | *Unverified author* | ||||||||||||||||||||||||||||||||||||||||
| R Software Module | rwasp_univariatedataseries.wasp | ||||||||||||||||||||||||||||||||||||||||
| Title produced by software | Univariate Data Series | ||||||||||||||||||||||||||||||||||||||||
| Date of computation | Thu, 29 Jan 2015 19:51:07 +0000 | ||||||||||||||||||||||||||||||||||||||||
| Cite this page as follows | Statistical Computations at FreeStatistics.org, Office for Research Development and Education, URL https://freestatistics.org/blog/index.php?v=date/2015/Jan/29/t1422561390p116zewscl8y8ft.htm/, Retrieved Tue, 14 May 2024 09:24:19 +0000 | ||||||||||||||||||||||||||||||||||||||||
| Statistical Computations at FreeStatistics.org, Office for Research Development and Education, URL https://freestatistics.org/blog/index.php?pk=276286, Retrieved Tue, 14 May 2024 09:24:19 +0000 | |||||||||||||||||||||||||||||||||||||||||
| QR Codes: | |||||||||||||||||||||||||||||||||||||||||
|
| |||||||||||||||||||||||||||||||||||||||||
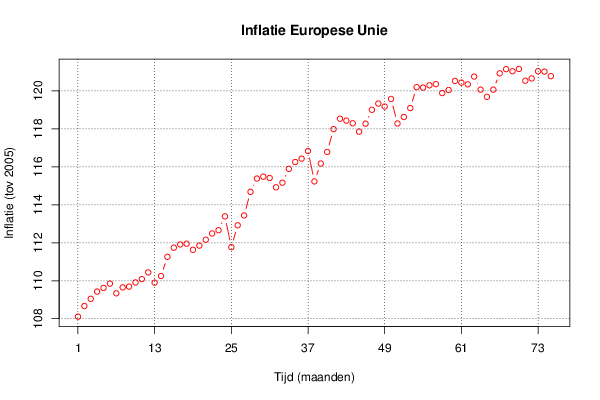
| Original text written by user: | Maandelijkse inflatie van de Europese Unie beginnend bij januari 2009 tot en met november 2014. | ||||||||||||||||||||||||||||||||||||||||
| IsPrivate? | No (this computation is public) | ||||||||||||||||||||||||||||||||||||||||
| User-defined keywords | |||||||||||||||||||||||||||||||||||||||||
| Estimated Impact | 113 | ||||||||||||||||||||||||||||||||||||||||
Tree of Dependent Computations | |||||||||||||||||||||||||||||||||||||||||
| Family? (F = Feedback message, R = changed R code, M = changed R Module, P = changed Parameters, D = changed Data) | |||||||||||||||||||||||||||||||||||||||||
| - [Univariate Data Series] [Inflatie Europese...] [2015-01-29 19:51:07] [d41d8cd98f00b204e9800998ecf8427e] [Current] - RMPD [Histogram] [Inflatie Europese...] [2015-02-05 14:07:34] [1dc675392156cd0c74d0fbdf42ba7cd5] - RMPD [Kernel Density Estimation] [Inflatie Europese...] [2015-02-05 14:19:42] [1dc675392156cd0c74d0fbdf42ba7cd5] | |||||||||||||||||||||||||||||||||||||||||
| Feedback Forum | |||||||||||||||||||||||||||||||||||||||||
Post a new message | |||||||||||||||||||||||||||||||||||||||||
Dataset | |||||||||||||||||||||||||||||||||||||||||
| Dataseries X: | |||||||||||||||||||||||||||||||||||||||||
108.11 108.67 109.05 109.43 109.62 109.85 109.34 109.65 109.69 109.91 110.09 110.44 109.9 110.25 111.26 111.74 111.91 111.95 111.63 111.85 112.16 112.49 112.66 113.39 111.77 112.92 113.44 114.68 115.38 115.48 115.41 114.92 115.16 115.89 116.25 116.43 116.83 115.23 116.17 116.78 117.98 118.53 118.43 118.29 117.85 118.27 119 119.33 119.17 119.57 118.28 118.62 119.09 120.19 120.17 120.29 120.35 119.88 120.04 120.52 120.43 120.34 120.75 120.06 119.68 120.06 120.92 121.14 121.03 121.15 120.53 120.65 121.03 121.01 120.77 | |||||||||||||||||||||||||||||||||||||||||
Tables (Output of Computation) | |||||||||||||||||||||||||||||||||||||||||
| |||||||||||||||||||||||||||||||||||||||||
Figures (Output of Computation) | |||||||||||||||||||||||||||||||||||||||||
Input Parameters & R Code | |||||||||||||||||||||||||||||||||||||||||
| Parameters (Session): | |||||||||||||||||||||||||||||||||||||||||
| par1 = Inflatie Europese Unie ; par4 = 12 ; | |||||||||||||||||||||||||||||||||||||||||
| Parameters (R input): | |||||||||||||||||||||||||||||||||||||||||
| par1 = Inflatie Europese Unie ; par2 = ; par3 = ; par4 = 12 ; | |||||||||||||||||||||||||||||||||||||||||
| R code (references can be found in the software module): | |||||||||||||||||||||||||||||||||||||||||
par4 <- '4' | |||||||||||||||||||||||||||||||||||||||||