Free Statistics
of Irreproducible Research!
Description of Statistical Computation | |||||||||||||||||||||||||||||||||||||||||
|---|---|---|---|---|---|---|---|---|---|---|---|---|---|---|---|---|---|---|---|---|---|---|---|---|---|---|---|---|---|---|---|---|---|---|---|---|---|---|---|---|---|
| Author's title | |||||||||||||||||||||||||||||||||||||||||
| Author | *Unverified author* | ||||||||||||||||||||||||||||||||||||||||
| R Software Module | rwasp_univariatedataseries.wasp | ||||||||||||||||||||||||||||||||||||||||
| Title produced by software | Univariate Data Series | ||||||||||||||||||||||||||||||||||||||||
| Date of computation | Thu, 29 Jan 2015 15:57:10 +0000 | ||||||||||||||||||||||||||||||||||||||||
| Cite this page as follows | Statistical Computations at FreeStatistics.org, Office for Research Development and Education, URL https://freestatistics.org/blog/index.php?v=date/2015/Jan/29/t1422547668popp4cy73025a62.htm/, Retrieved Tue, 14 May 2024 19:06:10 +0000 | ||||||||||||||||||||||||||||||||||||||||
| Statistical Computations at FreeStatistics.org, Office for Research Development and Education, URL https://freestatistics.org/blog/index.php?pk=276275, Retrieved Tue, 14 May 2024 19:06:10 +0000 | |||||||||||||||||||||||||||||||||||||||||
| QR Codes: | |||||||||||||||||||||||||||||||||||||||||
|
| |||||||||||||||||||||||||||||||||||||||||
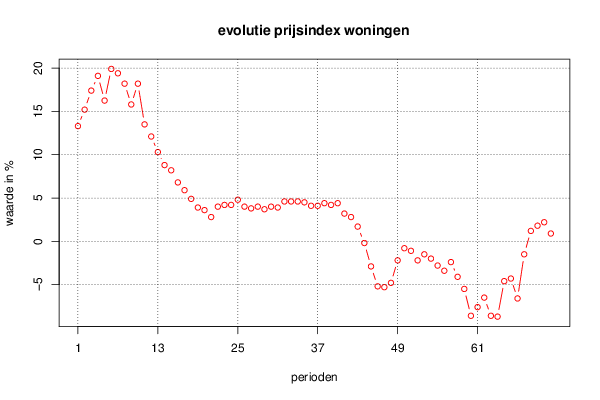
| Original text written by user: | Er zijn 72 perioden, de 1e periode staat voor het eerste kwartaal van 1999, soms geeft een periode een gemiddelde weer van de 4 kwartalen in een jaar. Maar bijna alle perioden staan voor een kwartaal van 1999 tot en met 2014. | ||||||||||||||||||||||||||||||||||||||||
| IsPrivate? | No (this computation is public) | ||||||||||||||||||||||||||||||||||||||||
| User-defined keywords | |||||||||||||||||||||||||||||||||||||||||
| Estimated Impact | 177 | ||||||||||||||||||||||||||||||||||||||||
Tree of Dependent Computations | |||||||||||||||||||||||||||||||||||||||||
| Family? (F = Feedback message, R = changed R code, M = changed R Module, P = changed Parameters, D = changed Data) | |||||||||||||||||||||||||||||||||||||||||
| - [Univariate Data Series] [Datareeks - prijs...] [2015-01-29 15:57:10] [24a1c9f91cd9dd71c8b0e9e460386711] [Current] - RMPD [Histogram] [frequentietabel c...] [2015-04-12 14:00:18] [32313e1485a196be6cd29129c21c8899] - R PD [Univariate Data Series] [opgave 2 stap 1 g...] [2015-04-12 15:39:13] [32313e1485a196be6cd29129c21c8899] - RMPD [Histogram] [opgave 2 stap 2 h...] [2015-04-12 15:46:58] [32313e1485a196be6cd29129c21c8899] - RMPD [Kernel Density Estimation] [opgave 2 stap 3(d...] [2015-04-12 16:08:32] [32313e1485a196be6cd29129c21c8899] - RMPD [Histogram] [opgave 2 oefening...] [2015-04-12 16:53:03] [32313e1485a196be6cd29129c21c8899] - RMPD [Kernel Density Estimation] [opgave 2 oefening...] [2015-04-12 17:13:05] [32313e1485a196be6cd29129c21c8899] - R PD [Univariate Data Series] [verbetering oef 1] [2015-05-26 17:01:41] [32313e1485a196be6cd29129c21c8899] | |||||||||||||||||||||||||||||||||||||||||
| Feedback Forum | |||||||||||||||||||||||||||||||||||||||||
Post a new message | |||||||||||||||||||||||||||||||||||||||||
Dataset | |||||||||||||||||||||||||||||||||||||||||
| Dataseries X: | |||||||||||||||||||||||||||||||||||||||||
13,3 15,2 17,4 19,1 16,25 19,9 19,4 18,2 15,8 18,2 13,5 12,1 10,3 8,8 8,2 6,8 5,9 4,9 3,9 3,6 2,8 4 4,2 4,2 4,8 4 3,8 4 3,7 4 3,9 4,6 4,6 4,6 4,5 4,1 4,1 4,4 4,2 4,4 3,2 2,8 1,7 -0,2 -2,9 -5,2 -5,3 -4,8 -2,2 -0,8 -1,1 -2,2 -1,5 -2 -2,8 -3,4 -2,4 -4,1 -5,5 -8,6 -7,6 -6,5 -8,6 -8,7 -4,6 -4,3 -6,6 -1,5 1,2 1,8 2,2 0,9 | |||||||||||||||||||||||||||||||||||||||||
Tables (Output of Computation) | |||||||||||||||||||||||||||||||||||||||||
| |||||||||||||||||||||||||||||||||||||||||
Figures (Output of Computation) | |||||||||||||||||||||||||||||||||||||||||
Input Parameters & R Code | |||||||||||||||||||||||||||||||||||||||||
| Parameters (Session): | |||||||||||||||||||||||||||||||||||||||||
| par1 = prijsindex woningen ; par2 = http://statline.cbs.nl/Statweb/publication/?DM=SLNL&PA=81886NED&D1=2&D2=0&D3=4,20-23,25-33,35-38,40-43,45-48,50-58,60-63,65-68,70-73,75-99&HDR=T,G1&STB=G2&VW=T ; par3 = De prijsindex van verkoopprijzen van woningen. ; par4 = 12 ; | |||||||||||||||||||||||||||||||||||||||||
| Parameters (R input): | |||||||||||||||||||||||||||||||||||||||||
| par1 = prijsindex woningen ; par2 = http://statline.cbs.nl/Statweb/publication/?DM=SLNL&PA=81886NED&D1=2&D2=0&D3=4,20-23,25-33,35-38,40-43,45-48,50-58,60-63,65-68,70-73,75-99&HDR=T,G1&STB=G2&VW=T ; par3 = De prijsindex van verkoopprijzen van woningen. ; par4 = 12 ; | |||||||||||||||||||||||||||||||||||||||||
| R code (references can be found in the software module): | |||||||||||||||||||||||||||||||||||||||||
if (par4 != 'No season') { | |||||||||||||||||||||||||||||||||||||||||