\begin{tabular}{lllllllll}
\hline
Summary of computational transaction \tabularnewline
Raw Input & view raw input (R code)  \tabularnewline
Raw Output & view raw output of R engine  \tabularnewline
Computing time & 1 seconds \tabularnewline
R Server & 'Gwilym Jenkins' @ jenkins.wessa.net \tabularnewline
\hline
\end{tabular}
%Source: https://freestatistics.org/blog/index.php?pk=276263&T=0
[TABLE]
[ROW][C]Summary of computational transaction[/C][/ROW]
[ROW][C]Raw Input[/C][C]view raw input (R code) [/C][/ROW]
[ROW][C]Raw Output[/C][C]view raw output of R engine [/C][/ROW]
[ROW][C]Computing time[/C][C]1 seconds[/C][/ROW]
[ROW][C]R Server[/C][C]'Gwilym Jenkins' @ jenkins.wessa.net[/C][/ROW]
[/TABLE]
Source: https://freestatistics.org/blog/index.php?pk=276263&T=0
If you paste this QR Code into your document, anyone with a smartphone or tablet will be able to scan it and view this table in a browser.
If you paste this QR Code into your document, anyone with a smartphone or tablet will be able to scan it and view this table in a browser.
If you paste this QR Code into your document, anyone with a smartphone or tablet will be able to scan it and view this table in a browser.
If you paste this QR Code into your document, anyone with a smartphone or tablet will be able to scan it and view this table in a browser.
If you paste this QR Code into your document, anyone with a smartphone or tablet will be able to scan it and view this table in a browser.
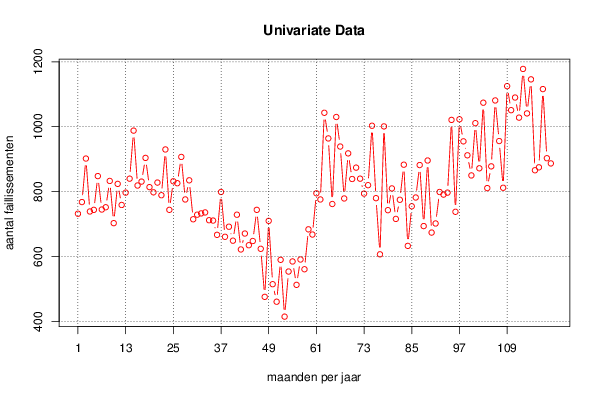
| Univariate Dataseries | | Name of dataseries | Faillissementen Belgi� | | Source | http://statline.cbs.nl/Statweb/publication/?DM=SLNL&PA=37289&D1=0,3-6&D2=187-189,191-193,195-197,199-201,204-206,208-210,212-214,216-218,221-223,225-227,229-231,233-235,238-240,242-244,246-248,250-252,255-257,259-261,263-265,267-269,272-274,276-278,280-282,284-286,289-291,293-295,297-299,301-303,306-308,310-312,314-316,318-320,323-325,327-329,331-333,335-337,340-356,360&HDR=T&STB=G1&VW=T | | Description | Faillissementen | | Number of observations | 120 |
\begin{tabular}{lllllllll}
\hline
Univariate Dataseries \tabularnewline
Name of dataseries & Faillissementen Belgi� \tabularnewline
Source & http://statline.cbs.nl/Statweb/publication/?DM=SLNL&PA=37289&D1=0,3-6&D2=187-189,191-193,195-197,199-201,204-206,208-210,212-214,216-218,221-223,225-227,229-231,233-235,238-240,242-244,246-248,250-252,255-257,259-261,263-265,267-269,272-274,276-278,280-282,284-286,289-291,293-295,297-299,301-303,306-308,310-312,314-316,318-320,323-325,327-329,331-333,335-337,340-356,360&HDR=T&STB=G1&VW=T \tabularnewline
Description & Faillissementen \tabularnewline
Number of observations & 120 \tabularnewline
\hline
\end{tabular}
%Source: https://freestatistics.org/blog/index.php?pk=276263&T=1
[TABLE]
[ROW][C]Univariate Dataseries[/C][/ROW]
[ROW][C]Name of dataseries[/C][C]Faillissementen Belgi�[/C][/ROW]
[ROW][C]Source[/C][C]http://statline.cbs.nl/Statweb/publication/?DM=SLNL&PA=37289&D1=0,3-6&D2=187-189,191-193,195-197,199-201,204-206,208-210,212-214,216-218,221-223,225-227,229-231,233-235,238-240,242-244,246-248,250-252,255-257,259-261,263-265,267-269,272-274,276-278,280-282,284-286,289-291,293-295,297-299,301-303,306-308,310-312,314-316,318-320,323-325,327-329,331-333,335-337,340-356,360&HDR=T&STB=G1&VW=T[/C][/ROW]
[ROW][C]Description[/C][C]Faillissementen[/C][/ROW]
[ROW][C]Number of observations[/C][C]120[/C][/ROW]
[/TABLE]
Source: https://freestatistics.org/blog/index.php?pk=276263&T=1
Globally Unique Identifier (entire table): ba.freestatistics.org/blog/index.php?pk=276263&T=1
As an alternative you can also use a QR Code:
The GUIDs for individual cells are displayed in the table below:
| Univariate Dataseries | | Name of dataseries | Faillissementen Belgi� | | Source | http://statline.cbs.nl/Statweb/publication/?DM=SLNL&PA=37289&D1=0,3-6&D2=187-189,191-193,195-197,199-201,204-206,208-210,212-214,216-218,221-223,225-227,229-231,233-235,238-240,242-244,246-248,250-252,255-257,259-261,263-265,267-269,272-274,276-278,280-282,284-286,289-291,293-295,297-299,301-303,306-308,310-312,314-316,318-320,323-325,327-329,331-333,335-337,340-356,360&HDR=T&STB=G1&VW=T | | Description | Faillissementen | | Number of observations | 120 |
If you paste this QR Code into your document, anyone with a smartphone or tablet will be able to scan it and view this table in a browser.
If you paste this QR Code into your document, anyone with a smartphone or tablet will be able to scan it and view this table in a browser.
If you paste this QR Code into your document, anyone with a smartphone or tablet will be able to scan it and view this table in a browser.
If you paste this QR Code into your document, anyone with a smartphone or tablet will be able to scan it and view this table in a browser.
If you paste this QR Code into your document, anyone with a smartphone or tablet will be able to scan it and view this table in a browser.
|