Free Statistics

of Irreproducible Research!

Author's title

Author*Unverified author*
R Software Modulerwasp_univariatedataseries.wasp
Title produced by softwareUnivariate Data Series
Date of computationThu, 29 Jan 2015 11:21:11 +0000
Cite this page as followsStatistical Computations at FreeStatistics.org, Office for Research Development and Education, URL https://freestatistics.org/blog/index.php?v=date/2015/Jan/29/t1422530568goljm1g7b4wxc39.htm/, Retrieved Tue, 14 May 2024 19:43:45 +0000
Statistical Computations at FreeStatistics.org, Office for Research Development and Education, URL https://freestatistics.org/blog/index.php?pk=276256, Retrieved Tue, 14 May 2024 19:43:45 +0000
QR Codes:

Original text written by user:
IsPrivate?No (this computation is public)
User-defined keywords
Estimated Impact148
Family? (F = Feedback message, R = changed R code, M = changed R Module, P = changed Parameters, D = changed Data)
-     [Univariate Data Series] [] [2015-01-27 19:13:00] [0a9b56ee93906152b692c736ff522be7]
- R PD    [Univariate Data Series] [] [2015-01-29 11:21:11] [4fa22ecf638daf61dea82ccfb30e12bf] [Current]
Feedback Forum

Post a new message
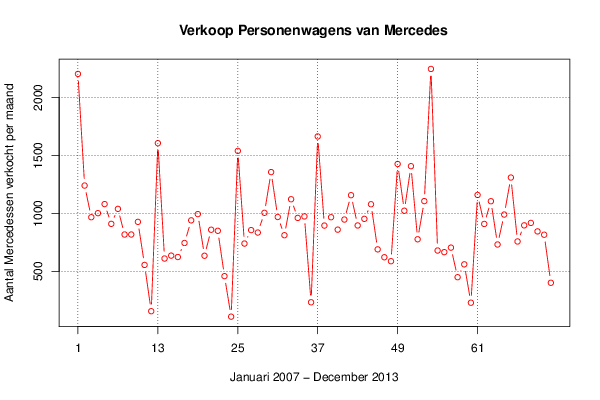
Dataseries X:
2201
1239
966
1001
1079
909
1038
817
817
926
555
156
1604
610
635
623
744
939
993
634
858
849
458
109
1538
739
855
834
1004
1355
968
811
1121
960
973
233
1662
894
966
859
946
1156
895
952
1078
689
621
587
1425
1022
1406
776
1105
2244
679
665
704
449
560
229
1158
908
1104
731
989
1308
757
896
917
844
815
401


Summary of computational transaction
Raw Inputview raw input (R code)
Raw Outputview raw output of R engine
Computing time1 seconds
R Server'Gwilym Jenkins' @ jenkins.wessa.net

\begin{tabular}{lllllllll}
\hline
Summary of computational transaction \tabularnewline
Raw Input & view raw input (R code)  \tabularnewline
Raw Output & view raw output of R engine  \tabularnewline
Computing time & 1 seconds \tabularnewline
R Server & 'Gwilym Jenkins' @ jenkins.wessa.net \tabularnewline
\hline
\end{tabular}
%Source: https://freestatistics.org/blog/index.php?pk=276256&T=0

[TABLE]
[ROW][C]Summary of computational transaction[/C][/ROW]
[ROW][C]Raw Input[/C][C]view raw input (R code) [/C][/ROW]
[ROW][C]Raw Output[/C][C]view raw output of R engine [/C][/ROW]
[ROW][C]Computing time[/C][C]1 seconds[/C][/ROW]
[ROW][C]R Server[/C][C]'Gwilym Jenkins' @ jenkins.wessa.net[/C][/ROW]
[/TABLE]
Source: https://freestatistics.org/blog/index.php?pk=276256&T=0

Globally Unique Identifier (entire table): ba.freestatistics.org/blog/index.php?pk=276256&T=0

As an alternative you can also use a QR Code:  

The GUIDs for individual cells are displayed in the table below:

Summary of computational transaction
Raw Inputview raw input (R code)
Raw Outputview raw output of R engine
Computing time1 seconds
R Server'Gwilym Jenkins' @ jenkins.wessa.net


Univariate Dataseries
Name of dataseriesVerkoop aantal nieuwe personenwagens Mercedes in Nederland
SourceCBS
DescriptionAantal verkochte nieuwe wagens van Mercedes
Number of observations72

\begin{tabular}{lllllllll}
\hline
Univariate Dataseries \tabularnewline
Name of dataseries & Verkoop aantal nieuwe personenwagens Mercedes in Nederland \tabularnewline
Source & CBS \tabularnewline
Description & Aantal verkochte nieuwe wagens van Mercedes \tabularnewline
Number of observations & 72 \tabularnewline
\hline
\end{tabular}
%Source: https://freestatistics.org/blog/index.php?pk=276256&T=1

[TABLE]
[ROW][C]Univariate Dataseries[/C][/ROW]
[ROW][C]Name of dataseries[/C][C]Verkoop aantal nieuwe personenwagens Mercedes in Nederland[/C][/ROW]
[ROW][C]Source[/C][C]CBS[/C][/ROW]
[ROW][C]Description[/C][C]Aantal verkochte nieuwe wagens van Mercedes[/C][/ROW]
[ROW][C]Number of observations[/C][C]72[/C][/ROW]
[/TABLE]
Source: https://freestatistics.org/blog/index.php?pk=276256&T=1

Globally Unique Identifier (entire table): ba.freestatistics.org/blog/index.php?pk=276256&T=1

As an alternative you can also use a QR Code:  

The GUIDs for individual cells are displayed in the table below:

Univariate Dataseries
Name of dataseriesVerkoop aantal nieuwe personenwagens Mercedes in Nederland
SourceCBS
DescriptionAantal verkochte nieuwe wagens van Mercedes
Number of observations72


Parameters (Session):
par1 = Verkoop aantal nieuwe personenwagens Mercedes in Nederland ; par2 = CBS ; par3 = Aantal verkochte nieuwe wagens van Mercedes ; par4 = 12 ;
Parameters (R input):
par1 = Verkoop aantal nieuwe personenwagens Mercedes in Nederland ; par2 = CBS ; par3 = Aantal verkochte nieuwe wagens van Mercedes ; par4 = 12 ;
R code (references can be found in the software module):
par4 <- '12'
par3 <- 'Aantal verkochte nieuwe wagens van Mercedes'
par2 <- 'CBS'
par1 <- 'Verkoop aantal nieuwe personenwagens Mercedes in Nederland'
if (par4 != 'No season') {
par4 <- as.numeric(par4)
if (par4 < 4) par4 <- 12
}
summary(x)
n <- length(x)
bitmap(file='test1.png')
if (par4=='No season') {
plot(x,col=2,type='b',main=main,xlab=xlab,ylab=ylab,xaxt='n')
axis(1,at=seq(1,n,10))
}
if (par4!='No season') {
plot(x,col=2,type='b',main=main,xlab=xlab,ylab=ylab,xaxt='n')
axis(1,at=seq(1,n,par4))
grid(nx=0,ny=NULL,col='black')
abline(v=seq(1,n,par4),col='black',lty='dotted')
}
dev.off()
load(file='createtable')
a<-table.start()
a<-table.row.start(a)
a<-table.element(a,'Univariate Dataseries',2,TRUE)
a<-table.row.end(a)
a<-table.row.start(a)
a<-table.element(a,'Name of dataseries',header=TRUE)
a<-table.element(a,par1)
a<-table.row.end(a)
a<-table.row.start(a)
a<-table.element(a,'Source',header=TRUE)
a<-table.element(a,par2)
a<-table.row.end(a)
a<-table.row.start(a)
a<-table.element(a,'Description',header=TRUE)
a<-table.element(a,par3)
a<-table.row.end(a)
a<-table.row.start(a)
a<-table.element(a,'Number of observations',header=TRUE)
a<-table.element(a,length(x))
a<-table.row.end(a)
a<-table.end(a)
table.save(a,file='mytable.tab')