Free Statistics
of Irreproducible Research!
Description of Statistical Computation | |||||||||||||||||||||||||||||||||||||||||
|---|---|---|---|---|---|---|---|---|---|---|---|---|---|---|---|---|---|---|---|---|---|---|---|---|---|---|---|---|---|---|---|---|---|---|---|---|---|---|---|---|---|
| Author's title | |||||||||||||||||||||||||||||||||||||||||
| Author | *Unverified author* | ||||||||||||||||||||||||||||||||||||||||
| R Software Module | rwasp_univariatedataseries.wasp | ||||||||||||||||||||||||||||||||||||||||
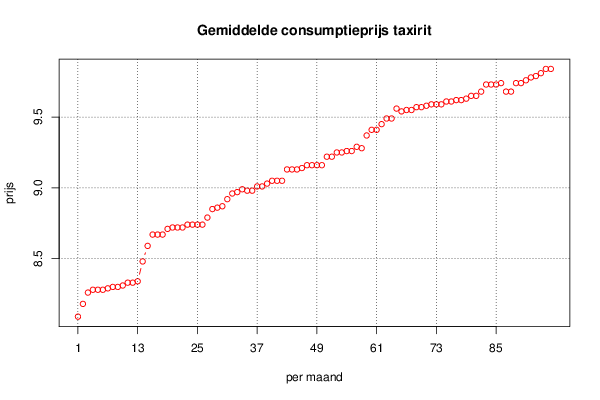
| Title produced by software | Univariate Data Series | ||||||||||||||||||||||||||||||||||||||||
| Date of computation | Wed, 28 Jan 2015 20:21:49 +0000 | ||||||||||||||||||||||||||||||||||||||||
| Cite this page as follows | Statistical Computations at FreeStatistics.org, Office for Research Development and Education, URL https://freestatistics.org/blog/index.php?v=date/2015/Jan/28/t1422477172tnlhg8wxtxfh98s.htm/, Retrieved Tue, 14 May 2024 22:17:40 +0000 | ||||||||||||||||||||||||||||||||||||||||
| Statistical Computations at FreeStatistics.org, Office for Research Development and Education, URL https://freestatistics.org/blog/index.php?pk=276233, Retrieved Tue, 14 May 2024 22:17:40 +0000 | |||||||||||||||||||||||||||||||||||||||||
| QR Codes: | |||||||||||||||||||||||||||||||||||||||||
|
| |||||||||||||||||||||||||||||||||||||||||
| Original text written by user: | |||||||||||||||||||||||||||||||||||||||||
| IsPrivate? | No (this computation is public) | ||||||||||||||||||||||||||||||||||||||||
| User-defined keywords | |||||||||||||||||||||||||||||||||||||||||
| Estimated Impact | 178 | ||||||||||||||||||||||||||||||||||||||||
Tree of Dependent Computations | |||||||||||||||||||||||||||||||||||||||||
| Family? (F = Feedback message, R = changed R code, M = changed R Module, P = changed Parameters, D = changed Data) | |||||||||||||||||||||||||||||||||||||||||
| - [Univariate Data Series] [gemiddelde consum...] [2015-01-28 20:21:49] [7657461249ddfb44f7ff766614f926c4] [Current] - RMPD [Histogram] [frequentietabel e...] [2015-02-05 09:50:43] [526168b572a4be8c1b9324381937969b] - RMPD [Kernel Density Estimation] [dichtheidstabel e...] [2015-02-05 09:57:53] [526168b572a4be8c1b9324381937969b] - RMPD [Quartiles] [] [2015-02-12 14:15:22] [526168b572a4be8c1b9324381937969b] - RMPD [Notched Boxplots] [] [2015-02-12 14:18:53] [526168b572a4be8c1b9324381937969b] - RMPD [Harrell-Davis Quantiles] [decielen] [2015-02-12 14:50:10] [526168b572a4be8c1b9324381937969b] - RMPD [Harrell-Davis Quantiles] [percentielen] [2015-02-12 14:52:31] [526168b572a4be8c1b9324381937969b] - RMPD [Harrell-Davis Quantiles] [] [2015-02-12 14:59:09] [526168b572a4be8c1b9324381937969b] - RMPD [Harrell-Davis Quantiles] [] [2015-02-12 15:01:09] [526168b572a4be8c1b9324381937969b] | |||||||||||||||||||||||||||||||||||||||||
| Feedback Forum | |||||||||||||||||||||||||||||||||||||||||
Post a new message | |||||||||||||||||||||||||||||||||||||||||
Dataset | |||||||||||||||||||||||||||||||||||||||||
| Dataseries X: | |||||||||||||||||||||||||||||||||||||||||
8,09 8,18 8,26 8,28 8,28 8,28 8,29 8,3 8,3 8,31 8,33 8,33 8,34 8,48 8,59 8,67 8,67 8,67 8,71 8,72 8,72 8,72 8,74 8,74 8,74 8,74 8,79 8,85 8,86 8,87 8,92 8,96 8,97 8,99 8,98 8,98 9,01 9,01 9,03 9,05 9,05 9,05 9,13 9,13 9,13 9,14 9,16 9,16 9,16 9,16 9,22 9,22 9,25 9,25 9,26 9,26 9,29 9,28 9,37 9,41 9,41 9,45 9,49 9,49 9,56 9,54 9,55 9,55 9,57 9,57 9,58 9,59 9,59 9,59 9,61 9,61 9,62 9,62 9,63 9,65 9,65 9,68 9,73 9,73 9,73 9,74 9,68 9,68 9,74 9,74 9,76 9,78 9,79 9,81 9,84 9,84 | |||||||||||||||||||||||||||||||||||||||||
Tables (Output of Computation) | |||||||||||||||||||||||||||||||||||||||||
| |||||||||||||||||||||||||||||||||||||||||
Figures (Output of Computation) | |||||||||||||||||||||||||||||||||||||||||
Input Parameters & R Code | |||||||||||||||||||||||||||||||||||||||||
| Parameters (Session): | |||||||||||||||||||||||||||||||||||||||||
| par1 = gemiddelde consumptieprijs van een taxirit ; par2 = http://www.nbb.be/belgostat/PublicatieSelectieLinker?LinkID=696000083|910000082&Lang=N ; par3 = je ziet de gemiddelde prijs van een taxirit, per maand, vanaf januari 2006 tot december 2013 ; par4 = 12 ; | |||||||||||||||||||||||||||||||||||||||||
| Parameters (R input): | |||||||||||||||||||||||||||||||||||||||||
| par1 = gemiddelde consumptieprijs van een taxirit ; par2 = http://www.nbb.be/belgostat/PublicatieSelectieLinker?LinkID=696000083|910000082&Lang=N ; par3 = je ziet de gemiddelde prijs van een taxirit, per maand, vanaf januari 2006 tot december 2013 ; par4 = 12 ; | |||||||||||||||||||||||||||||||||||||||||
| R code (references can be found in the software module): | |||||||||||||||||||||||||||||||||||||||||
if (par4 != 'No season') { | |||||||||||||||||||||||||||||||||||||||||