Free Statistics
of Irreproducible Research!
Description of Statistical Computation | |||||||||||||||||||||||||||||||||||||||||
|---|---|---|---|---|---|---|---|---|---|---|---|---|---|---|---|---|---|---|---|---|---|---|---|---|---|---|---|---|---|---|---|---|---|---|---|---|---|---|---|---|---|
| Author's title | |||||||||||||||||||||||||||||||||||||||||
| Author | *Unverified author* | ||||||||||||||||||||||||||||||||||||||||
| R Software Module | rwasp_univariatedataseries.wasp | ||||||||||||||||||||||||||||||||||||||||
| Title produced by software | Univariate Data Series | ||||||||||||||||||||||||||||||||||||||||
| Date of computation | Wed, 28 Jan 2015 19:03:40 +0000 | ||||||||||||||||||||||||||||||||||||||||
| Cite this page as follows | Statistical Computations at FreeStatistics.org, Office for Research Development and Education, URL https://freestatistics.org/blog/index.php?v=date/2015/Jan/28/t1422471882c23no8e1pf39oin.htm/, Retrieved Tue, 14 May 2024 11:43:38 +0000 | ||||||||||||||||||||||||||||||||||||||||
| Statistical Computations at FreeStatistics.org, Office for Research Development and Education, URL https://freestatistics.org/blog/index.php?pk=276232, Retrieved Tue, 14 May 2024 11:43:38 +0000 | |||||||||||||||||||||||||||||||||||||||||
| QR Codes: | |||||||||||||||||||||||||||||||||||||||||
|
| |||||||||||||||||||||||||||||||||||||||||
| Original text written by user: | |||||||||||||||||||||||||||||||||||||||||
| IsPrivate? | No (this computation is public) | ||||||||||||||||||||||||||||||||||||||||
| User-defined keywords | |||||||||||||||||||||||||||||||||||||||||
| Estimated Impact | 169 | ||||||||||||||||||||||||||||||||||||||||
Tree of Dependent Computations | |||||||||||||||||||||||||||||||||||||||||
| Family? (F = Feedback message, R = changed R code, M = changed R Module, P = changed Parameters, D = changed Data) | |||||||||||||||||||||||||||||||||||||||||
| - [Univariate Data Series] [Invoerwaarde energie] [2015-01-28 19:03:40] [d41d8cd98f00b204e9800998ecf8427e] [Current] - RMPD [Histogram] [Invoerwaarde energie] [2015-02-04 20:43:22] [2b6ff024fd3148867a6b3172f7221ef4] - RMPD [Kernel Density Estimation] [Invoerwaarde energie] [2015-02-04 20:57:08] [2b6ff024fd3148867a6b3172f7221ef4] | |||||||||||||||||||||||||||||||||||||||||
| Feedback Forum | |||||||||||||||||||||||||||||||||||||||||
Post a new message | |||||||||||||||||||||||||||||||||||||||||
Dataset | |||||||||||||||||||||||||||||||||||||||||
| Dataseries X: | |||||||||||||||||||||||||||||||||||||||||
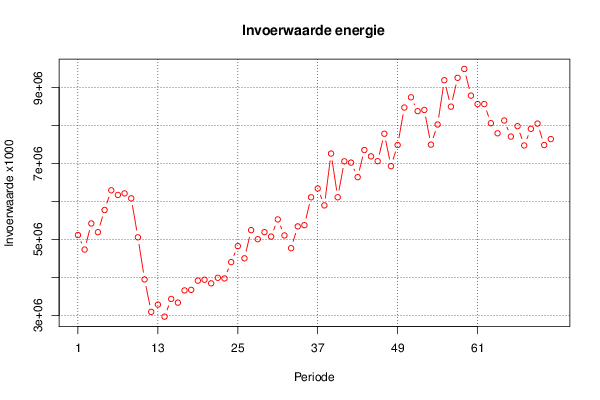
5 119 676 4 737 614 5 425 255 5 195 396 5 779 583 6 298 652 6 175 944 6 217 653 6 086 619 5 060 250 3 950 207 3 096 398 3 287 215 2 970 037 3 436 547 3 339 099 3 661 160 3 675 026 3 917 675 3 942 501 3 848 079 3 993 974 3 977 059 4 406 890 4 827 736 4 507 189 5 249 062 5 009 908 5 195 771 5 079 423 5 531 062 5 109 363 4 773 753 5 347 125 5 379 543 6 114 549 6 346 091 5 900 935 7 265 533 6 115 096 7 062 343 7 027 841 6 644 644 7 359 822 7 192 534 7 065 705 7 788 175 6 934 803 7 492 202 8 478 866 8 748 316 8 382 956 8 414 863 7 501 787 8 031 203 9 198 243 8 500 998 9 260 617 9 494 903 8 791 918 8 568 871 8 570 003 8 066 695 7 800 532 8 136 832 7 713 840 7 986 953 7 479 868 7 917 564 8 055 845 7 490 221 7 648 110 | |||||||||||||||||||||||||||||||||||||||||
Tables (Output of Computation) | |||||||||||||||||||||||||||||||||||||||||
| |||||||||||||||||||||||||||||||||||||||||
Figures (Output of Computation) | |||||||||||||||||||||||||||||||||||||||||
Input Parameters & R Code | |||||||||||||||||||||||||||||||||||||||||
| Parameters (Session): | |||||||||||||||||||||||||||||||||||||||||
| par1 = Invoerswaarde energie ; par2 = Statline CBS ; par3 = Invoerswaarde energie op de handelsbalans ; par4 = 12 ; | |||||||||||||||||||||||||||||||||||||||||
| Parameters (R input): | |||||||||||||||||||||||||||||||||||||||||
| par1 = Invoerswaarde energie ; par2 = Statline CBS ; par3 = Invoerswaarde energie op de handelsbalans ; par4 = 12 ; | |||||||||||||||||||||||||||||||||||||||||
| R code (references can be found in the software module): | |||||||||||||||||||||||||||||||||||||||||
if (par4 != 'No season') { | |||||||||||||||||||||||||||||||||||||||||