Free Statistics
of Irreproducible Research!
Description of Statistical Computation | |||||||||||||||||||||||||||||||||||||||||
|---|---|---|---|---|---|---|---|---|---|---|---|---|---|---|---|---|---|---|---|---|---|---|---|---|---|---|---|---|---|---|---|---|---|---|---|---|---|---|---|---|---|
| Author's title | |||||||||||||||||||||||||||||||||||||||||
| Author | *Unverified author* | ||||||||||||||||||||||||||||||||||||||||
| R Software Module | rwasp_univariatedataseries.wasp | ||||||||||||||||||||||||||||||||||||||||
| Title produced by software | Univariate Data Series | ||||||||||||||||||||||||||||||||||||||||
| Date of computation | Wed, 28 Jan 2015 18:41:54 +0000 | ||||||||||||||||||||||||||||||||||||||||
| Cite this page as follows | Statistical Computations at FreeStatistics.org, Office for Research Development and Education, URL https://freestatistics.org/blog/index.php?v=date/2015/Jan/28/t14224713386tky1qphf2zs30s.htm/, Retrieved Tue, 14 May 2024 05:01:49 +0000 | ||||||||||||||||||||||||||||||||||||||||
| Statistical Computations at FreeStatistics.org, Office for Research Development and Education, URL https://freestatistics.org/blog/index.php?pk=276230, Retrieved Tue, 14 May 2024 05:01:49 +0000 | |||||||||||||||||||||||||||||||||||||||||
| QR Codes: | |||||||||||||||||||||||||||||||||||||||||
|
| |||||||||||||||||||||||||||||||||||||||||
| Original text written by user: | |||||||||||||||||||||||||||||||||||||||||
| IsPrivate? | No (this computation is public) | ||||||||||||||||||||||||||||||||||||||||
| User-defined keywords | |||||||||||||||||||||||||||||||||||||||||
| Estimated Impact | 154 | ||||||||||||||||||||||||||||||||||||||||
Tree of Dependent Computations | |||||||||||||||||||||||||||||||||||||||||
| Family? (F = Feedback message, R = changed R code, M = changed R Module, P = changed Parameters, D = changed Data) | |||||||||||||||||||||||||||||||||||||||||
| - [Univariate Data Series] [] [2015-01-28 18:41:54] [70e23d918d09c907c02097a361cd6415] [Current] | |||||||||||||||||||||||||||||||||||||||||
| Feedback Forum | |||||||||||||||||||||||||||||||||||||||||
Post a new message | |||||||||||||||||||||||||||||||||||||||||
Dataset | |||||||||||||||||||||||||||||||||||||||||
| Dataseries X: | |||||||||||||||||||||||||||||||||||||||||
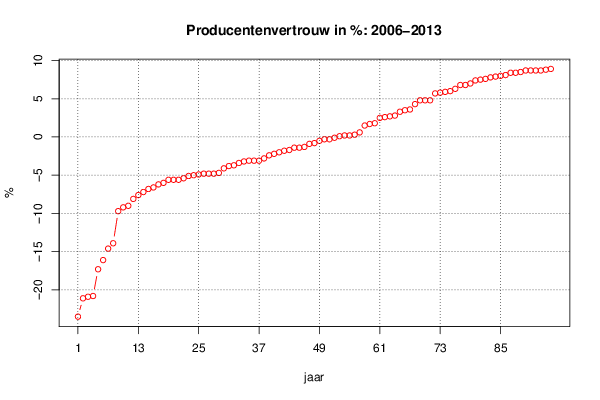
-23,5 -21,1 -20,9 -20,8 -17,3 -16,1 -14,6 -13,9 -9,7 -9,2 -9 -8,1 -7,6 -7,2 -6,8 -6,6 -6,2 -6 -5,6 -5,6 -5,6 -5,4 -5,1 -5 -4,9 -4,8 -4,8 -4,8 -4,7 -4,1 -3,8 -3,7 -3,4 -3,2 -3,1 -3,1 -3,1 -2,8 -2,4 -2,2 -2 -1,8 -1,7 -1,4 -1,4 -1,3 -0,9 -0,8 -0,5 -0,3 -0,3 -0,1 0,1 0,2 0,2 0,3 0,6 1,5 1,7 1,8 2,5 2,6 2,7 2,8 3,3 3,5 3,6 4,3 4,8 4,8 4,8 5,7 5,8 5,9 6 6,3 6,8 6,8 7 7,4 7,5 7,6 7,8 7,9 8 8,1 8,4 8,4 8,5 8,7 8,7 8,7 8,7 8,8 8,9 | |||||||||||||||||||||||||||||||||||||||||
Tables (Output of Computation) | |||||||||||||||||||||||||||||||||||||||||
| |||||||||||||||||||||||||||||||||||||||||
Figures (Output of Computation) | |||||||||||||||||||||||||||||||||||||||||
Input Parameters & R Code | |||||||||||||||||||||||||||||||||||||||||
| Parameters (Session): | |||||||||||||||||||||||||||||||||||||||||
| par1 = Producentenvertrouw ; par2 = www.cbs.nl ; par3 = Het vertrouwen dat de producenten hebben in de economie ; par4 = 12 ; | |||||||||||||||||||||||||||||||||||||||||
| Parameters (R input): | |||||||||||||||||||||||||||||||||||||||||
| par1 = Producentenvertrouw ; par2 = www.cbs.nl ; par3 = Het vertrouwen dat de producenten hebben in de economie ; par4 = 12 ; | |||||||||||||||||||||||||||||||||||||||||
| R code (references can be found in the software module): | |||||||||||||||||||||||||||||||||||||||||
if (par4 != 'No season') { | |||||||||||||||||||||||||||||||||||||||||