\begin{tabular}{lllllllll}
\hline
Summary of computational transaction \tabularnewline
Raw Input & view raw input (R code)  \tabularnewline
Raw Output & view raw output of R engine  \tabularnewline
Computing time & 1 seconds \tabularnewline
R Server & 'Sir Maurice George Kendall' @ kendall.wessa.net \tabularnewline
\hline
\end{tabular}
%Source: https://freestatistics.org/blog/index.php?pk=276226&T=0
[TABLE]
[ROW][C]Summary of computational transaction[/C][/ROW]
[ROW][C]Raw Input[/C][C]view raw input (R code) [/C][/ROW]
[ROW][C]Raw Output[/C][C]view raw output of R engine [/C][/ROW]
[ROW][C]Computing time[/C][C]1 seconds[/C][/ROW]
[ROW][C]R Server[/C][C]'Sir Maurice George Kendall' @ kendall.wessa.net[/C][/ROW]
[/TABLE]
Source: https://freestatistics.org/blog/index.php?pk=276226&T=0
If you paste this QR Code into your document, anyone with a smartphone or tablet will be able to scan it and view this table in a browser.
If you paste this QR Code into your document, anyone with a smartphone or tablet will be able to scan it and view this table in a browser.
If you paste this QR Code into your document, anyone with a smartphone or tablet will be able to scan it and view this table in a browser.
If you paste this QR Code into your document, anyone with a smartphone or tablet will be able to scan it and view this table in a browser.
If you paste this QR Code into your document, anyone with a smartphone or tablet will be able to scan it and view this table in a browser.
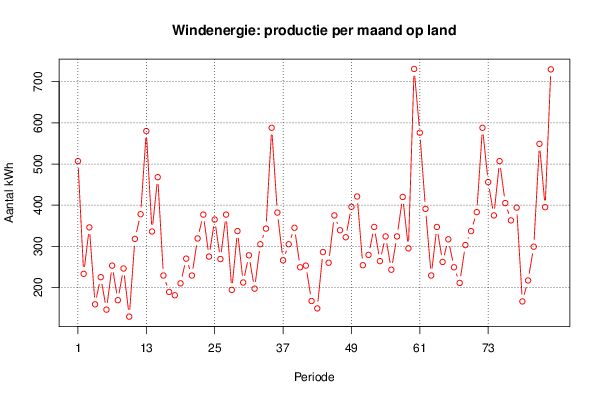
| Univariate Dataseries | | Name of dataseries | Windenergie: productie per maand op land | | Source | http://statline.cbs.nl/Statweb/publication/?DM=SLNL&PA=70802ned&D1=0&D2=a&D3=85-87,89-91,93-95,97-99,102-104,106-108,110-112,114-116,119-121,123-125,127-129,131-133,136-138,140-142,144-146,148-150,153-155,157-159,161-163,165-167,170-172,174-176,178-180,182-184,187-189,191-193,195-197,199-201&HDR=T,G1&STB=G2&VW=T | | Description | Deze gegevensreeks stelt het aantal geproduceerde kWh voor in miljoenen per maand op het land. De gegevensreeks loopt van januari 2007 tot december 2013 | | Number of observations | 84 |
\begin{tabular}{lllllllll}
\hline
Univariate Dataseries \tabularnewline
Name of dataseries & Windenergie: productie per maand op land \tabularnewline
Source & http://statline.cbs.nl/Statweb/publication/?DM=SLNL&PA=70802ned&D1=0&D2=a&D3=85-87,89-91,93-95,97-99,102-104,106-108,110-112,114-116,119-121,123-125,127-129,131-133,136-138,140-142,144-146,148-150,153-155,157-159,161-163,165-167,170-172,174-176,178-180,182-184,187-189,191-193,195-197,199-201&HDR=T,G1&STB=G2&VW=T \tabularnewline
Description & Deze gegevensreeks stelt het aantal geproduceerde kWh voor in miljoenen per maand op het land. De gegevensreeks loopt van januari 2007 tot december 2013  \tabularnewline
Number of observations & 84 \tabularnewline
\hline
\end{tabular}
%Source: https://freestatistics.org/blog/index.php?pk=276226&T=1
[TABLE]
[ROW][C]Univariate Dataseries[/C][/ROW]
[ROW][C]Name of dataseries[/C][C]Windenergie: productie per maand op land[/C][/ROW]
[ROW][C]Source[/C][C]http://statline.cbs.nl/Statweb/publication/?DM=SLNL&PA=70802ned&D1=0&D2=a&D3=85-87,89-91,93-95,97-99,102-104,106-108,110-112,114-116,119-121,123-125,127-129,131-133,136-138,140-142,144-146,148-150,153-155,157-159,161-163,165-167,170-172,174-176,178-180,182-184,187-189,191-193,195-197,199-201&HDR=T,G1&STB=G2&VW=T[/C][/ROW]
[ROW][C]Description[/C][C]Deze gegevensreeks stelt het aantal geproduceerde kWh voor in miljoenen per maand op het land. De gegevensreeks loopt van januari 2007 tot december 2013 [/C][/ROW]
[ROW][C]Number of observations[/C][C]84[/C][/ROW]
[/TABLE]
Source: https://freestatistics.org/blog/index.php?pk=276226&T=1
Globally Unique Identifier (entire table): ba.freestatistics.org/blog/index.php?pk=276226&T=1
As an alternative you can also use a QR Code:
The GUIDs for individual cells are displayed in the table below:
| Univariate Dataseries | | Name of dataseries | Windenergie: productie per maand op land | | Source | http://statline.cbs.nl/Statweb/publication/?DM=SLNL&PA=70802ned&D1=0&D2=a&D3=85-87,89-91,93-95,97-99,102-104,106-108,110-112,114-116,119-121,123-125,127-129,131-133,136-138,140-142,144-146,148-150,153-155,157-159,161-163,165-167,170-172,174-176,178-180,182-184,187-189,191-193,195-197,199-201&HDR=T,G1&STB=G2&VW=T | | Description | Deze gegevensreeks stelt het aantal geproduceerde kWh voor in miljoenen per maand op het land. De gegevensreeks loopt van januari 2007 tot december 2013 | | Number of observations | 84 |
If you paste this QR Code into your document, anyone with a smartphone or tablet will be able to scan it and view this table in a browser.
If you paste this QR Code into your document, anyone with a smartphone or tablet will be able to scan it and view this table in a browser.
If you paste this QR Code into your document, anyone with a smartphone or tablet will be able to scan it and view this table in a browser.
If you paste this QR Code into your document, anyone with a smartphone or tablet will be able to scan it and view this table in a browser.
If you paste this QR Code into your document, anyone with a smartphone or tablet will be able to scan it and view this table in a browser.
|