Free Statistics
of Irreproducible Research!
Description of Statistical Computation | |||||||||||||||||||||||||||||||||||||||||
|---|---|---|---|---|---|---|---|---|---|---|---|---|---|---|---|---|---|---|---|---|---|---|---|---|---|---|---|---|---|---|---|---|---|---|---|---|---|---|---|---|---|
| Author's title | |||||||||||||||||||||||||||||||||||||||||
| Author | *Unverified author* | ||||||||||||||||||||||||||||||||||||||||
| R Software Module | rwasp_univariatedataseries.wasp | ||||||||||||||||||||||||||||||||||||||||
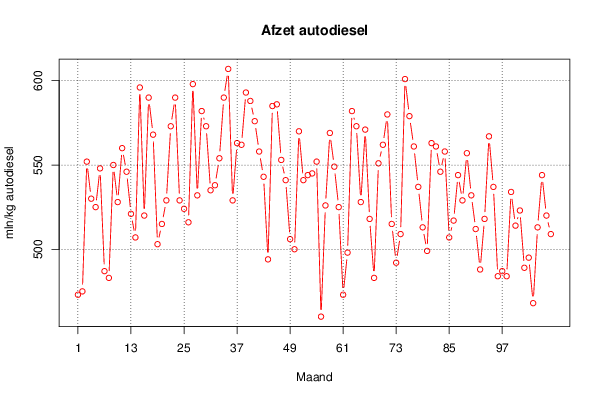
| Title produced by software | Univariate Data Series | ||||||||||||||||||||||||||||||||||||||||
| Date of computation | Wed, 28 Jan 2015 12:52:53 +0000 | ||||||||||||||||||||||||||||||||||||||||
| Cite this page as follows | Statistical Computations at FreeStatistics.org, Office for Research Development and Education, URL https://freestatistics.org/blog/index.php?v=date/2015/Jan/28/t1422449600tyf3cpm8i96cnbb.htm/, Retrieved Tue, 14 May 2024 19:36:28 +0000 | ||||||||||||||||||||||||||||||||||||||||
| Statistical Computations at FreeStatistics.org, Office for Research Development and Education, URL https://freestatistics.org/blog/index.php?pk=276211, Retrieved Tue, 14 May 2024 19:36:28 +0000 | |||||||||||||||||||||||||||||||||||||||||
| QR Codes: | |||||||||||||||||||||||||||||||||||||||||
|
| |||||||||||||||||||||||||||||||||||||||||
| Original text written by user: | |||||||||||||||||||||||||||||||||||||||||
| IsPrivate? | No (this computation is public) | ||||||||||||||||||||||||||||||||||||||||
| User-defined keywords | |||||||||||||||||||||||||||||||||||||||||
| Estimated Impact | 186 | ||||||||||||||||||||||||||||||||||||||||
Tree of Dependent Computations | |||||||||||||||||||||||||||||||||||||||||
| Family? (F = Feedback message, R = changed R code, M = changed R Module, P = changed Parameters, D = changed Data) | |||||||||||||||||||||||||||||||||||||||||
| - [Univariate Data Series] [Afzet autodiesel] [2015-01-28 12:52:53] [642cc750ae8ad788b94759782886fa51] [Current] - RMP [Histogram] [Afzet autodiesel] [2015-02-02 09:14:19] [1817eefa46ee8ede546f23df76ca5081] - RMPD [Bootstrap Plot - Central Tendency] [Density plot mean 50] [2015-04-22 10:27:07] [1817eefa46ee8ede546f23df76ca5081] - RMPD [Bootstrap Plot - Central Tendency] [Density plot mean...] [2015-04-22 12:52:43] [1817eefa46ee8ede546f23df76ca5081] - RMPD [Bootstrap Plot - Central Tendency] [Density plot 750] [2015-04-22 13:05:25] [1817eefa46ee8ede546f23df76ca5081] - RMPD [Blocked Bootstrap Plot - Central Tendency] [Density plot mean...] [2015-04-22 13:40:14] [1817eefa46ee8ede546f23df76ca5081] - RMPD [Blocked Bootstrap Plot - Central Tendency] [Density plot 750 2] [2015-04-22 13:55:20] [1817eefa46ee8ede546f23df76ca5081] | |||||||||||||||||||||||||||||||||||||||||
| Feedback Forum | |||||||||||||||||||||||||||||||||||||||||
Post a new message | |||||||||||||||||||||||||||||||||||||||||
Dataset | |||||||||||||||||||||||||||||||||||||||||
| Dataseries X: | |||||||||||||||||||||||||||||||||||||||||
473 475 552 530 525 548 487 483 550 528 560 546 521 507 596 520 590 568 503 515 529 573 590 529 524 516 598 532 582 573 535 538 554 590 607 529 563 562 593 588 576 558 543 494 585 586 553 541 506 500 570 541 544 545 552 460 526 569 549 525 473 498 582 573 528 571 518 483 551 562 580 515 492 509 601 579 561 537 513 499 563 561 546 558 507 517 544 529 557 532 512 488 518 567 537 484 487 484 534 514 523 489 495 468 513 544 520 509 | |||||||||||||||||||||||||||||||||||||||||
Tables (Output of Computation) | |||||||||||||||||||||||||||||||||||||||||
| |||||||||||||||||||||||||||||||||||||||||
Figures (Output of Computation) | |||||||||||||||||||||||||||||||||||||||||
Input Parameters & R Code | |||||||||||||||||||||||||||||||||||||||||
| Parameters (Session): | |||||||||||||||||||||||||||||||||||||||||
| par1 = Afzet autodiesel ; par2 = http://www.belgostat.be ; par3 = Afzet autodiesel ; par4 = 12 ; | |||||||||||||||||||||||||||||||||||||||||
| Parameters (R input): | |||||||||||||||||||||||||||||||||||||||||
| par1 = Afzet autodiesel ; par2 = http://www.belgostat.be ; par3 = Afzet autodiesel ; par4 = 12 ; | |||||||||||||||||||||||||||||||||||||||||
| R code (references can be found in the software module): | |||||||||||||||||||||||||||||||||||||||||
if (par4 != 'No season') { | |||||||||||||||||||||||||||||||||||||||||