Free Statistics

of Irreproducible Research!

Author's title

Author*Unverified author*
R Software Modulerwasp_univariatedataseries.wasp
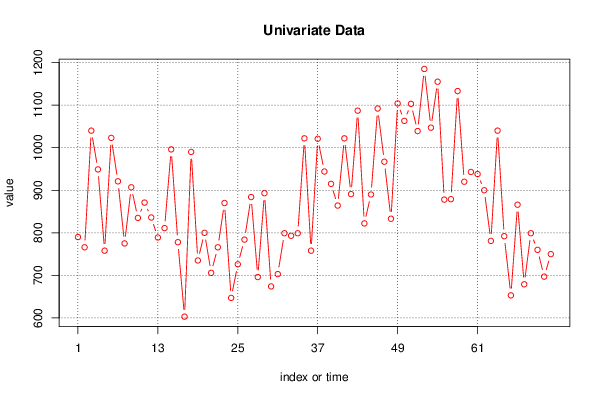
Title produced by softwareUnivariate Data Series
Date of computationMon, 26 Jan 2015 19:34:13 +0000
Cite this page as followsStatistical Computations at FreeStatistics.org, Office for Research Development and Education, URL https://freestatistics.org/blog/index.php?v=date/2015/Jan/26/t14223011930kze7vtvcn7c2wt.htm/, Retrieved Tue, 14 May 2024 21:56:57 +0000
Statistical Computations at FreeStatistics.org, Office for Research Development and Education, URL https://freestatistics.org/blog/index.php?pk=276173, Retrieved Tue, 14 May 2024 21:56:57 +0000
QR Codes:

Original text written by user:
IsPrivate?No (this computation is public)
User-defined keywords
Estimated Impact187
Family? (F = Feedback message, R = changed R code, M = changed R Module, P = changed Parameters, D = changed Data)
-       [Univariate Data Series] [Aantal failliseme...] [2015-01-26 19:34:13] [2dcc5595e1714d1f573b61116e4d8205] [Current]
- RMP     [Histogram] [Frequentietabel o...] [2015-02-04 18:49:43] [90a3f08f7d90706398c741eba4fd645d]
- RMP     [Kernel Density Estimation] [Opdracht 2 oef 2.2] [2015-02-04 18:59:51] [90a3f08f7d90706398c741eba4fd645d]
Feedback Forum

Post a new message
Dataseries X:
790
766
1040
949
758
1023
921
775
907
835
871
836
789
811
996
778
603
990
735
800
706
766
870
647
726
784
884
696
893
674
703
799
793
799
1022
758
1021
944
915
864
1022
891
1087
822
890
1092
967
833
1104
1063
1103
1039
1185
1047
1155
878
879
1133
920
943
938
900
781
1040
792
653
866
679
799
760
697
750


Summary of computational transaction
Raw Inputview raw input (R code)
Raw Outputview raw output of R engine
Computing time0 seconds
R Server'Sir Ronald Aylmer Fisher' @ fisher.wessa.net

\begin{tabular}{lllllllll}
\hline
Summary of computational transaction \tabularnewline
Raw Input & view raw input (R code)  \tabularnewline
Raw Output & view raw output of R engine  \tabularnewline
Computing time & 0 seconds \tabularnewline
R Server & 'Sir Ronald Aylmer Fisher' @ fisher.wessa.net \tabularnewline
\hline
\end{tabular}
%Source: https://freestatistics.org/blog/index.php?pk=276173&T=0

[TABLE]
[ROW][C]Summary of computational transaction[/C][/ROW]
[ROW][C]Raw Input[/C][C]view raw input (R code) [/C][/ROW]
[ROW][C]Raw Output[/C][C]view raw output of R engine [/C][/ROW]
[ROW][C]Computing time[/C][C]0 seconds[/C][/ROW]
[ROW][C]R Server[/C][C]'Sir Ronald Aylmer Fisher' @ fisher.wessa.net[/C][/ROW]
[/TABLE]
Source: https://freestatistics.org/blog/index.php?pk=276173&T=0

Globally Unique Identifier (entire table): ba.freestatistics.org/blog/index.php?pk=276173&T=0

As an alternative you can also use a QR Code:  

The GUIDs for individual cells are displayed in the table below:

Summary of computational transaction
Raw Inputview raw input (R code)
Raw Outputview raw output of R engine
Computing time0 seconds
R Server'Sir Ronald Aylmer Fisher' @ fisher.wessa.net


Univariate Dataseries
Name of dataseriesFaillisementen
Sourcecbs.nl
DescriptionAantal faillisementen per maand
Number of observations72

\begin{tabular}{lllllllll}
\hline
Univariate Dataseries \tabularnewline
Name of dataseries & Faillisementen \tabularnewline
Source & cbs.nl \tabularnewline
Description & Aantal faillisementen per maand \tabularnewline
Number of observations & 72 \tabularnewline
\hline
\end{tabular}
%Source: https://freestatistics.org/blog/index.php?pk=276173&T=1

[TABLE]
[ROW][C]Univariate Dataseries[/C][/ROW]
[ROW][C]Name of dataseries[/C][C]Faillisementen[/C][/ROW]
[ROW][C]Source[/C][C]cbs.nl[/C][/ROW]
[ROW][C]Description[/C][C]Aantal faillisementen per maand[/C][/ROW]
[ROW][C]Number of observations[/C][C]72[/C][/ROW]
[/TABLE]
Source: https://freestatistics.org/blog/index.php?pk=276173&T=1

Globally Unique Identifier (entire table): ba.freestatistics.org/blog/index.php?pk=276173&T=1

As an alternative you can also use a QR Code:  

The GUIDs for individual cells are displayed in the table below:

Univariate Dataseries
Name of dataseriesFaillisementen
Sourcecbs.nl
DescriptionAantal faillisementen per maand
Number of observations72


Parameters (Session):
par1 = Faillisementen ; par2 = cbs.nl ; par3 = Aantal faillisementen per maand ; par4 = 12 ;
Parameters (R input):
par1 = Faillisementen ; par2 = cbs.nl ; par3 = Aantal faillisementen per maand ; par4 = 12 ;
R code (references can be found in the software module):
par4 <- '12'
par3 <- ''
par2 <- 'cbs.nl'
par1 <- 'Faillisementen'
if (par4 != 'No season') {
par4 <- as.numeric(par4)
if (par4 < 4) par4 <- 12
}
summary(x)
n <- length(x)
bitmap(file='test1.png')
if (par4=='No season') {
plot(x,col=2,type='b',main=main,xlab=xlab,ylab=ylab,xaxt='n')
axis(1,at=seq(1,n,10))
}
if (par4!='No season') {
plot(x,col=2,type='b',main=main,xlab=xlab,ylab=ylab,xaxt='n')
axis(1,at=seq(1,n,par4))
grid(nx=0,ny=NULL,col='black')
abline(v=seq(1,n,par4),col='black',lty='dotted')
}
dev.off()
load(file='createtable')
a<-table.start()
a<-table.row.start(a)
a<-table.element(a,'Univariate Dataseries',2,TRUE)
a<-table.row.end(a)
a<-table.row.start(a)
a<-table.element(a,'Name of dataseries',header=TRUE)
a<-table.element(a,par1)
a<-table.row.end(a)
a<-table.row.start(a)
a<-table.element(a,'Source',header=TRUE)
a<-table.element(a,par2)
a<-table.row.end(a)
a<-table.row.start(a)
a<-table.element(a,'Description',header=TRUE)
a<-table.element(a,par3)
a<-table.row.end(a)
a<-table.row.start(a)
a<-table.element(a,'Number of observations',header=TRUE)
a<-table.element(a,length(x))
a<-table.row.end(a)
a<-table.end(a)
table.save(a,file='mytable.tab')