Free Statistics
of Irreproducible Research!
Description of Statistical Computation | |||||||||||||||||||||||||||||||||||||||||
|---|---|---|---|---|---|---|---|---|---|---|---|---|---|---|---|---|---|---|---|---|---|---|---|---|---|---|---|---|---|---|---|---|---|---|---|---|---|---|---|---|---|
| Author's title | |||||||||||||||||||||||||||||||||||||||||
| Author | *Unverified author* | ||||||||||||||||||||||||||||||||||||||||
| R Software Module | rwasp_univariatedataseries.wasp | ||||||||||||||||||||||||||||||||||||||||
| Title produced by software | Univariate Data Series | ||||||||||||||||||||||||||||||||||||||||
| Date of computation | Mon, 26 Jan 2015 18:32:25 +0000 | ||||||||||||||||||||||||||||||||||||||||
| Cite this page as follows | Statistical Computations at FreeStatistics.org, Office for Research Development and Education, URL https://freestatistics.org/blog/index.php?v=date/2015/Jan/26/t14222973184jug1g4v89bekwa.htm/, Retrieved Sat, 05 Jul 2025 18:58:56 +0000 | ||||||||||||||||||||||||||||||||||||||||
| Statistical Computations at FreeStatistics.org, Office for Research Development and Education, URL https://freestatistics.org/blog/index.php?pk=276171, Retrieved Sat, 05 Jul 2025 18:58:56 +0000 | |||||||||||||||||||||||||||||||||||||||||
| QR Codes: | |||||||||||||||||||||||||||||||||||||||||
|
| |||||||||||||||||||||||||||||||||||||||||
| Original text written by user: | |||||||||||||||||||||||||||||||||||||||||
| IsPrivate? | No (this computation is public) | ||||||||||||||||||||||||||||||||||||||||
| User-defined keywords | |||||||||||||||||||||||||||||||||||||||||
| Estimated Impact | 267 | ||||||||||||||||||||||||||||||||||||||||
Tree of Dependent Computations | |||||||||||||||||||||||||||||||||||||||||
| Family? (F = Feedback message, R = changed R code, M = changed R Module, P = changed Parameters, D = changed Data) | |||||||||||||||||||||||||||||||||||||||||
| - [Univariate Data Series] [Prijs per jaar in...] [2015-01-26 18:32:25] [cab9dc260884be88f444bea8f40c034b] [Current] - R PD [Univariate Data Series] [inflatie vanaf 2008] [2015-01-30 16:52:54] [e0fa3a74ccf797c3f9a13c41db1fd9c0] - PD [Univariate Data Series] [ Binnenlandse wer...] [2015-02-04 11:47:59] [e0fa3a74ccf797c3f9a13c41db1fd9c0] - RMPD [Histogram] [Histogram en freq...] [2015-02-05 19:26:50] [e0fa3a74ccf797c3f9a13c41db1fd9c0] - RMPD [Kernel Density Estimation] [Dichtheidsgrafiek...] [2015-02-05 19:34:20] [e0fa3a74ccf797c3f9a13c41db1fd9c0] - RMPD [Histogram] [Binnenlands werkg...] [2015-02-08 18:50:33] [e0fa3a74ccf797c3f9a13c41db1fd9c0] | |||||||||||||||||||||||||||||||||||||||||
| Feedback Forum | |||||||||||||||||||||||||||||||||||||||||
Post a new message | |||||||||||||||||||||||||||||||||||||||||
Dataset | |||||||||||||||||||||||||||||||||||||||||
| Dataseries X: | |||||||||||||||||||||||||||||||||||||||||
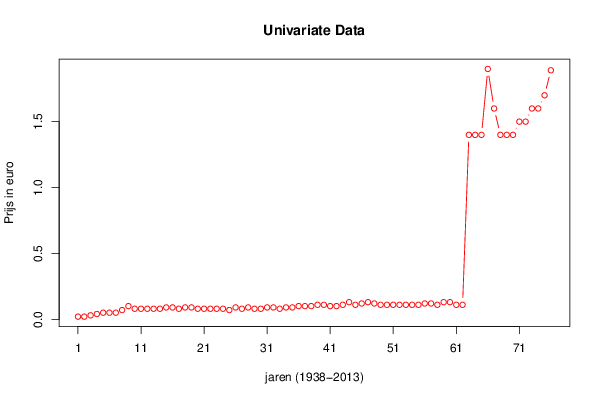
0,02 0,02 0,03 0,04 0,05 0,05 0,05 0,07 0,1 0,08 0,08 0,08 0,08 0,08 0,09 0,09 0,08 0,09 0,09 0,08 0,08 0,08 0,08 0,08 0,07 0,09 0,08 0,09 0,08 0,08 0,09 0,09 0,08 0,09 0,09 0,1 0,1 0,1 0,11 0,11 0,1 0,1 0,11 0,13 0,11 0,12 0,13 0,12 0,11 0,11 0,11 0,11 0,11 0,11 0,11 0,12 0,12 0,11 0,13 0,13 0,11 0,11 1,4 1,4 1,4 1,9 1,6 1,4 1,4 1,4 1,5 1,5 1,6 1,6 1,7 1,89 | |||||||||||||||||||||||||||||||||||||||||
Tables (Output of Computation) | |||||||||||||||||||||||||||||||||||||||||
| |||||||||||||||||||||||||||||||||||||||||
Figures (Output of Computation) | |||||||||||||||||||||||||||||||||||||||||
Input Parameters & R Code | |||||||||||||||||||||||||||||||||||||||||
| Parameters (Session): | |||||||||||||||||||||||||||||||||||||||||
| par1 = Prijs eieren door de jaren heen ; par2 = www.wessa.net/nwasp_univariatedataseries.wasp ; par3 = De prijs van eieren door de jaren heen weergegeven in euro ; par4 = No season ; | |||||||||||||||||||||||||||||||||||||||||
| Parameters (R input): | |||||||||||||||||||||||||||||||||||||||||
| par1 = Prijs eieren door de jaren heen ; par2 = www.wessa.net/nwasp_univariatedataseries.wasp ; par3 = De prijs van eieren door de jaren heen weergegeven in euro ; par4 = No season ; | |||||||||||||||||||||||||||||||||||||||||
| R code (references can be found in the software module): | |||||||||||||||||||||||||||||||||||||||||
par4 <- 'No season' | |||||||||||||||||||||||||||||||||||||||||