Free Statistics
of Irreproducible Research!
Description of Statistical Computation | |||||||||||||||||||||||||||||||||||||||||
|---|---|---|---|---|---|---|---|---|---|---|---|---|---|---|---|---|---|---|---|---|---|---|---|---|---|---|---|---|---|---|---|---|---|---|---|---|---|---|---|---|---|
| Author's title | |||||||||||||||||||||||||||||||||||||||||
| Author | *Unverified author* | ||||||||||||||||||||||||||||||||||||||||
| R Software Module | rwasp_univariatedataseries.wasp | ||||||||||||||||||||||||||||||||||||||||
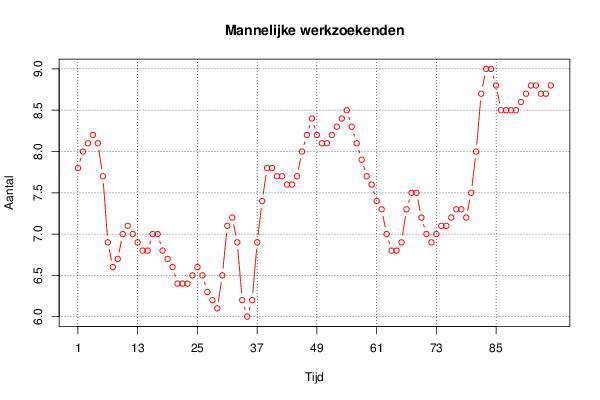
| Title produced by software | Univariate Data Series | ||||||||||||||||||||||||||||||||||||||||
| Date of computation | Mon, 26 Jan 2015 10:28:14 +0000 | ||||||||||||||||||||||||||||||||||||||||
| Cite this page as follows | Statistical Computations at FreeStatistics.org, Office for Research Development and Education, URL https://freestatistics.org/blog/index.php?v=date/2015/Jan/26/t142226836445bwawpi48da605.htm/, Retrieved Tue, 14 May 2024 12:10:17 +0000 | ||||||||||||||||||||||||||||||||||||||||
| Statistical Computations at FreeStatistics.org, Office for Research Development and Education, URL https://freestatistics.org/blog/index.php?pk=276145, Retrieved Tue, 14 May 2024 12:10:17 +0000 | |||||||||||||||||||||||||||||||||||||||||
| QR Codes: | |||||||||||||||||||||||||||||||||||||||||
|
| |||||||||||||||||||||||||||||||||||||||||
| Original text written by user: | |||||||||||||||||||||||||||||||||||||||||
| IsPrivate? | No (this computation is public) | ||||||||||||||||||||||||||||||||||||||||
| User-defined keywords | |||||||||||||||||||||||||||||||||||||||||
| Estimated Impact | 191 | ||||||||||||||||||||||||||||||||||||||||
Tree of Dependent Computations | |||||||||||||||||||||||||||||||||||||||||
| Family? (F = Feedback message, R = changed R code, M = changed R Module, P = changed Parameters, D = changed Data) | |||||||||||||||||||||||||||||||||||||||||
| - [Univariate Data Series] [] [2015-01-26 10:28:14] [70d22f55a70f3427b60459805adf1606] [Current] - RMPD [Quartiles] [Kwartiel Supermarkt] [2015-02-09 09:43:33] [110a48b2e0105bb86f6db58fdf2bbafc] - RMPD [Notched Boxplots] [Boxplot Supermarkt] [2015-02-09 09:48:27] [110a48b2e0105bb86f6db58fdf2bbafc] - RMPD [Quartiles] [Kwartiel Werkzoek...] [2015-02-09 10:00:52] [110a48b2e0105bb86f6db58fdf2bbafc] - RMPD [Notched Boxplots] [boxplot Werkzoeke...] [2015-02-09 10:03:14] [110a48b2e0105bb86f6db58fdf2bbafc] - RMPD [Harrell-Davis Quantiles] [Harrel-Davis Wekz...] [2015-02-09 10:17:53] [110a48b2e0105bb86f6db58fdf2bbafc] - RMPD [Harrell-Davis Quantiles] [Harrel-Davis Wekz...] [2015-02-09 10:20:23] [110a48b2e0105bb86f6db58fdf2bbafc] - RMPD [Harrell-Davis Quantiles] [Harrel-Davis Pass...] [2015-02-09 10:23:48] [110a48b2e0105bb86f6db58fdf2bbafc] - RMPD [Harrell-Davis Quantiles] [Harrel-Davis Pass...] [2015-02-09 10:26:20] [110a48b2e0105bb86f6db58fdf2bbafc] - R [Harrell-Davis Quantiles] [Harrel-Davis Pass...] [2015-02-09 10:28:21] [110a48b2e0105bb86f6db58fdf2bbafc] | |||||||||||||||||||||||||||||||||||||||||
| Feedback Forum | |||||||||||||||||||||||||||||||||||||||||
Post a new message | |||||||||||||||||||||||||||||||||||||||||
Dataset | |||||||||||||||||||||||||||||||||||||||||
| Dataseries X: | |||||||||||||||||||||||||||||||||||||||||
7,8 8 8,1 8,2 8,1 7,7 6,9 6,6 6,7 7 7,1 7 6,9 6,8 6,8 7 7 6,8 6,7 6,6 6,4 6,4 6,4 6,5 6,6 6,5 6,3 6,2 6,1 6,5 7,1 7,2 6,9 6,2 6 6,2 6,9 7,4 7,8 7,8 7,7 7,7 7,6 7,6 7,7 8 8,2 8,4 8,2 8,1 8,1 8,2 8,3 8,4 8,5 8,3 8,1 7,9 7,7 7,6 7,4 7,3 7 6,8 6,8 6,9 7,3 7,5 7,5 7,2 7 6,9 7 7,1 7,1 7,2 7,3 7,3 7,2 7,5 8 8,7 9 9 8,8 8,5 8,5 8,5 8,5 8,6 8,7 8,8 8,8 8,7 8,7 8,8 | |||||||||||||||||||||||||||||||||||||||||
Tables (Output of Computation) | |||||||||||||||||||||||||||||||||||||||||
| |||||||||||||||||||||||||||||||||||||||||
Figures (Output of Computation) | |||||||||||||||||||||||||||||||||||||||||
Input Parameters & R Code | |||||||||||||||||||||||||||||||||||||||||
| Parameters (Session): | |||||||||||||||||||||||||||||||||||||||||
| par1 = Mannelijke werkzoekenden ; par2 = http://www.nbb.be/belgostat/PresentationLinker?Order=true&TableId=410000092&Lang=N&prop=null ; par4 = 12 ; | |||||||||||||||||||||||||||||||||||||||||
| Parameters (R input): | |||||||||||||||||||||||||||||||||||||||||
| par1 = Mannelijke werkzoekenden ; par2 = http://www.nbb.be/belgostat/PresentationLinker?Order=true&TableId=410000092&Lang=N&prop=null ; par3 = ; par4 = 12 ; | |||||||||||||||||||||||||||||||||||||||||
| R code (references can be found in the software module): | |||||||||||||||||||||||||||||||||||||||||
if (par4 != 'No season') { | |||||||||||||||||||||||||||||||||||||||||