Free Statistics

of Irreproducible Research!

Author's title

Author*The author of this computation has been verified*
R Software Modulerwasp_arimabackwardselection.wasp
Title produced by softwareARIMA Backward Selection
Date of computationTue, 20 Jan 2015 12:33:53 +0000
Cite this page as followsStatistical Computations at FreeStatistics.org, Office for Research Development and Education, URL https://freestatistics.org/blog/index.php?v=date/2015/Jan/20/t1421757740cfmnfqh3n2ooqfm.htm/, Retrieved Wed, 15 May 2024 01:51:11 +0000
Statistical Computations at FreeStatistics.org, Office for Research Development and Education, URL https://freestatistics.org/blog/index.php?pk=275130, Retrieved Wed, 15 May 2024 01:51:11 +0000
QR Codes:

Original text written by user:
IsPrivate?No (this computation is public)
User-defined keywords
Estimated Impact55
Family? (F = Feedback message, R = changed R code, M = changed R Module, P = changed Parameters, D = changed Data)
-       [ARIMA Backward Selection] [Vraag 7] [2015-01-20 12:33:53] [7518f5b70667f7960041a156b845c3c0] [Current]
Feedback Forum

Post a new message
Dataseries X:
1775
2197
2920
4240
5415
6136
6719
6234
7152
3646
2165
2803
1615
2350
3350
3536
5834
6767
5993
7276
5641
3477
2247
2466
1567
2237
2598
3729
5715
5776
5852
6878
5488
3583
2054
2282
1552
2261
2446
3519
5161
5085
5711
6057
5224
3363
1899
2115
1491
2061
2419
3430
4778
4862
6176
5664
5529
3418
1941
2402
1579
2146
2462
3695
4831
5134
6250
5760
6249
2917
1741
2359
1511
2059
2635
2867
4403
5720
4502
5749
5627
2846
1762
2429
1169
2154
2249
2687
4359
5382
4459
6398
4596
3024
1887
2070
1351
2218
2461
3028
4784
4975
4607
6249
4809
3157
1910
2228
1594
2467
2222
3607
4685
4962
5770
5480
5000
3228
1993
2288
1588
2105
2191
3591
4668
4885
5822
5599
5340
3082
2010
2301


Summary of computational transaction
Raw Inputview raw input (R code)
Raw Outputview raw output of R engine
Computing time6 seconds
R Server'George Udny Yule' @ yule.wessa.net

\begin{tabular}{lllllllll}
\hline
Summary of computational transaction \tabularnewline
Raw Input & view raw input (R code)  \tabularnewline
Raw Output & view raw output of R engine  \tabularnewline
Computing time & 6 seconds \tabularnewline
R Server & 'George Udny Yule' @ yule.wessa.net \tabularnewline
\hline
\end{tabular}
%Source: https://freestatistics.org/blog/index.php?pk=275130&T=0

[TABLE]
[ROW][C]Summary of computational transaction[/C][/ROW]
[ROW][C]Raw Input[/C][C]view raw input (R code) [/C][/ROW]
[ROW][C]Raw Output[/C][C]view raw output of R engine [/C][/ROW]
[ROW][C]Computing time[/C][C]6 seconds[/C][/ROW]
[ROW][C]R Server[/C][C]'George Udny Yule' @ yule.wessa.net[/C][/ROW]
[/TABLE]
Source: https://freestatistics.org/blog/index.php?pk=275130&T=0

Globally Unique Identifier (entire table): ba.freestatistics.org/blog/index.php?pk=275130&T=0

As an alternative you can also use a QR Code:  

The GUIDs for individual cells are displayed in the table below:

Summary of computational transaction
Raw Inputview raw input (R code)
Raw Outputview raw output of R engine
Computing time6 seconds
R Server'George Udny Yule' @ yule.wessa.net


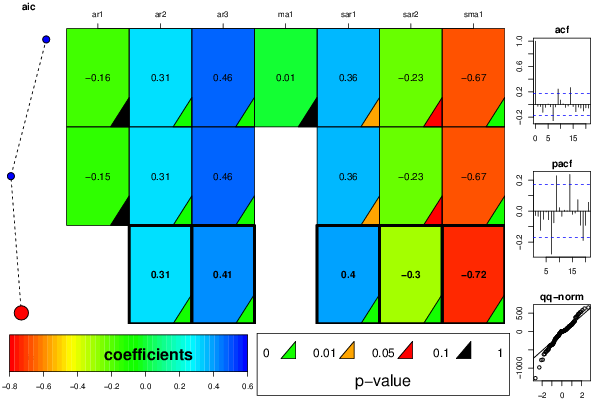
ARIMA Parameter Estimation and Backward Selection
Iterationar1ar2ar3ma1sar1sar2sma1
Estimates ( 1 )-0.15820.31340.46490.01020.362-0.2265-0.6688
(p-val)(0.366 )(2e-04 )(0 )(0.9603 )(0.0252 )(0.0735 )(0 )
Estimates ( 2 )-0.15120.31320.462700.3616-0.2252-0.6681
(p-val)(0.1034 )(2e-04 )(0 )(NA )(0.0253 )(0.0724 )(0 )
Estimates ( 3 )00.31290.409700.4022-0.2974-0.7203
(p-val)(NA )(1e-04 )(0 )(NA )(0.0036 )(0.009 )(0 )
Estimates ( 4 )NANANANANANANA
(p-val)(NA )(NA )(NA )(NA )(NA )(NA )(NA )
Estimates ( 5 )NANANANANANANA
(p-val)(NA )(NA )(NA )(NA )(NA )(NA )(NA )
Estimates ( 6 )NANANANANANANA
(p-val)(NA )(NA )(NA )(NA )(NA )(NA )(NA )
Estimates ( 7 )NANANANANANANA
(p-val)(NA )(NA )(NA )(NA )(NA )(NA )(NA )
Estimates ( 8 )NANANANANANANA
(p-val)(NA )(NA )(NA )(NA )(NA )(NA )(NA )
Estimates ( 9 )NANANANANANANA
(p-val)(NA )(NA )(NA )(NA )(NA )(NA )(NA )
Estimates ( 10 )NANANANANANANA
(p-val)(NA )(NA )(NA )(NA )(NA )(NA )(NA )
Estimates ( 11 )NANANANANANANA
(p-val)(NA )(NA )(NA )(NA )(NA )(NA )(NA )
Estimates ( 12 )NANANANANANANA
(p-val)(NA )(NA )(NA )(NA )(NA )(NA )(NA )
Estimates ( 13 )NANANANANANANA
(p-val)(NA )(NA )(NA )(NA )(NA )(NA )(NA )

\begin{tabular}{lllllllll}
\hline
ARIMA Parameter Estimation and Backward Selection \tabularnewline
Iteration & ar1 & ar2 & ar3 & ma1 & sar1 & sar2 & sma1 \tabularnewline
Estimates ( 1 ) & -0.1582 & 0.3134 & 0.4649 & 0.0102 & 0.362 & -0.2265 & -0.6688 \tabularnewline
(p-val) & (0.366 ) & (2e-04 ) & (0 ) & (0.9603 ) & (0.0252 ) & (0.0735 ) & (0 ) \tabularnewline
Estimates ( 2 ) & -0.1512 & 0.3132 & 0.4627 & 0 & 0.3616 & -0.2252 & -0.6681 \tabularnewline
(p-val) & (0.1034 ) & (2e-04 ) & (0 ) & (NA ) & (0.0253 ) & (0.0724 ) & (0 ) \tabularnewline
Estimates ( 3 ) & 0 & 0.3129 & 0.4097 & 0 & 0.4022 & -0.2974 & -0.7203 \tabularnewline
(p-val) & (NA ) & (1e-04 ) & (0 ) & (NA ) & (0.0036 ) & (0.009 ) & (0 ) \tabularnewline
Estimates ( 4 ) & NA & NA & NA & NA & NA & NA & NA \tabularnewline
(p-val) & (NA ) & (NA ) & (NA ) & (NA ) & (NA ) & (NA ) & (NA ) \tabularnewline
Estimates ( 5 ) & NA & NA & NA & NA & NA & NA & NA \tabularnewline
(p-val) & (NA ) & (NA ) & (NA ) & (NA ) & (NA ) & (NA ) & (NA ) \tabularnewline
Estimates ( 6 ) & NA & NA & NA & NA & NA & NA & NA \tabularnewline
(p-val) & (NA ) & (NA ) & (NA ) & (NA ) & (NA ) & (NA ) & (NA ) \tabularnewline
Estimates ( 7 ) & NA & NA & NA & NA & NA & NA & NA \tabularnewline
(p-val) & (NA ) & (NA ) & (NA ) & (NA ) & (NA ) & (NA ) & (NA ) \tabularnewline
Estimates ( 8 ) & NA & NA & NA & NA & NA & NA & NA \tabularnewline
(p-val) & (NA ) & (NA ) & (NA ) & (NA ) & (NA ) & (NA ) & (NA ) \tabularnewline
Estimates ( 9 ) & NA & NA & NA & NA & NA & NA & NA \tabularnewline
(p-val) & (NA ) & (NA ) & (NA ) & (NA ) & (NA ) & (NA ) & (NA ) \tabularnewline
Estimates ( 10 ) & NA & NA & NA & NA & NA & NA & NA \tabularnewline
(p-val) & (NA ) & (NA ) & (NA ) & (NA ) & (NA ) & (NA ) & (NA ) \tabularnewline
Estimates ( 11 ) & NA & NA & NA & NA & NA & NA & NA \tabularnewline
(p-val) & (NA ) & (NA ) & (NA ) & (NA ) & (NA ) & (NA ) & (NA ) \tabularnewline
Estimates ( 12 ) & NA & NA & NA & NA & NA & NA & NA \tabularnewline
(p-val) & (NA ) & (NA ) & (NA ) & (NA ) & (NA ) & (NA ) & (NA ) \tabularnewline
Estimates ( 13 ) & NA & NA & NA & NA & NA & NA & NA \tabularnewline
(p-val) & (NA ) & (NA ) & (NA ) & (NA ) & (NA ) & (NA ) & (NA ) \tabularnewline
\hline
\end{tabular}
%Source: https://freestatistics.org/blog/index.php?pk=275130&T=1

[TABLE]
[ROW][C]ARIMA Parameter Estimation and Backward Selection[/C][/ROW]
[ROW][C]Iteration[/C][C]ar1[/C][C]ar2[/C][C]ar3[/C][C]ma1[/C][C]sar1[/C][C]sar2[/C][C]sma1[/C][/ROW]
[ROW][C]Estimates ( 1 )[/C][C]-0.1582[/C][C]0.3134[/C][C]0.4649[/C][C]0.0102[/C][C]0.362[/C][C]-0.2265[/C][C]-0.6688[/C][/ROW]
[ROW][C](p-val)[/C][C](0.366 )[/C][C](2e-04 )[/C][C](0 )[/C][C](0.9603 )[/C][C](0.0252 )[/C][C](0.0735 )[/C][C](0 )[/C][/ROW]
[ROW][C]Estimates ( 2 )[/C][C]-0.1512[/C][C]0.3132[/C][C]0.4627[/C][C]0[/C][C]0.3616[/C][C]-0.2252[/C][C]-0.6681[/C][/ROW]
[ROW][C](p-val)[/C][C](0.1034 )[/C][C](2e-04 )[/C][C](0 )[/C][C](NA )[/C][C](0.0253 )[/C][C](0.0724 )[/C][C](0 )[/C][/ROW]
[ROW][C]Estimates ( 3 )[/C][C]0[/C][C]0.3129[/C][C]0.4097[/C][C]0[/C][C]0.4022[/C][C]-0.2974[/C][C]-0.7203[/C][/ROW]
[ROW][C](p-val)[/C][C](NA )[/C][C](1e-04 )[/C][C](0 )[/C][C](NA )[/C][C](0.0036 )[/C][C](0.009 )[/C][C](0 )[/C][/ROW]
[ROW][C]Estimates ( 4 )[/C][C]NA[/C][C]NA[/C][C]NA[/C][C]NA[/C][C]NA[/C][C]NA[/C][C]NA[/C][/ROW]
[ROW][C](p-val)[/C][C](NA )[/C][C](NA )[/C][C](NA )[/C][C](NA )[/C][C](NA )[/C][C](NA )[/C][C](NA )[/C][/ROW]
[ROW][C]Estimates ( 5 )[/C][C]NA[/C][C]NA[/C][C]NA[/C][C]NA[/C][C]NA[/C][C]NA[/C][C]NA[/C][/ROW]
[ROW][C](p-val)[/C][C](NA )[/C][C](NA )[/C][C](NA )[/C][C](NA )[/C][C](NA )[/C][C](NA )[/C][C](NA )[/C][/ROW]
[ROW][C]Estimates ( 6 )[/C][C]NA[/C][C]NA[/C][C]NA[/C][C]NA[/C][C]NA[/C][C]NA[/C][C]NA[/C][/ROW]
[ROW][C](p-val)[/C][C](NA )[/C][C](NA )[/C][C](NA )[/C][C](NA )[/C][C](NA )[/C][C](NA )[/C][C](NA )[/C][/ROW]
[ROW][C]Estimates ( 7 )[/C][C]NA[/C][C]NA[/C][C]NA[/C][C]NA[/C][C]NA[/C][C]NA[/C][C]NA[/C][/ROW]
[ROW][C](p-val)[/C][C](NA )[/C][C](NA )[/C][C](NA )[/C][C](NA )[/C][C](NA )[/C][C](NA )[/C][C](NA )[/C][/ROW]
[ROW][C]Estimates ( 8 )[/C][C]NA[/C][C]NA[/C][C]NA[/C][C]NA[/C][C]NA[/C][C]NA[/C][C]NA[/C][/ROW]
[ROW][C](p-val)[/C][C](NA )[/C][C](NA )[/C][C](NA )[/C][C](NA )[/C][C](NA )[/C][C](NA )[/C][C](NA )[/C][/ROW]
[ROW][C]Estimates ( 9 )[/C][C]NA[/C][C]NA[/C][C]NA[/C][C]NA[/C][C]NA[/C][C]NA[/C][C]NA[/C][/ROW]
[ROW][C](p-val)[/C][C](NA )[/C][C](NA )[/C][C](NA )[/C][C](NA )[/C][C](NA )[/C][C](NA )[/C][C](NA )[/C][/ROW]
[ROW][C]Estimates ( 10 )[/C][C]NA[/C][C]NA[/C][C]NA[/C][C]NA[/C][C]NA[/C][C]NA[/C][C]NA[/C][/ROW]
[ROW][C](p-val)[/C][C](NA )[/C][C](NA )[/C][C](NA )[/C][C](NA )[/C][C](NA )[/C][C](NA )[/C][C](NA )[/C][/ROW]
[ROW][C]Estimates ( 11 )[/C][C]NA[/C][C]NA[/C][C]NA[/C][C]NA[/C][C]NA[/C][C]NA[/C][C]NA[/C][/ROW]
[ROW][C](p-val)[/C][C](NA )[/C][C](NA )[/C][C](NA )[/C][C](NA )[/C][C](NA )[/C][C](NA )[/C][C](NA )[/C][/ROW]
[ROW][C]Estimates ( 12 )[/C][C]NA[/C][C]NA[/C][C]NA[/C][C]NA[/C][C]NA[/C][C]NA[/C][C]NA[/C][/ROW]
[ROW][C](p-val)[/C][C](NA )[/C][C](NA )[/C][C](NA )[/C][C](NA )[/C][C](NA )[/C][C](NA )[/C][C](NA )[/C][/ROW]
[ROW][C]Estimates ( 13 )[/C][C]NA[/C][C]NA[/C][C]NA[/C][C]NA[/C][C]NA[/C][C]NA[/C][C]NA[/C][/ROW]
[ROW][C](p-val)[/C][C](NA )[/C][C](NA )[/C][C](NA )[/C][C](NA )[/C][C](NA )[/C][C](NA )[/C][C](NA )[/C][/ROW]
[/TABLE]
Source: https://freestatistics.org/blog/index.php?pk=275130&T=1

Globally Unique Identifier (entire table): ba.freestatistics.org/blog/index.php?pk=275130&T=1

As an alternative you can also use a QR Code:  

The GUIDs for individual cells are displayed in the table below:

ARIMA Parameter Estimation and Backward Selection
Iterationar1ar2ar3ma1sar1sar2sma1
Estimates ( 1 )-0.15820.31340.46490.01020.362-0.2265-0.6688
(p-val)(0.366 )(2e-04 )(0 )(0.9603 )(0.0252 )(0.0735 )(0 )
Estimates ( 2 )-0.15120.31320.462700.3616-0.2252-0.6681
(p-val)(0.1034 )(2e-04 )(0 )(NA )(0.0253 )(0.0724 )(0 )
Estimates ( 3 )00.31290.409700.4022-0.2974-0.7203
(p-val)(NA )(1e-04 )(0 )(NA )(0.0036 )(0.009 )(0 )
Estimates ( 4 )NANANANANANANA
(p-val)(NA )(NA )(NA )(NA )(NA )(NA )(NA )
Estimates ( 5 )NANANANANANANA
(p-val)(NA )(NA )(NA )(NA )(NA )(NA )(NA )
Estimates ( 6 )NANANANANANANA
(p-val)(NA )(NA )(NA )(NA )(NA )(NA )(NA )
Estimates ( 7 )NANANANANANANA
(p-val)(NA )(NA )(NA )(NA )(NA )(NA )(NA )
Estimates ( 8 )NANANANANANANA
(p-val)(NA )(NA )(NA )(NA )(NA )(NA )(NA )
Estimates ( 9 )NANANANANANANA
(p-val)(NA )(NA )(NA )(NA )(NA )(NA )(NA )
Estimates ( 10 )NANANANANANANA
(p-val)(NA )(NA )(NA )(NA )(NA )(NA )(NA )
Estimates ( 11 )NANANANANANANA
(p-val)(NA )(NA )(NA )(NA )(NA )(NA )(NA )
Estimates ( 12 )NANANANANANANA
(p-val)(NA )(NA )(NA )(NA )(NA )(NA )(NA )
Estimates ( 13 )NANANANANANANA
(p-val)(NA )(NA )(NA )(NA )(NA )(NA )(NA )


Estimated ARIMA Residuals
Value
2.80298569780858
-123.562887244896
113.417565409305
388.164728196442
-552.26799143552
97.3204910553759
653.78012384105
-389.535461376532
489.052630404941
-1275.66940316575
-348.827956049157
37.151249196206
415.204356805248
-56.4744235129756
-40.5263715845324
-496.464981333834
43.913293266104
194.466060373942
-557.407909897478
-371.071679181048
15.9516467540979
80.6809215553357
194.277627659502
42.8998889694061
-56.7475415169126
-72.1338219551054
160.43024363276
-64.1235424545522
-381.339010141639
-462.144428951525
-540.281630802827
-171.935460035742
-211.803381487503
-386.184737892733
-8.09992181628267
280.356907981424
119.361529721604
14.3968559883158
-58.2761709980141
-116.901953932437
-131.994658502615
-346.323011042662
-514.35482592786
388.789623571401
-89.7639919213834
26.80246493347
42.0989012519371
227.983731423816
169.131598719933
71.26687711961
20.0967029462287
-205.938204640846
65.0148963081079
-203.282248455579
-216.950269609167
23.3059826245023
-116.453160513372
521.155497712627
-415.403636199706
-380.605695251466
-186.133618252922
245.300205800517
6.171269422524
110.52636363333
-772.190373315553
-781.108252770551
437.004566176448
-981.964603994028
-353.504634349645
-167.122629375396
536.91162123592
184.879339700226
379.145719839372
-200.475999744256
10.0942754861245
-319.037413855047
-309.275150192547
-300.232361389528
-31.9353917921223
-243.417939380811
626.165926143407
-616.107823868584
-140.336677311937
98.6532470820504
138.684700563587
32.348715855094
150.478544967525
270.291353156194
-65.1855593143896
50.3978968972545
-371.291834166164
-624.829086994349
-114.632014212452
118.999411240944
253.729520103271
95.386202195863
170.768292013484
148.71062338165
275.751558906128
-356.502409141842
186.932358441713
-154.445774940711
-173.248201726381
581.374486707599
-375.764299455378
-495.984455110889
-116.151756171706
476.299551396868
86.5098953998592
-26.7097470866173
-284.554805078541
-148.409073094867
153.409272560092
159.083664887821
-263.559146606615
61.1788301280915
60.2109356350844
223.426758226431
-129.812798584033
20.7629188806168
-19.7123655051745

\begin{tabular}{lllllllll}
\hline
Estimated ARIMA Residuals \tabularnewline
Value \tabularnewline
2.80298569780858 \tabularnewline
-123.562887244896 \tabularnewline
113.417565409305 \tabularnewline
388.164728196442 \tabularnewline
-552.26799143552 \tabularnewline
97.3204910553759 \tabularnewline
653.78012384105 \tabularnewline
-389.535461376532 \tabularnewline
489.052630404941 \tabularnewline
-1275.66940316575 \tabularnewline
-348.827956049157 \tabularnewline
37.151249196206 \tabularnewline
415.204356805248 \tabularnewline
-56.4744235129756 \tabularnewline
-40.5263715845324 \tabularnewline
-496.464981333834 \tabularnewline
43.913293266104 \tabularnewline
194.466060373942 \tabularnewline
-557.407909897478 \tabularnewline
-371.071679181048 \tabularnewline
15.9516467540979 \tabularnewline
80.6809215553357 \tabularnewline
194.277627659502 \tabularnewline
42.8998889694061 \tabularnewline
-56.7475415169126 \tabularnewline
-72.1338219551054 \tabularnewline
160.43024363276 \tabularnewline
-64.1235424545522 \tabularnewline
-381.339010141639 \tabularnewline
-462.144428951525 \tabularnewline
-540.281630802827 \tabularnewline
-171.935460035742 \tabularnewline
-211.803381487503 \tabularnewline
-386.184737892733 \tabularnewline
-8.09992181628267 \tabularnewline
280.356907981424 \tabularnewline
119.361529721604 \tabularnewline
14.3968559883158 \tabularnewline
-58.2761709980141 \tabularnewline
-116.901953932437 \tabularnewline
-131.994658502615 \tabularnewline
-346.323011042662 \tabularnewline
-514.35482592786 \tabularnewline
388.789623571401 \tabularnewline
-89.7639919213834 \tabularnewline
26.80246493347 \tabularnewline
42.0989012519371 \tabularnewline
227.983731423816 \tabularnewline
169.131598719933 \tabularnewline
71.26687711961 \tabularnewline
20.0967029462287 \tabularnewline
-205.938204640846 \tabularnewline
65.0148963081079 \tabularnewline
-203.282248455579 \tabularnewline
-216.950269609167 \tabularnewline
23.3059826245023 \tabularnewline
-116.453160513372 \tabularnewline
521.155497712627 \tabularnewline
-415.403636199706 \tabularnewline
-380.605695251466 \tabularnewline
-186.133618252922 \tabularnewline
245.300205800517 \tabularnewline
6.171269422524 \tabularnewline
110.52636363333 \tabularnewline
-772.190373315553 \tabularnewline
-781.108252770551 \tabularnewline
437.004566176448 \tabularnewline
-981.964603994028 \tabularnewline
-353.504634349645 \tabularnewline
-167.122629375396 \tabularnewline
536.91162123592 \tabularnewline
184.879339700226 \tabularnewline
379.145719839372 \tabularnewline
-200.475999744256 \tabularnewline
10.0942754861245 \tabularnewline
-319.037413855047 \tabularnewline
-309.275150192547 \tabularnewline
-300.232361389528 \tabularnewline
-31.9353917921223 \tabularnewline
-243.417939380811 \tabularnewline
626.165926143407 \tabularnewline
-616.107823868584 \tabularnewline
-140.336677311937 \tabularnewline
98.6532470820504 \tabularnewline
138.684700563587 \tabularnewline
32.348715855094 \tabularnewline
150.478544967525 \tabularnewline
270.291353156194 \tabularnewline
-65.1855593143896 \tabularnewline
50.3978968972545 \tabularnewline
-371.291834166164 \tabularnewline
-624.829086994349 \tabularnewline
-114.632014212452 \tabularnewline
118.999411240944 \tabularnewline
253.729520103271 \tabularnewline
95.386202195863 \tabularnewline
170.768292013484 \tabularnewline
148.71062338165 \tabularnewline
275.751558906128 \tabularnewline
-356.502409141842 \tabularnewline
186.932358441713 \tabularnewline
-154.445774940711 \tabularnewline
-173.248201726381 \tabularnewline
581.374486707599 \tabularnewline
-375.764299455378 \tabularnewline
-495.984455110889 \tabularnewline
-116.151756171706 \tabularnewline
476.299551396868 \tabularnewline
86.5098953998592 \tabularnewline
-26.7097470866173 \tabularnewline
-284.554805078541 \tabularnewline
-148.409073094867 \tabularnewline
153.409272560092 \tabularnewline
159.083664887821 \tabularnewline
-263.559146606615 \tabularnewline
61.1788301280915 \tabularnewline
60.2109356350844 \tabularnewline
223.426758226431 \tabularnewline
-129.812798584033 \tabularnewline
20.7629188806168 \tabularnewline
-19.7123655051745 \tabularnewline
\hline
\end{tabular}
%Source: https://freestatistics.org/blog/index.php?pk=275130&T=2

[TABLE]
[ROW][C]Estimated ARIMA Residuals[/C][/ROW]
[ROW][C]Value[/C][/ROW]
[ROW][C]2.80298569780858[/C][/ROW]
[ROW][C]-123.562887244896[/C][/ROW]
[ROW][C]113.417565409305[/C][/ROW]
[ROW][C]388.164728196442[/C][/ROW]
[ROW][C]-552.26799143552[/C][/ROW]
[ROW][C]97.3204910553759[/C][/ROW]
[ROW][C]653.78012384105[/C][/ROW]
[ROW][C]-389.535461376532[/C][/ROW]
[ROW][C]489.052630404941[/C][/ROW]
[ROW][C]-1275.66940316575[/C][/ROW]
[ROW][C]-348.827956049157[/C][/ROW]
[ROW][C]37.151249196206[/C][/ROW]
[ROW][C]415.204356805248[/C][/ROW]
[ROW][C]-56.4744235129756[/C][/ROW]
[ROW][C]-40.5263715845324[/C][/ROW]
[ROW][C]-496.464981333834[/C][/ROW]
[ROW][C]43.913293266104[/C][/ROW]
[ROW][C]194.466060373942[/C][/ROW]
[ROW][C]-557.407909897478[/C][/ROW]
[ROW][C]-371.071679181048[/C][/ROW]
[ROW][C]15.9516467540979[/C][/ROW]
[ROW][C]80.6809215553357[/C][/ROW]
[ROW][C]194.277627659502[/C][/ROW]
[ROW][C]42.8998889694061[/C][/ROW]
[ROW][C]-56.7475415169126[/C][/ROW]
[ROW][C]-72.1338219551054[/C][/ROW]
[ROW][C]160.43024363276[/C][/ROW]
[ROW][C]-64.1235424545522[/C][/ROW]
[ROW][C]-381.339010141639[/C][/ROW]
[ROW][C]-462.144428951525[/C][/ROW]
[ROW][C]-540.281630802827[/C][/ROW]
[ROW][C]-171.935460035742[/C][/ROW]
[ROW][C]-211.803381487503[/C][/ROW]
[ROW][C]-386.184737892733[/C][/ROW]
[ROW][C]-8.09992181628267[/C][/ROW]
[ROW][C]280.356907981424[/C][/ROW]
[ROW][C]119.361529721604[/C][/ROW]
[ROW][C]14.3968559883158[/C][/ROW]
[ROW][C]-58.2761709980141[/C][/ROW]
[ROW][C]-116.901953932437[/C][/ROW]
[ROW][C]-131.994658502615[/C][/ROW]
[ROW][C]-346.323011042662[/C][/ROW]
[ROW][C]-514.35482592786[/C][/ROW]
[ROW][C]388.789623571401[/C][/ROW]
[ROW][C]-89.7639919213834[/C][/ROW]
[ROW][C]26.80246493347[/C][/ROW]
[ROW][C]42.0989012519371[/C][/ROW]
[ROW][C]227.983731423816[/C][/ROW]
[ROW][C]169.131598719933[/C][/ROW]
[ROW][C]71.26687711961[/C][/ROW]
[ROW][C]20.0967029462287[/C][/ROW]
[ROW][C]-205.938204640846[/C][/ROW]
[ROW][C]65.0148963081079[/C][/ROW]
[ROW][C]-203.282248455579[/C][/ROW]
[ROW][C]-216.950269609167[/C][/ROW]
[ROW][C]23.3059826245023[/C][/ROW]
[ROW][C]-116.453160513372[/C][/ROW]
[ROW][C]521.155497712627[/C][/ROW]
[ROW][C]-415.403636199706[/C][/ROW]
[ROW][C]-380.605695251466[/C][/ROW]
[ROW][C]-186.133618252922[/C][/ROW]
[ROW][C]245.300205800517[/C][/ROW]
[ROW][C]6.171269422524[/C][/ROW]
[ROW][C]110.52636363333[/C][/ROW]
[ROW][C]-772.190373315553[/C][/ROW]
[ROW][C]-781.108252770551[/C][/ROW]
[ROW][C]437.004566176448[/C][/ROW]
[ROW][C]-981.964603994028[/C][/ROW]
[ROW][C]-353.504634349645[/C][/ROW]
[ROW][C]-167.122629375396[/C][/ROW]
[ROW][C]536.91162123592[/C][/ROW]
[ROW][C]184.879339700226[/C][/ROW]
[ROW][C]379.145719839372[/C][/ROW]
[ROW][C]-200.475999744256[/C][/ROW]
[ROW][C]10.0942754861245[/C][/ROW]
[ROW][C]-319.037413855047[/C][/ROW]
[ROW][C]-309.275150192547[/C][/ROW]
[ROW][C]-300.232361389528[/C][/ROW]
[ROW][C]-31.9353917921223[/C][/ROW]
[ROW][C]-243.417939380811[/C][/ROW]
[ROW][C]626.165926143407[/C][/ROW]
[ROW][C]-616.107823868584[/C][/ROW]
[ROW][C]-140.336677311937[/C][/ROW]
[ROW][C]98.6532470820504[/C][/ROW]
[ROW][C]138.684700563587[/C][/ROW]
[ROW][C]32.348715855094[/C][/ROW]
[ROW][C]150.478544967525[/C][/ROW]
[ROW][C]270.291353156194[/C][/ROW]
[ROW][C]-65.1855593143896[/C][/ROW]
[ROW][C]50.3978968972545[/C][/ROW]
[ROW][C]-371.291834166164[/C][/ROW]
[ROW][C]-624.829086994349[/C][/ROW]
[ROW][C]-114.632014212452[/C][/ROW]
[ROW][C]118.999411240944[/C][/ROW]
[ROW][C]253.729520103271[/C][/ROW]
[ROW][C]95.386202195863[/C][/ROW]
[ROW][C]170.768292013484[/C][/ROW]
[ROW][C]148.71062338165[/C][/ROW]
[ROW][C]275.751558906128[/C][/ROW]
[ROW][C]-356.502409141842[/C][/ROW]
[ROW][C]186.932358441713[/C][/ROW]
[ROW][C]-154.445774940711[/C][/ROW]
[ROW][C]-173.248201726381[/C][/ROW]
[ROW][C]581.374486707599[/C][/ROW]
[ROW][C]-375.764299455378[/C][/ROW]
[ROW][C]-495.984455110889[/C][/ROW]
[ROW][C]-116.151756171706[/C][/ROW]
[ROW][C]476.299551396868[/C][/ROW]
[ROW][C]86.5098953998592[/C][/ROW]
[ROW][C]-26.7097470866173[/C][/ROW]
[ROW][C]-284.554805078541[/C][/ROW]
[ROW][C]-148.409073094867[/C][/ROW]
[ROW][C]153.409272560092[/C][/ROW]
[ROW][C]159.083664887821[/C][/ROW]
[ROW][C]-263.559146606615[/C][/ROW]
[ROW][C]61.1788301280915[/C][/ROW]
[ROW][C]60.2109356350844[/C][/ROW]
[ROW][C]223.426758226431[/C][/ROW]
[ROW][C]-129.812798584033[/C][/ROW]
[ROW][C]20.7629188806168[/C][/ROW]
[ROW][C]-19.7123655051745[/C][/ROW]
[/TABLE]
Source: https://freestatistics.org/blog/index.php?pk=275130&T=2

Globally Unique Identifier (entire table): ba.freestatistics.org/blog/index.php?pk=275130&T=2

As an alternative you can also use a QR Code:  

The GUIDs for individual cells are displayed in the table below:

Estimated ARIMA Residuals
Value
2.80298569780858
-123.562887244896
113.417565409305
388.164728196442
-552.26799143552
97.3204910553759
653.78012384105
-389.535461376532
489.052630404941
-1275.66940316575
-348.827956049157
37.151249196206
415.204356805248
-56.4744235129756
-40.5263715845324
-496.464981333834
43.913293266104
194.466060373942
-557.407909897478
-371.071679181048
15.9516467540979
80.6809215553357
194.277627659502
42.8998889694061
-56.7475415169126
-72.1338219551054
160.43024363276
-64.1235424545522
-381.339010141639
-462.144428951525
-540.281630802827
-171.935460035742
-211.803381487503
-386.184737892733
-8.09992181628267
280.356907981424
119.361529721604
14.3968559883158
-58.2761709980141
-116.901953932437
-131.994658502615
-346.323011042662
-514.35482592786
388.789623571401
-89.7639919213834
26.80246493347
42.0989012519371
227.983731423816
169.131598719933
71.26687711961
20.0967029462287
-205.938204640846
65.0148963081079
-203.282248455579
-216.950269609167
23.3059826245023
-116.453160513372
521.155497712627
-415.403636199706
-380.605695251466
-186.133618252922
245.300205800517
6.171269422524
110.52636363333
-772.190373315553
-781.108252770551
437.004566176448
-981.964603994028
-353.504634349645
-167.122629375396
536.91162123592
184.879339700226
379.145719839372
-200.475999744256
10.0942754861245
-319.037413855047
-309.275150192547
-300.232361389528
-31.9353917921223
-243.417939380811
626.165926143407
-616.107823868584
-140.336677311937
98.6532470820504
138.684700563587
32.348715855094
150.478544967525
270.291353156194
-65.1855593143896
50.3978968972545
-371.291834166164
-624.829086994349
-114.632014212452
118.999411240944
253.729520103271
95.386202195863
170.768292013484
148.71062338165
275.751558906128
-356.502409141842
186.932358441713
-154.445774940711
-173.248201726381
581.374486707599
-375.764299455378
-495.984455110889
-116.151756171706
476.299551396868
86.5098953998592
-26.7097470866173
-284.554805078541
-148.409073094867
153.409272560092
159.083664887821
-263.559146606615
61.1788301280915
60.2109356350844
223.426758226431
-129.812798584033
20.7629188806168
-19.7123655051745


Parameters (Session):
par1 = 1 ; par2 = 2 ; par3 = 3 ; par4 = TRUE ;
Parameters (R input):
par1 = FALSE ; par2 = 1 ; par3 = 0 ; par4 = 1 ; par5 = 12 ; par6 = 3 ; par7 = 1 ; par8 = 2 ; par9 = 1 ;
R code (references can be found in the software module):
library(lattice)
if (par1 == 'TRUE') par1 <- TRUE
if (par1 == 'FALSE') par1 <- FALSE
par2 <- as.numeric(par2) #Box-Cox lambda transformation parameter
par3 <- as.numeric(par3) #degree of non-seasonal differencing
par4 <- as.numeric(par4) #degree of seasonal differencing
par5 <- as.numeric(par5) #seasonal period
par6 <- as.numeric(par6) #degree (p) of the non-seasonal AR(p) polynomial
par7 <- as.numeric(par7) #degree (q) of the non-seasonal MA(q) polynomial
par8 <- as.numeric(par8) #degree (P) of the seasonal AR(P) polynomial
par9 <- as.numeric(par9) #degree (Q) of the seasonal MA(Q) polynomial
armaGR <- function(arima.out, names, n){
try1 <- arima.out$coef
try2 <- sqrt(diag(arima.out$var.coef))
try.data.frame <- data.frame(matrix(NA,ncol=4,nrow=length(names)))
dimnames(try.data.frame) <- list(names,c('coef','std','tstat','pv'))
try.data.frame[,1] <- try1
for(i in 1:length(try2)) try.data.frame[which(rownames(try.data.frame)==names(try2)[i]),2] <- try2[i]
try.data.frame[,3] <- try.data.frame[,1] / try.data.frame[,2]
try.data.frame[,4] <- round((1-pt(abs(try.data.frame[,3]),df=n-(length(try2)+1)))*2,5)
vector <- rep(NA,length(names))
vector[is.na(try.data.frame[,4])] <- 0
maxi <- which.max(try.data.frame[,4])
continue <- max(try.data.frame[,4],na.rm=TRUE) > .05
vector[maxi] <- 0
list(summary=try.data.frame,next.vector=vector,continue=continue)
}
arimaSelect <- function(series, order=c(13,0,0), seasonal=list(order=c(2,0,0),period=12), include.mean=F){
nrc <- order[1]+order[3]+seasonal$order[1]+seasonal$order[3]
coeff <- matrix(NA, nrow=nrc*2, ncol=nrc)
pval <- matrix(NA, nrow=nrc*2, ncol=nrc)
mylist <- rep(list(NULL), nrc)
names <- NULL
if(order[1] > 0) names <- paste('ar',1:order[1],sep='')
if(order[3] > 0) names <- c( names , paste('ma',1:order[3],sep='') )
if(seasonal$order[1] > 0) names <- c(names, paste('sar',1:seasonal$order[1],sep=''))
if(seasonal$order[3] > 0) names <- c(names, paste('sma',1:seasonal$order[3],sep=''))
arima.out <- arima(series, order=order, seasonal=seasonal, include.mean=include.mean, method='ML')
mylist[[1]] <- arima.out
last.arma <- armaGR(arima.out, names, length(series))
mystop <- FALSE
i <- 1
coeff[i,] <- last.arma[[1]][,1]
pval [i,] <- last.arma[[1]][,4]
i <- 2
aic <- arima.out$aic
while(!mystop){
mylist[[i]] <- arima.out
arima.out <- arima(series, order=order, seasonal=seasonal, include.mean=include.mean, method='ML', fixed=last.arma$next.vector)
aic <- c(aic, arima.out$aic)
last.arma <- armaGR(arima.out, names, length(series))
mystop <- !last.arma$continue
coeff[i,] <- last.arma[[1]][,1]
pval [i,] <- last.arma[[1]][,4]
i <- i+1
}
list(coeff, pval, mylist, aic=aic)
}
arimaSelectplot <- function(arimaSelect.out,noms,choix){
noms <- names(arimaSelect.out[[3]][[1]]$coef)
coeff <- arimaSelect.out[[1]]
k <- min(which(is.na(coeff[,1])))-1
coeff <- coeff[1:k,]
pval <- arimaSelect.out[[2]][1:k,]
aic <- arimaSelect.out$aic[1:k]
coeff[coeff==0] <- NA
n <- ncol(coeff)
if(missing(choix)) choix <- k
layout(matrix(c(1,1,1,2,
3,3,3,2,
3,3,3,4,
5,6,7,7),nr=4),
widths=c(10,35,45,15),
heights=c(30,30,15,15))
couleurs <- rainbow(75)[1:50]#(50)
ticks <- pretty(coeff)
par(mar=c(1,1,3,1))
plot(aic,k:1-.5,type='o',pch=21,bg='blue',cex=2,axes=F,lty=2,xpd=NA)
points(aic[choix],k-choix+.5,pch=21,cex=4,bg=2,xpd=NA)
title('aic',line=2)
par(mar=c(3,0,0,0))
plot(0,axes=F,xlab='',ylab='',xlim=range(ticks),ylim=c(.1,1))
rect(xleft = min(ticks) + (0:49)/50*(max(ticks)-min(ticks)),
xright = min(ticks) + (1:50)/50*(max(ticks)-min(ticks)),
ytop = rep(1,50),
ybottom= rep(0,50),col=couleurs,border=NA)
axis(1,ticks)
rect(xleft=min(ticks),xright=max(ticks),ytop=1,ybottom=0)
text(mean(coeff,na.rm=T),.5,'coefficients',cex=2,font=2)
par(mar=c(1,1,3,1))
image(1:n,1:k,t(coeff[k:1,]),axes=F,col=couleurs,zlim=range(ticks))
for(i in 1:n) for(j in 1:k) if(!is.na(coeff[j,i])) {
if(pval[j,i]<.01) symb = 'green'
else if( (pval[j,i]<.05) & (pval[j,i]>=.01)) symb = 'orange'
else if( (pval[j,i]<.1) & (pval[j,i]>=.05)) symb = 'red'
else symb = 'black'
polygon(c(i+.5 ,i+.2 ,i+.5 ,i+.5),
c(k-j+0.5,k-j+0.5,k-j+0.8,k-j+0.5),
col=symb)
if(j==choix) {
rect(xleft=i-.5,
xright=i+.5,
ybottom=k-j+1.5,
ytop=k-j+.5,
lwd=4)
text(i,
k-j+1,
round(coeff[j,i],2),
cex=1.2,
font=2)
}
else{
rect(xleft=i-.5,xright=i+.5,ybottom=k-j+1.5,ytop=k-j+.5)
text(i,k-j+1,round(coeff[j,i],2),cex=1.2,font=1)
}
}
axis(3,1:n,noms)
par(mar=c(0.5,0,0,0.5))
plot(0,axes=F,xlab='',ylab='',type='n',xlim=c(0,8),ylim=c(-.2,.8))
cols <- c('green','orange','red','black')
niv <- c('0','0.01','0.05','0.1')
for(i in 0:3){
polygon(c(1+2*i ,1+2*i ,1+2*i-.5 ,1+2*i),
c(.4 ,.7 , .4 , .4),
col=cols[i+1])
text(2*i,0.5,niv[i+1],cex=1.5)
}
text(8,.5,1,cex=1.5)
text(4,0,'p-value',cex=2)
box()
residus <- arimaSelect.out[[3]][[choix]]$res
par(mar=c(1,2,4,1))
acf(residus,main='')
title('acf',line=.5)
par(mar=c(1,2,4,1))
pacf(residus,main='')
title('pacf',line=.5)
par(mar=c(2,2,4,1))
qqnorm(residus,main='')
title('qq-norm',line=.5)
qqline(residus)
residus
}
if (par2 == 0) x <- log(x)
if (par2 != 0) x <- x^par2
(selection <- arimaSelect(x, order=c(par6,par3,par7), seasonal=list(order=c(par8,par4,par9), period=par5)))
bitmap(file='test1.png')
resid <- arimaSelectplot(selection)
dev.off()
resid
bitmap(file='test2.png')
acf(resid,length(resid)/2, main='Residual Autocorrelation Function')
dev.off()
bitmap(file='test3.png')
pacf(resid,length(resid)/2, main='Residual Partial Autocorrelation Function')
dev.off()
bitmap(file='test4.png')
cpgram(resid, main='Residual Cumulative Periodogram')
dev.off()
bitmap(file='test5.png')
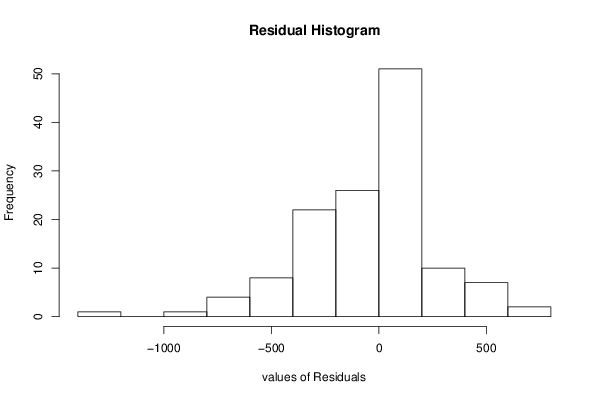
hist(resid, main='Residual Histogram', xlab='values of Residuals')
dev.off()
bitmap(file='test6.png')
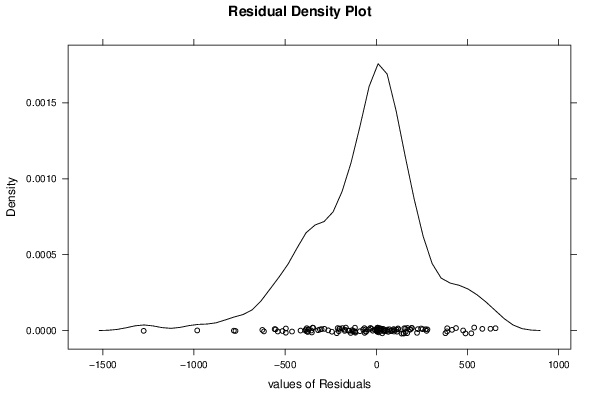
densityplot(~resid,col='black',main='Residual Density Plot', xlab='values of Residuals')
dev.off()
bitmap(file='test7.png')
qqnorm(resid, main='Residual Normal Q-Q Plot')
qqline(resid)
dev.off()
ncols <- length(selection[[1]][1,])
nrows <- length(selection[[2]][,1])-1
load(file='createtable')
a<-table.start()
a<-table.row.start(a)
a<-table.element(a,'ARIMA Parameter Estimation and Backward Selection', ncols+1,TRUE)
a<-table.row.end(a)
a<-table.row.start(a)
a<-table.element(a,'Iteration', header=TRUE)
for (i in 1:ncols) {
a<-table.element(a,names(selection[[3]][[1]]$coef)[i],header=TRUE)
}
a<-table.row.end(a)
for (j in 1:nrows) {
a<-table.row.start(a)
mydum <- 'Estimates ('
mydum <- paste(mydum,j)
mydum <- paste(mydum,')')
a<-table.element(a,mydum, header=TRUE)
for (i in 1:ncols) {
a<-table.element(a,round(selection[[1]][j,i],4))
}
a<-table.row.end(a)
a<-table.row.start(a)
a<-table.element(a,'(p-val)', header=TRUE)
for (i in 1:ncols) {
mydum <- '('
mydum <- paste(mydum,round(selection[[2]][j,i],4),sep='')
mydum <- paste(mydum,')')
a<-table.element(a,mydum)
}
a<-table.row.end(a)
}
a<-table.end(a)
table.save(a,file='mytable.tab')
a<-table.start()
a<-table.row.start(a)
a<-table.element(a,'Estimated ARIMA Residuals', 1,TRUE)
a<-table.row.end(a)
a<-table.row.start(a)
a<-table.element(a,'Value', 1,TRUE)
a<-table.row.end(a)
for (i in (par4*par5+par3):length(resid)) {
a<-table.row.start(a)
a<-table.element(a,resid[i])
a<-table.row.end(a)
}
a<-table.end(a)
table.save(a,file='mytable1.tab')