Free Statistics

of Irreproducible Research!

Author's title

Author*The author of this computation has been verified*
R Software Modulerwasp_arimaforecasting.wasp
Title produced by softwareARIMA Forecasting
Date of computationSun, 18 Jan 2015 18:44:32 +0000
Cite this page as followsStatistical Computations at FreeStatistics.org, Office for Research Development and Education, URL https://freestatistics.org/blog/index.php?v=date/2015/Jan/18/t14216066880tpqetatx08d6m9.htm/, Retrieved Tue, 14 May 2024 20:32:46 +0000
Statistical Computations at FreeStatistics.org, Office for Research Development and Education, URL https://freestatistics.org/blog/index.php?pk=274295, Retrieved Tue, 14 May 2024 20:32:46 +0000
QR Codes:

Original text written by user:
IsPrivate?No (this computation is public)
User-defined keywords
Estimated Impact71
Family? (F = Feedback message, R = changed R code, M = changed R Module, P = changed Parameters, D = changed Data)
-       [ARIMA Forecasting] [Exx6h] [2015-01-18 18:44:32] [4d754bf6e19324217bcb21f53e4ec277] [Current]
Feedback Forum

Post a new message
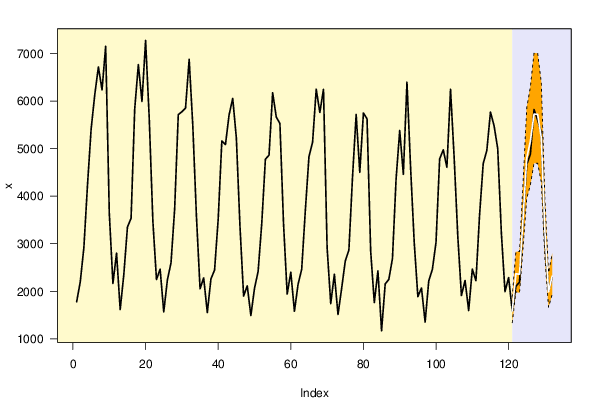
Dataseries X:
1775
2197
2920
4240
5415
6136
6719
6234
7152
3646
2165
2803
1615
2350
3350
3536
5834
6767
5993
7276
5641
3477
2247
2466
1567
2237
2598
3729
5715
5776
5852
6878
5488
3583
2054
2282
1552
2261
2446
3519
5161
5085
5711
6057
5224
3363
1899
2115
1491
2061
2419
3430
4778
4862
6176
5664
5529
3418
1941
2402
1579
2146
2462
3695
4831
5134
6250
5760
6249
2917
1741
2359
1511
2059
2635
2867
4403
5720
4502
5749
5627
2846
1762
2429
1169
2154
2249
2687
4359
5382
4459
6398
4596
3024
1887
2070
1351
2218
2461
3028
4784
4975
4607
6249
4809
3157
1910
2228
1594
2467
2222
3607
4685
4962
5770
5480
5000
3228
1993
2288
1588
2105
2191
3591
4668
4885
5822
5599
5340
3082
2010
2301


Summary of computational transaction
Raw Inputview raw input (R code)
Raw Outputview raw output of R engine
Computing time1 seconds
R Server'Sir Ronald Aylmer Fisher' @ fisher.wessa.net

\begin{tabular}{lllllllll}
\hline
Summary of computational transaction \tabularnewline
Raw Input & view raw input (R code)  \tabularnewline
Raw Output & view raw output of R engine  \tabularnewline
Computing time & 1 seconds \tabularnewline
R Server & 'Sir Ronald Aylmer Fisher' @ fisher.wessa.net \tabularnewline
\hline
\end{tabular}
%Source: https://freestatistics.org/blog/index.php?pk=274295&T=0

[TABLE]
[ROW][C]Summary of computational transaction[/C][/ROW]
[ROW][C]Raw Input[/C][C]view raw input (R code) [/C][/ROW]
[ROW][C]Raw Output[/C][C]view raw output of R engine [/C][/ROW]
[ROW][C]Computing time[/C][C]1 seconds[/C][/ROW]
[ROW][C]R Server[/C][C]'Sir Ronald Aylmer Fisher' @ fisher.wessa.net[/C][/ROW]
[/TABLE]
Source: https://freestatistics.org/blog/index.php?pk=274295&T=0

Globally Unique Identifier (entire table): ba.freestatistics.org/blog/index.php?pk=274295&T=0

As an alternative you can also use a QR Code:  

The GUIDs for individual cells are displayed in the table below:

Summary of computational transaction
Raw Inputview raw input (R code)
Raw Outputview raw output of R engine
Computing time1 seconds
R Server'Sir Ronald Aylmer Fisher' @ fisher.wessa.net


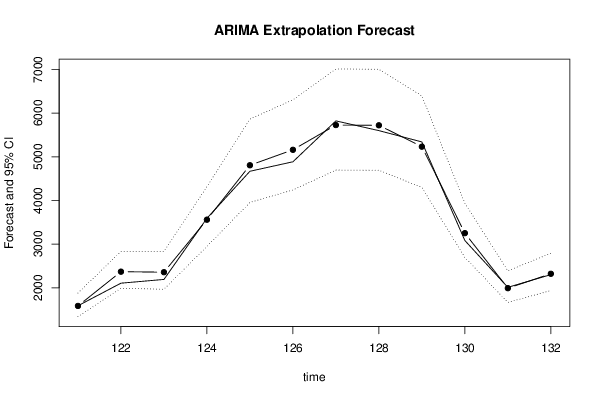
Univariate ARIMA Extrapolation Forecast
timeY[t]F[t]95% LB95% UBp-value(H0: Y[t] = F[t])P(F[t]>Y[t-1])P(F[t]>Y[t-s])P(F[t]>Y[120])
1082228-------
1091594-------
1102467-------
1112222-------
1123607-------
1134685-------
1144962-------
1155770.00000000001-------
1165480.00000000001-------
1175000-------
1183228-------
1191993-------
1202288-------
12115881583.69231338.4841879.22370.488600.47270
12221052368.7211988.20742830.88170.13170.99950.33840.634
12321912356.64291966.02242834.33910.24840.84910.70970.6109
12435913559.32622946.96334314.58170.46720.99980.45080.9995
12546684805.71173954.41025862.96850.39920.98780.58851
12648855159.74844239.87846303.93380.31890.80020.63261
12758225726.3454695.72397011.27610.4420.90030.47351
12855995720.62814691.12667004.13540.42630.43850.64341
12953405231.75754297.73576393.94480.42760.26780.6521
13030823250.78182694.70923935.6960.314500.5260.9971
13120101990.32061664.65862387.4410.461300.49470.0709
13223012320.61021935.59572791.55060.46750.90190.5540.554

\begin{tabular}{lllllllll}
\hline
Univariate ARIMA Extrapolation Forecast \tabularnewline
time & Y[t] & F[t] & 95% LB & 95% UB & p-value(H0: Y[t] = F[t]) & P(F[t]>Y[t-1]) & P(F[t]>Y[t-s]) & P(F[t]>Y[120]) \tabularnewline
108 & 2228 & - & - & - & - & - & - & - \tabularnewline
109 & 1594 & - & - & - & - & - & - & - \tabularnewline
110 & 2467 & - & - & - & - & - & - & - \tabularnewline
111 & 2222 & - & - & - & - & - & - & - \tabularnewline
112 & 3607 & - & - & - & - & - & - & - \tabularnewline
113 & 4685 & - & - & - & - & - & - & - \tabularnewline
114 & 4962 & - & - & - & - & - & - & - \tabularnewline
115 & 5770.00000000001 & - & - & - & - & - & - & - \tabularnewline
116 & 5480.00000000001 & - & - & - & - & - & - & - \tabularnewline
117 & 5000 & - & - & - & - & - & - & - \tabularnewline
118 & 3228 & - & - & - & - & - & - & - \tabularnewline
119 & 1993 & - & - & - & - & - & - & - \tabularnewline
120 & 2288 & - & - & - & - & - & - & - \tabularnewline
121 & 1588 & 1583.6923 & 1338.484 & 1879.2237 & 0.4886 & 0 & 0.4727 & 0 \tabularnewline
122 & 2105 & 2368.721 & 1988.2074 & 2830.8817 & 0.1317 & 0.9995 & 0.3384 & 0.634 \tabularnewline
123 & 2191 & 2356.6429 & 1966.0224 & 2834.3391 & 0.2484 & 0.8491 & 0.7097 & 0.6109 \tabularnewline
124 & 3591 & 3559.3262 & 2946.9633 & 4314.5817 & 0.4672 & 0.9998 & 0.4508 & 0.9995 \tabularnewline
125 & 4668 & 4805.7117 & 3954.4102 & 5862.9685 & 0.3992 & 0.9878 & 0.5885 & 1 \tabularnewline
126 & 4885 & 5159.7484 & 4239.8784 & 6303.9338 & 0.3189 & 0.8002 & 0.6326 & 1 \tabularnewline
127 & 5822 & 5726.345 & 4695.7239 & 7011.2761 & 0.442 & 0.9003 & 0.4735 & 1 \tabularnewline
128 & 5599 & 5720.6281 & 4691.1266 & 7004.1354 & 0.4263 & 0.4385 & 0.6434 & 1 \tabularnewline
129 & 5340 & 5231.7575 & 4297.7357 & 6393.9448 & 0.4276 & 0.2678 & 0.652 & 1 \tabularnewline
130 & 3082 & 3250.7818 & 2694.7092 & 3935.696 & 0.3145 & 0 & 0.526 & 0.9971 \tabularnewline
131 & 2010 & 1990.3206 & 1664.6586 & 2387.441 & 0.4613 & 0 & 0.4947 & 0.0709 \tabularnewline
132 & 2301 & 2320.6102 & 1935.5957 & 2791.5506 & 0.4675 & 0.9019 & 0.554 & 0.554 \tabularnewline
\hline
\end{tabular}
%Source: https://freestatistics.org/blog/index.php?pk=274295&T=1

[TABLE]
[ROW][C]Univariate ARIMA Extrapolation Forecast[/C][/ROW]
[ROW][C]time[/C][C]Y[t][/C][C]F[t][/C][C]95% LB[/C][C]95% UB[/C][C]p-value(H0: Y[t] = F[t])[/C][C]P(F[t]>Y[t-1])[/C][C]P(F[t]>Y[t-s])[/C][C]P(F[t]>Y[120])[/C][/ROW]
[ROW][C]108[/C][C]2228[/C][C]-[/C][C]-[/C][C]-[/C][C]-[/C][C]-[/C][C]-[/C][C]-[/C][/ROW]
[ROW][C]109[/C][C]1594[/C][C]-[/C][C]-[/C][C]-[/C][C]-[/C][C]-[/C][C]-[/C][C]-[/C][/ROW]
[ROW][C]110[/C][C]2467[/C][C]-[/C][C]-[/C][C]-[/C][C]-[/C][C]-[/C][C]-[/C][C]-[/C][/ROW]
[ROW][C]111[/C][C]2222[/C][C]-[/C][C]-[/C][C]-[/C][C]-[/C][C]-[/C][C]-[/C][C]-[/C][/ROW]
[ROW][C]112[/C][C]3607[/C][C]-[/C][C]-[/C][C]-[/C][C]-[/C][C]-[/C][C]-[/C][C]-[/C][/ROW]
[ROW][C]113[/C][C]4685[/C][C]-[/C][C]-[/C][C]-[/C][C]-[/C][C]-[/C][C]-[/C][C]-[/C][/ROW]
[ROW][C]114[/C][C]4962[/C][C]-[/C][C]-[/C][C]-[/C][C]-[/C][C]-[/C][C]-[/C][C]-[/C][/ROW]
[ROW][C]115[/C][C]5770.00000000001[/C][C]-[/C][C]-[/C][C]-[/C][C]-[/C][C]-[/C][C]-[/C][C]-[/C][/ROW]
[ROW][C]116[/C][C]5480.00000000001[/C][C]-[/C][C]-[/C][C]-[/C][C]-[/C][C]-[/C][C]-[/C][C]-[/C][/ROW]
[ROW][C]117[/C][C]5000[/C][C]-[/C][C]-[/C][C]-[/C][C]-[/C][C]-[/C][C]-[/C][C]-[/C][/ROW]
[ROW][C]118[/C][C]3228[/C][C]-[/C][C]-[/C][C]-[/C][C]-[/C][C]-[/C][C]-[/C][C]-[/C][/ROW]
[ROW][C]119[/C][C]1993[/C][C]-[/C][C]-[/C][C]-[/C][C]-[/C][C]-[/C][C]-[/C][C]-[/C][/ROW]
[ROW][C]120[/C][C]2288[/C][C]-[/C][C]-[/C][C]-[/C][C]-[/C][C]-[/C][C]-[/C][C]-[/C][/ROW]
[ROW][C]121[/C][C]1588[/C][C]1583.6923[/C][C]1338.484[/C][C]1879.2237[/C][C]0.4886[/C][C]0[/C][C]0.4727[/C][C]0[/C][/ROW]
[ROW][C]122[/C][C]2105[/C][C]2368.721[/C][C]1988.2074[/C][C]2830.8817[/C][C]0.1317[/C][C]0.9995[/C][C]0.3384[/C][C]0.634[/C][/ROW]
[ROW][C]123[/C][C]2191[/C][C]2356.6429[/C][C]1966.0224[/C][C]2834.3391[/C][C]0.2484[/C][C]0.8491[/C][C]0.7097[/C][C]0.6109[/C][/ROW]
[ROW][C]124[/C][C]3591[/C][C]3559.3262[/C][C]2946.9633[/C][C]4314.5817[/C][C]0.4672[/C][C]0.9998[/C][C]0.4508[/C][C]0.9995[/C][/ROW]
[ROW][C]125[/C][C]4668[/C][C]4805.7117[/C][C]3954.4102[/C][C]5862.9685[/C][C]0.3992[/C][C]0.9878[/C][C]0.5885[/C][C]1[/C][/ROW]
[ROW][C]126[/C][C]4885[/C][C]5159.7484[/C][C]4239.8784[/C][C]6303.9338[/C][C]0.3189[/C][C]0.8002[/C][C]0.6326[/C][C]1[/C][/ROW]
[ROW][C]127[/C][C]5822[/C][C]5726.345[/C][C]4695.7239[/C][C]7011.2761[/C][C]0.442[/C][C]0.9003[/C][C]0.4735[/C][C]1[/C][/ROW]
[ROW][C]128[/C][C]5599[/C][C]5720.6281[/C][C]4691.1266[/C][C]7004.1354[/C][C]0.4263[/C][C]0.4385[/C][C]0.6434[/C][C]1[/C][/ROW]
[ROW][C]129[/C][C]5340[/C][C]5231.7575[/C][C]4297.7357[/C][C]6393.9448[/C][C]0.4276[/C][C]0.2678[/C][C]0.652[/C][C]1[/C][/ROW]
[ROW][C]130[/C][C]3082[/C][C]3250.7818[/C][C]2694.7092[/C][C]3935.696[/C][C]0.3145[/C][C]0[/C][C]0.526[/C][C]0.9971[/C][/ROW]
[ROW][C]131[/C][C]2010[/C][C]1990.3206[/C][C]1664.6586[/C][C]2387.441[/C][C]0.4613[/C][C]0[/C][C]0.4947[/C][C]0.0709[/C][/ROW]
[ROW][C]132[/C][C]2301[/C][C]2320.6102[/C][C]1935.5957[/C][C]2791.5506[/C][C]0.4675[/C][C]0.9019[/C][C]0.554[/C][C]0.554[/C][/ROW]
[/TABLE]
Source: https://freestatistics.org/blog/index.php?pk=274295&T=1

Globally Unique Identifier (entire table): ba.freestatistics.org/blog/index.php?pk=274295&T=1

As an alternative you can also use a QR Code:  

The GUIDs for individual cells are displayed in the table below:

Univariate ARIMA Extrapolation Forecast
timeY[t]F[t]95% LB95% UBp-value(H0: Y[t] = F[t])P(F[t]>Y[t-1])P(F[t]>Y[t-s])P(F[t]>Y[120])
1082228-------
1091594-------
1102467-------
1112222-------
1123607-------
1134685-------
1144962-------
1155770.00000000001-------
1165480.00000000001-------
1175000-------
1183228-------
1191993-------
1202288-------
12115881583.69231338.4841879.22370.488600.47270
12221052368.7211988.20742830.88170.13170.99950.33840.634
12321912356.64291966.02242834.33910.24840.84910.70970.6109
12435913559.32622946.96334314.58170.46720.99980.45080.9995
12546684805.71173954.41025862.96850.39920.98780.58851
12648855159.74844239.87846303.93380.31890.80020.63261
12758225726.3454695.72397011.27610.4420.90030.47351
12855995720.62814691.12667004.13540.42630.43850.64341
12953405231.75754297.73576393.94480.42760.26780.6521
13030823250.78182694.70923935.6960.314500.5260.9971
13120101990.32061664.65862387.4410.461300.49470.0709
13223012320.61021935.59572791.55060.46750.90190.5540.554


Univariate ARIMA Extrapolation Forecast Performance
time% S.E.PEMAPEsMAPESq.EMSERMSEScaledEMASE
1210.09520.00270.00270.002718.5563000.00570.0057
1220.0995-0.12530.0640.060369548.79234783.6741186.5038-0.3480.1768
1230.1034-0.07560.06790.064527437.56732334.9717179.8193-0.21860.1907
1240.10830.00880.05310.05061003.227624502.0357156.53130.04180.1535
1250.1122-0.02950.04840.046318964.523223394.5332152.9527-0.18170.1591
1260.1131-0.05620.04970.047775486.666632076.5554179.0993-0.36250.193
1270.11450.01640.04490.04329149.879128801.316169.70950.12620.1835
1280.1145-0.02170.0420.040514793.388327050.325164.4698-0.16050.1806
1290.11330.02030.03960.038311716.440925346.5601159.2060.14280.1764
1300.1075-0.05480.04110.039828487.309125660.635160.1894-0.22270.181
1310.10180.00980.03830.0371387.279723363.0572152.84980.0260.1669
1320.1035-0.00850.03580.0347384.559221448.1824146.452-0.02590.1552

\begin{tabular}{lllllllll}
\hline
Univariate ARIMA Extrapolation Forecast Performance \tabularnewline
time & % S.E. & PE & MAPE & sMAPE & Sq.E & MSE & RMSE & ScaledE & MASE \tabularnewline
121 & 0.0952 & 0.0027 & 0.0027 & 0.0027 & 18.5563 & 0 & 0 & 0.0057 & 0.0057 \tabularnewline
122 & 0.0995 & -0.1253 & 0.064 & 0.0603 & 69548.792 & 34783.6741 & 186.5038 & -0.348 & 0.1768 \tabularnewline
123 & 0.1034 & -0.0756 & 0.0679 & 0.0645 & 27437.567 & 32334.9717 & 179.8193 & -0.2186 & 0.1907 \tabularnewline
124 & 0.1083 & 0.0088 & 0.0531 & 0.0506 & 1003.2276 & 24502.0357 & 156.5313 & 0.0418 & 0.1535 \tabularnewline
125 & 0.1122 & -0.0295 & 0.0484 & 0.0463 & 18964.5232 & 23394.5332 & 152.9527 & -0.1817 & 0.1591 \tabularnewline
126 & 0.1131 & -0.0562 & 0.0497 & 0.0477 & 75486.6666 & 32076.5554 & 179.0993 & -0.3625 & 0.193 \tabularnewline
127 & 0.1145 & 0.0164 & 0.0449 & 0.0432 & 9149.8791 & 28801.316 & 169.7095 & 0.1262 & 0.1835 \tabularnewline
128 & 0.1145 & -0.0217 & 0.042 & 0.0405 & 14793.3883 & 27050.325 & 164.4698 & -0.1605 & 0.1806 \tabularnewline
129 & 0.1133 & 0.0203 & 0.0396 & 0.0383 & 11716.4409 & 25346.5601 & 159.206 & 0.1428 & 0.1764 \tabularnewline
130 & 0.1075 & -0.0548 & 0.0411 & 0.0398 & 28487.3091 & 25660.635 & 160.1894 & -0.2227 & 0.181 \tabularnewline
131 & 0.1018 & 0.0098 & 0.0383 & 0.0371 & 387.2797 & 23363.0572 & 152.8498 & 0.026 & 0.1669 \tabularnewline
132 & 0.1035 & -0.0085 & 0.0358 & 0.0347 & 384.5592 & 21448.1824 & 146.452 & -0.0259 & 0.1552 \tabularnewline
\hline
\end{tabular}
%Source: https://freestatistics.org/blog/index.php?pk=274295&T=2

[TABLE]
[ROW][C]Univariate ARIMA Extrapolation Forecast Performance[/C][/ROW]
[ROW][C]time[/C][C]% S.E.[/C][C]PE[/C][C]MAPE[/C][C]sMAPE[/C][C]Sq.E[/C][C]MSE[/C][C]RMSE[/C][C]ScaledE[/C][C]MASE[/C][/ROW]
[ROW][C]121[/C][C]0.0952[/C][C]0.0027[/C][C]0.0027[/C][C]0.0027[/C][C]18.5563[/C][C]0[/C][C]0[/C][C]0.0057[/C][C]0.0057[/C][/ROW]
[ROW][C]122[/C][C]0.0995[/C][C]-0.1253[/C][C]0.064[/C][C]0.0603[/C][C]69548.792[/C][C]34783.6741[/C][C]186.5038[/C][C]-0.348[/C][C]0.1768[/C][/ROW]
[ROW][C]123[/C][C]0.1034[/C][C]-0.0756[/C][C]0.0679[/C][C]0.0645[/C][C]27437.567[/C][C]32334.9717[/C][C]179.8193[/C][C]-0.2186[/C][C]0.1907[/C][/ROW]
[ROW][C]124[/C][C]0.1083[/C][C]0.0088[/C][C]0.0531[/C][C]0.0506[/C][C]1003.2276[/C][C]24502.0357[/C][C]156.5313[/C][C]0.0418[/C][C]0.1535[/C][/ROW]
[ROW][C]125[/C][C]0.1122[/C][C]-0.0295[/C][C]0.0484[/C][C]0.0463[/C][C]18964.5232[/C][C]23394.5332[/C][C]152.9527[/C][C]-0.1817[/C][C]0.1591[/C][/ROW]
[ROW][C]126[/C][C]0.1131[/C][C]-0.0562[/C][C]0.0497[/C][C]0.0477[/C][C]75486.6666[/C][C]32076.5554[/C][C]179.0993[/C][C]-0.3625[/C][C]0.193[/C][/ROW]
[ROW][C]127[/C][C]0.1145[/C][C]0.0164[/C][C]0.0449[/C][C]0.0432[/C][C]9149.8791[/C][C]28801.316[/C][C]169.7095[/C][C]0.1262[/C][C]0.1835[/C][/ROW]
[ROW][C]128[/C][C]0.1145[/C][C]-0.0217[/C][C]0.042[/C][C]0.0405[/C][C]14793.3883[/C][C]27050.325[/C][C]164.4698[/C][C]-0.1605[/C][C]0.1806[/C][/ROW]
[ROW][C]129[/C][C]0.1133[/C][C]0.0203[/C][C]0.0396[/C][C]0.0383[/C][C]11716.4409[/C][C]25346.5601[/C][C]159.206[/C][C]0.1428[/C][C]0.1764[/C][/ROW]
[ROW][C]130[/C][C]0.1075[/C][C]-0.0548[/C][C]0.0411[/C][C]0.0398[/C][C]28487.3091[/C][C]25660.635[/C][C]160.1894[/C][C]-0.2227[/C][C]0.181[/C][/ROW]
[ROW][C]131[/C][C]0.1018[/C][C]0.0098[/C][C]0.0383[/C][C]0.0371[/C][C]387.2797[/C][C]23363.0572[/C][C]152.8498[/C][C]0.026[/C][C]0.1669[/C][/ROW]
[ROW][C]132[/C][C]0.1035[/C][C]-0.0085[/C][C]0.0358[/C][C]0.0347[/C][C]384.5592[/C][C]21448.1824[/C][C]146.452[/C][C]-0.0259[/C][C]0.1552[/C][/ROW]
[/TABLE]
Source: https://freestatistics.org/blog/index.php?pk=274295&T=2

Globally Unique Identifier (entire table): ba.freestatistics.org/blog/index.php?pk=274295&T=2

As an alternative you can also use a QR Code:  

The GUIDs for individual cells are displayed in the table below:

Univariate ARIMA Extrapolation Forecast Performance
time% S.E.PEMAPEsMAPESq.EMSERMSEScaledEMASE
1210.09520.00270.00270.002718.5563000.00570.0057
1220.0995-0.12530.0640.060369548.79234783.6741186.5038-0.3480.1768
1230.1034-0.07560.06790.064527437.56732334.9717179.8193-0.21860.1907
1240.10830.00880.05310.05061003.227624502.0357156.53130.04180.1535
1250.1122-0.02950.04840.046318964.523223394.5332152.9527-0.18170.1591
1260.1131-0.05620.04970.047775486.666632076.5554179.0993-0.36250.193
1270.11450.01640.04490.04329149.879128801.316169.70950.12620.1835
1280.1145-0.02170.0420.040514793.388327050.325164.4698-0.16050.1806
1290.11330.02030.03960.038311716.440925346.5601159.2060.14280.1764
1300.1075-0.05480.04110.039828487.309125660.635160.1894-0.22270.181
1310.10180.00980.03830.0371387.279723363.0572152.84980.0260.1669
1320.1035-0.00850.03580.0347384.559221448.1824146.452-0.02590.1552


Parameters (Session):
par1 = 12 ;
Parameters (R input):
par1 = 12 ; par2 = -0.1 ; par3 = 0 ; par4 = 1 ; par5 = 12 ; par6 = 2 ; par7 = 0 ; par8 = 1 ; par9 = 1 ; par10 = FALSE ;
R code (references can be found in the software module):
par1 <- as.numeric(par1) #cut off periods
par2 <- as.numeric(par2) #lambda
par3 <- as.numeric(par3) #degree of non-seasonal differencing
par4 <- as.numeric(par4) #degree of seasonal differencing
par5 <- as.numeric(par5) #seasonal period
par6 <- as.numeric(par6) #p
par7 <- as.numeric(par7) #q
par8 <- as.numeric(par8) #P
par9 <- as.numeric(par9) #Q
if (par10 == 'TRUE') par10 <- TRUE
if (par10 == 'FALSE') par10 <- FALSE
if (par2 == 0) x <- log(x)
if (par2 != 0) x <- x^par2
lx <- length(x)
first <- lx - 2*par1
nx <- lx - par1
nx1 <- nx + 1
fx <- lx - nx
if (fx < 1) {
fx <- par5
nx1 <- lx + fx - 1
first <- lx - 2*fx
}
first <- 1
if (fx < 3) fx <- round(lx/10,0)
(arima.out <- arima(x[1:nx], order=c(par6,par3,par7), seasonal=list(order=c(par8,par4,par9), period=par5), include.mean=par10, method='ML'))
(forecast <- predict(arima.out,par1))
(lb <- forecast$pred - 1.96 * forecast$se)
(ub <- forecast$pred + 1.96 * forecast$se)
if (par2 == 0) {
x <- exp(x)
forecast$pred <- exp(forecast$pred)
lb <- exp(lb)
ub <- exp(ub)
}
if (par2 != 0) {
x <- x^(1/par2)
forecast$pred <- forecast$pred^(1/par2)
lb <- lb^(1/par2)
ub <- ub^(1/par2)
}
if (par2 < 0) {
olb <- lb
lb <- ub
ub <- olb
}
(actandfor <- c(x[1:nx], forecast$pred))
(perc.se <- (ub-forecast$pred)/1.96/forecast$pred)
bitmap(file='test1.png')
opar <- par(mar=c(4,4,2,2),las=1)
ylim <- c( min(x[first:nx],lb), max(x[first:nx],ub))
plot(x,ylim=ylim,type='n',xlim=c(first,lx))
usr <- par('usr')
rect(usr[1],usr[3],nx+1,usr[4],border=NA,col='lemonchiffon')
rect(nx1,usr[3],usr[2],usr[4],border=NA,col='lavender')
abline(h= (-3:3)*2 , col ='gray', lty =3)
polygon( c(nx1:lx,lx:nx1), c(lb,rev(ub)), col = 'orange', lty=2,border=NA)
lines(nx1:lx, lb , lty=2)
lines(nx1:lx, ub , lty=2)
lines(x, lwd=2)
lines(nx1:lx, forecast$pred , lwd=2 , col ='white')
box()
par(opar)
dev.off()
prob.dec <- array(NA, dim=fx)
prob.sdec <- array(NA, dim=fx)
prob.ldec <- array(NA, dim=fx)
prob.pval <- array(NA, dim=fx)
perf.pe <- array(0, dim=fx)
perf.spe <- array(0, dim=fx)
perf.scalederr <- array(0, dim=fx)
perf.mase <- array(0, dim=fx)
perf.mase1 <- array(0, dim=fx)
perf.mape <- array(0, dim=fx)
perf.smape <- array(0, dim=fx)
perf.mape1 <- array(0, dim=fx)
perf.smape1 <- array(0,dim=fx)
perf.se <- array(0, dim=fx)
perf.mse <- array(0, dim=fx)
perf.mse1 <- array(0, dim=fx)
perf.rmse <- array(0, dim=fx)
perf.scaleddenom <- 0
for (i in 2:fx) {
perf.scaleddenom = perf.scaleddenom + abs(x[nx+i] - x[nx+i-1])
}
perf.scaleddenom = perf.scaleddenom / (fx-1)
for (i in 1:fx) {
locSD <- (ub[i] - forecast$pred[i]) / 1.96
perf.scalederr[i] = (x[nx+i] - forecast$pred[i]) / perf.scaleddenom
perf.pe[i] = (x[nx+i] - forecast$pred[i]) / x[nx+i]
perf.spe[i] = 2*(x[nx+i] - forecast$pred[i]) / (x[nx+i] + forecast$pred[i])
perf.se[i] = (x[nx+i] - forecast$pred[i])^2
prob.dec[i] = pnorm((x[nx+i-1] - forecast$pred[i]) / locSD)
prob.sdec[i] = pnorm((x[nx+i-par5] - forecast$pred[i]) / locSD)
prob.ldec[i] = pnorm((x[nx] - forecast$pred[i]) / locSD)
prob.pval[i] = pnorm(abs(x[nx+i] - forecast$pred[i]) / locSD)
}
perf.mape[1] = abs(perf.pe[1])
perf.smape[1] = abs(perf.spe[1])
perf.mape1[1] = perf.mape[1]
perf.smape1[1] = perf.smape[1]
perf.mse[1] = perf.se[1]
perf.mase[1] = abs(perf.scalederr[1])
perf.mase1[1] = perf.mase[1]
for (i in 2:fx) {
perf.mape[i] = perf.mape[i-1] + abs(perf.pe[i])
perf.mape1[i] = perf.mape[i] / i
perf.smape[i] = perf.smape[i-1] + abs(perf.spe[i])
perf.smape1[i] = perf.smape[i] / i
perf.mse[i] = perf.mse[i-1] + perf.se[i]
perf.mse1[i] = perf.mse[i] / i
perf.mase[i] = perf.mase[i-1] + abs(perf.scalederr[i])
perf.mase1[i] = perf.mase[i] / i
}
perf.rmse = sqrt(perf.mse1)
bitmap(file='test2.png')
plot(forecast$pred, pch=19, type='b',main='ARIMA Extrapolation Forecast', ylab='Forecast and 95% CI', xlab='time',ylim=c(min(lb),max(ub)))
dum <- forecast$pred
dum[1:par1] <- x[(nx+1):lx]
lines(dum, lty=1)
lines(ub,lty=3)
lines(lb,lty=3)
dev.off()
load(file='createtable')
a<-table.start()
a<-table.row.start(a)
a<-table.element(a,'Univariate ARIMA Extrapolation Forecast',9,TRUE)
a<-table.row.end(a)
a<-table.row.start(a)
a<-table.element(a,'time',1,header=TRUE)
a<-table.element(a,'Y[t]',1,header=TRUE)
a<-table.element(a,'F[t]',1,header=TRUE)
a<-table.element(a,'95% LB',1,header=TRUE)
a<-table.element(a,'95% UB',1,header=TRUE)
a<-table.element(a,'p-value
(H0: Y[t] = F[t])',1,header=TRUE)
a<-table.element(a,'P(F[t]>Y[t-1])',1,header=TRUE)
a<-table.element(a,'P(F[t]>Y[t-s])',1,header=TRUE)
mylab <- paste('P(F[t]>Y[',nx,sep='')
mylab <- paste(mylab,'])',sep='')
a<-table.element(a,mylab,1,header=TRUE)
a<-table.row.end(a)
for (i in (nx-par5):nx) {
a<-table.row.start(a)
a<-table.element(a,i,header=TRUE)
a<-table.element(a,x[i])
a<-table.element(a,'-')
a<-table.row.end(a)
}
for (i in 1:fx) {
a<-table.row.start(a)
a<-table.element(a,nx+i,header=TRUE)
a<-table.element(a,round(x[nx+i],4))
a<-table.element(a,round(forecast$pred[i],4))
a<-table.element(a,round(lb[i],4))
a<-table.element(a,round(ub[i],4))
a<-table.element(a,round((1-prob.pval[i]),4))
a<-table.element(a,round((1-prob.dec[i]),4))
a<-table.element(a,round((1-prob.sdec[i]),4))
a<-table.element(a,round((1-prob.ldec[i]),4))
a<-table.row.end(a)
}
a<-table.end(a)
table.save(a,file='mytable.tab')
a<-table.start()
a<-table.row.start(a)
a<-table.element(a,'Univariate ARIMA Extrapolation Forecast Performance',10,TRUE)
a<-table.row.end(a)
a<-table.row.start(a)
a<-table.element(a,'time',1,header=TRUE)
a<-table.element(a,'% S.E.',1,header=TRUE)
a<-table.element(a,'PE',1,header=TRUE)
a<-table.element(a,'MAPE',1,header=TRUE)
a<-table.element(a,'sMAPE',1,header=TRUE)
a<-table.element(a,'Sq.E',1,header=TRUE)
a<-table.element(a,'MSE',1,header=TRUE)
a<-table.element(a,'RMSE',1,header=TRUE)
a<-table.element(a,'ScaledE',1,header=TRUE)
a<-table.element(a,'MASE',1,header=TRUE)
a<-table.row.end(a)
for (i in 1:fx) {
a<-table.row.start(a)
a<-table.element(a,nx+i,header=TRUE)
a<-table.element(a,round(perc.se[i],4))
a<-table.element(a,round(perf.pe[i],4))
a<-table.element(a,round(perf.mape1[i],4))
a<-table.element(a,round(perf.smape1[i],4))
a<-table.element(a,round(perf.se[i],4))
a<-table.element(a,round(perf.mse1[i],4))
a<-table.element(a,round(perf.rmse[i],4))
a<-table.element(a,round(perf.scalederr[i],4))
a<-table.element(a,round(perf.mase1[i],4))
a<-table.row.end(a)
}
a<-table.end(a)
table.save(a,file='mytable1.tab')