Free Statistics

of Irreproducible Research!

Author's title

Author*The author of this computation has been verified*
R Software Modulerwasp_chi_squared_tests.wasp
Title produced by softwareChi-Squared Test, McNemar Test, and Fisher Exact Test
Date of computationFri, 16 Jan 2015 09:12:16 +0000
Cite this page as followsStatistical Computations at FreeStatistics.org, Office for Research Development and Education, URL https://freestatistics.org/blog/index.php?v=date/2015/Jan/16/t1421399559d4g51wyz3tdhs9u.htm/, Retrieved Wed, 15 May 2024 12:59:00 +0000
Statistical Computations at FreeStatistics.org, Office for Research Development and Education, URL https://freestatistics.org/blog/index.php?pk=273557, Retrieved Wed, 15 May 2024 12:59:00 +0000
QR Codes:

Original text written by user:
IsPrivate?No (this computation is public)
User-defined keywords
Estimated Impact50
Family? (F = Feedback message, R = changed R code, M = changed R Module, P = changed Parameters, D = changed Data)
-       [Chi-Squared Test, McNemar Test, and Fisher Exact Test] [exvraag2] [2015-01-16 09:12:16] [ed430294c8c72e971ea4ab2a5db53ca2] [Current]
Feedback Forum

Post a new message
Dataseries X:
4.2 "'VC'" 0.5
11.5 "'VC'" 0.5
7.3 "'VC'" 0.5
5.8 "'VC'" 0.5
6.4 "'VC'" 0.5
10 "'VC'" 0.5
11.2 "'VC'" 0.5
11.2 "'VC'" 0.5
5.2 "'VC'" 0.5
7 "'VC'" 0.5
16.5 "'VC'" 1
16.5 "'VC'" 1
15.2 "'VC'" 1
17.3 "'VC'" 1
22.5 "'VC'" 1
17.3 "'VC'" 1
13.6 "'VC'" 1
14.5 "'VC'" 1
18.8 "'VC'" 1
15.5 "'VC'" 1
23.6 "'VC'" 2
18.5 "'VC'" 2
33.9 "'VC'" 2
25.5 "'VC'" 2
26.4 "'VC'" 2
32.5 "'VC'" 2
26.7 "'VC'" 2
21.5 "'VC'" 2
23.3 "'VC'" 2
29.5 "'VC'" 2
15.2 "'OJ'" 0.5
21.5 "'OJ'" 0.5
17.6 "'OJ'" 0.5
9.7 "'OJ'" 0.5
14.5 "'OJ'" 0.5
10 "'OJ'" 0.5
8.2 "'OJ'" 0.5
9.4 "'OJ'" 0.5
16.5 "'OJ'" 0.5
9.7 "'OJ'" 0.5
19.7 "'OJ'" 1
23.3 "'OJ'" 1
23.6 "'OJ'" 1
26.4 "'OJ'" 1
20 "'OJ'" 1
25.2 "'OJ'" 1
25.8 "'OJ'" 1
21.2 "'OJ'" 1
14.5 "'OJ'" 1
27.3 "'OJ'" 1
25.5 "'OJ'" 2
26.4 "'OJ'" 2
22.4 "'OJ'" 2
24.5 "'OJ'" 2
24.8 "'OJ'" 2
30.9 "'OJ'" 2
26.4 "'OJ'" 2
27.3 "'OJ'" 2
29.4 "'OJ'" 2
23 "'OJ'" 2


Summary of computational transaction
Raw Inputview raw input (R code)
Raw Outputview raw output of R engine
Computing time2 seconds
R Server'Gwilym Jenkins' @ jenkins.wessa.net

\begin{tabular}{lllllllll}
\hline
Summary of computational transaction \tabularnewline
Raw Input & view raw input (R code)  \tabularnewline
Raw Output & view raw output of R engine  \tabularnewline
Computing time & 2 seconds \tabularnewline
R Server & 'Gwilym Jenkins' @ jenkins.wessa.net \tabularnewline
\hline
\end{tabular}
%Source: https://freestatistics.org/blog/index.php?pk=273557&T=0

[TABLE]
[ROW][C]Summary of computational transaction[/C][/ROW]
[ROW][C]Raw Input[/C][C]view raw input (R code) [/C][/ROW]
[ROW][C]Raw Output[/C][C]view raw output of R engine [/C][/ROW]
[ROW][C]Computing time[/C][C]2 seconds[/C][/ROW]
[ROW][C]R Server[/C][C]'Gwilym Jenkins' @ jenkins.wessa.net[/C][/ROW]
[/TABLE]
Source: https://freestatistics.org/blog/index.php?pk=273557&T=0

Globally Unique Identifier (entire table): ba.freestatistics.org/blog/index.php?pk=273557&T=0

As an alternative you can also use a QR Code:  

The GUIDs for individual cells are displayed in the table below:

Summary of computational transaction
Raw Inputview raw input (R code)
Raw Outputview raw output of R engine
Computing time2 seconds
R Server'Gwilym Jenkins' @ jenkins.wessa.net


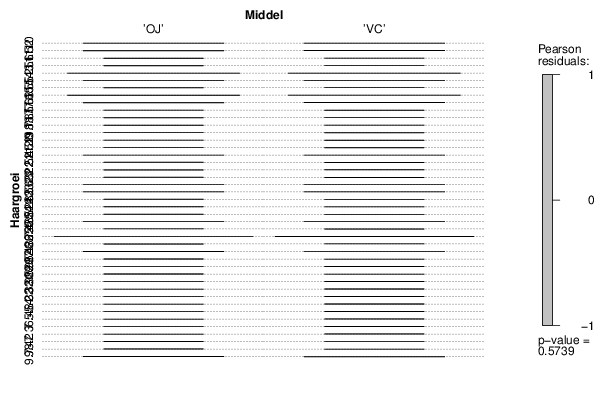
Tabulation of Results
Haargroei x Middel
'OJ''VC'
1011
11.202
11.501
13.601
14.521
15.211
15.501
16.512
17.302
17.610
18.501
18.801
19.710
2010
21.210
21.511
22.410
22.501
2310
23.311
23.611
24.510
24.810
25.210
25.511
25.810
26.431
26.701
27.320
29.410
29.501
30.910
32.501
33.901
4.201
5.201
5.801
6.401
701
7.301
8.210
9.410
9.720

\begin{tabular}{lllllllll}
\hline
Tabulation of Results \tabularnewline
Haargroei  x  Middel \tabularnewline
  & 'OJ' & 'VC' \tabularnewline
10 & 1 & 1 \tabularnewline
11.2 & 0 & 2 \tabularnewline
11.5 & 0 & 1 \tabularnewline
13.6 & 0 & 1 \tabularnewline
14.5 & 2 & 1 \tabularnewline
15.2 & 1 & 1 \tabularnewline
15.5 & 0 & 1 \tabularnewline
16.5 & 1 & 2 \tabularnewline
17.3 & 0 & 2 \tabularnewline
17.6 & 1 & 0 \tabularnewline
18.5 & 0 & 1 \tabularnewline
18.8 & 0 & 1 \tabularnewline
19.7 & 1 & 0 \tabularnewline
20 & 1 & 0 \tabularnewline
21.2 & 1 & 0 \tabularnewline
21.5 & 1 & 1 \tabularnewline
22.4 & 1 & 0 \tabularnewline
22.5 & 0 & 1 \tabularnewline
23 & 1 & 0 \tabularnewline
23.3 & 1 & 1 \tabularnewline
23.6 & 1 & 1 \tabularnewline
24.5 & 1 & 0 \tabularnewline
24.8 & 1 & 0 \tabularnewline
25.2 & 1 & 0 \tabularnewline
25.5 & 1 & 1 \tabularnewline
25.8 & 1 & 0 \tabularnewline
26.4 & 3 & 1 \tabularnewline
26.7 & 0 & 1 \tabularnewline
27.3 & 2 & 0 \tabularnewline
29.4 & 1 & 0 \tabularnewline
29.5 & 0 & 1 \tabularnewline
30.9 & 1 & 0 \tabularnewline
32.5 & 0 & 1 \tabularnewline
33.9 & 0 & 1 \tabularnewline
4.2 & 0 & 1 \tabularnewline
5.2 & 0 & 1 \tabularnewline
5.8 & 0 & 1 \tabularnewline
6.4 & 0 & 1 \tabularnewline
7 & 0 & 1 \tabularnewline
7.3 & 0 & 1 \tabularnewline
8.2 & 1 & 0 \tabularnewline
9.4 & 1 & 0 \tabularnewline
9.7 & 2 & 0 \tabularnewline
\hline
\end{tabular}
%Source: https://freestatistics.org/blog/index.php?pk=273557&T=1

[TABLE]
[ROW][C]Tabulation of Results[/C][/ROW]
[ROW][C]Haargroei  x  Middel[/C][/ROW]
[ROW][C] [/C][C]'OJ'[/C][C]'VC'[/C][/ROW]
[C]10[/C][C]1[/C][C]1[/C][/ROW]
[C]11.2[/C][C]0[/C][C]2[/C][/ROW]
[C]11.5[/C][C]0[/C][C]1[/C][/ROW]
[C]13.6[/C][C]0[/C][C]1[/C][/ROW]
[C]14.5[/C][C]2[/C][C]1[/C][/ROW]
[C]15.2[/C][C]1[/C][C]1[/C][/ROW]
[C]15.5[/C][C]0[/C][C]1[/C][/ROW]
[C]16.5[/C][C]1[/C][C]2[/C][/ROW]
[C]17.3[/C][C]0[/C][C]2[/C][/ROW]
[C]17.6[/C][C]1[/C][C]0[/C][/ROW]
[C]18.5[/C][C]0[/C][C]1[/C][/ROW]
[C]18.8[/C][C]0[/C][C]1[/C][/ROW]
[C]19.7[/C][C]1[/C][C]0[/C][/ROW]
[C]20[/C][C]1[/C][C]0[/C][/ROW]
[C]21.2[/C][C]1[/C][C]0[/C][/ROW]
[C]21.5[/C][C]1[/C][C]1[/C][/ROW]
[C]22.4[/C][C]1[/C][C]0[/C][/ROW]
[C]22.5[/C][C]0[/C][C]1[/C][/ROW]
[C]23[/C][C]1[/C][C]0[/C][/ROW]
[C]23.3[/C][C]1[/C][C]1[/C][/ROW]
[C]23.6[/C][C]1[/C][C]1[/C][/ROW]
[C]24.5[/C][C]1[/C][C]0[/C][/ROW]
[C]24.8[/C][C]1[/C][C]0[/C][/ROW]
[C]25.2[/C][C]1[/C][C]0[/C][/ROW]
[C]25.5[/C][C]1[/C][C]1[/C][/ROW]
[C]25.8[/C][C]1[/C][C]0[/C][/ROW]
[C]26.4[/C][C]3[/C][C]1[/C][/ROW]
[C]26.7[/C][C]0[/C][C]1[/C][/ROW]
[C]27.3[/C][C]2[/C][C]0[/C][/ROW]
[C]29.4[/C][C]1[/C][C]0[/C][/ROW]
[C]29.5[/C][C]0[/C][C]1[/C][/ROW]
[C]30.9[/C][C]1[/C][C]0[/C][/ROW]
[C]32.5[/C][C]0[/C][C]1[/C][/ROW]
[C]33.9[/C][C]0[/C][C]1[/C][/ROW]
[C]4.2[/C][C]0[/C][C]1[/C][/ROW]
[C]5.2[/C][C]0[/C][C]1[/C][/ROW]
[C]5.8[/C][C]0[/C][C]1[/C][/ROW]
[C]6.4[/C][C]0[/C][C]1[/C][/ROW]
[C]7[/C][C]0[/C][C]1[/C][/ROW]
[C]7.3[/C][C]0[/C][C]1[/C][/ROW]
[C]8.2[/C][C]1[/C][C]0[/C][/ROW]
[C]9.4[/C][C]1[/C][C]0[/C][/ROW]
[C]9.7[/C][C]2[/C][C]0[/C][/ROW]
[/TABLE]
Source: https://freestatistics.org/blog/index.php?pk=273557&T=1

Globally Unique Identifier (entire table): ba.freestatistics.org/blog/index.php?pk=273557&T=1

As an alternative you can also use a QR Code:  

The GUIDs for individual cells are displayed in the table below:

Tabulation of Results
Haargroei x Middel
'OJ''VC'
1011
11.202
11.501
13.601
14.521
15.211
15.501
16.512
17.302
17.610
18.501
18.801
19.710
2010
21.210
21.511
22.410
22.501
2310
23.311
23.611
24.510
24.810
25.210
25.511
25.810
26.431
26.701
27.320
29.410
29.501
30.910
32.501
33.901
4.201
5.201
5.801
6.401
701
7.301
8.210
9.410
9.720


Tabulation of Expected Results
Haargroei x Middel
'OJ''VC'
1011
11.211
11.50.50.5
13.60.50.5
14.51.51.5
15.211
15.50.50.5
16.51.51.5
17.311
17.60.50.5
18.50.50.5
18.80.50.5
19.70.50.5
200.50.5
21.20.50.5
21.511
22.40.50.5
22.50.50.5
230.50.5
23.311
23.611
24.50.50.5
24.80.50.5
25.20.50.5
25.511
25.80.50.5
26.422
26.70.50.5
27.311
29.40.50.5
29.50.50.5
30.90.50.5
32.50.50.5
33.90.50.5
4.20.50.5
5.20.50.5
5.80.50.5
6.40.50.5
70.50.5
7.30.50.5
8.20.50.5
9.40.50.5
9.711

\begin{tabular}{lllllllll}
\hline
Tabulation of Expected Results \tabularnewline
Haargroei  x  Middel \tabularnewline
  & 'OJ' & 'VC' \tabularnewline
10 & 1 & 1 \tabularnewline
11.2 & 1 & 1 \tabularnewline
11.5 & 0.5 & 0.5 \tabularnewline
13.6 & 0.5 & 0.5 \tabularnewline
14.5 & 1.5 & 1.5 \tabularnewline
15.2 & 1 & 1 \tabularnewline
15.5 & 0.5 & 0.5 \tabularnewline
16.5 & 1.5 & 1.5 \tabularnewline
17.3 & 1 & 1 \tabularnewline
17.6 & 0.5 & 0.5 \tabularnewline
18.5 & 0.5 & 0.5 \tabularnewline
18.8 & 0.5 & 0.5 \tabularnewline
19.7 & 0.5 & 0.5 \tabularnewline
20 & 0.5 & 0.5 \tabularnewline
21.2 & 0.5 & 0.5 \tabularnewline
21.5 & 1 & 1 \tabularnewline
22.4 & 0.5 & 0.5 \tabularnewline
22.5 & 0.5 & 0.5 \tabularnewline
23 & 0.5 & 0.5 \tabularnewline
23.3 & 1 & 1 \tabularnewline
23.6 & 1 & 1 \tabularnewline
24.5 & 0.5 & 0.5 \tabularnewline
24.8 & 0.5 & 0.5 \tabularnewline
25.2 & 0.5 & 0.5 \tabularnewline
25.5 & 1 & 1 \tabularnewline
25.8 & 0.5 & 0.5 \tabularnewline
26.4 & 2 & 2 \tabularnewline
26.7 & 0.5 & 0.5 \tabularnewline
27.3 & 1 & 1 \tabularnewline
29.4 & 0.5 & 0.5 \tabularnewline
29.5 & 0.5 & 0.5 \tabularnewline
30.9 & 0.5 & 0.5 \tabularnewline
32.5 & 0.5 & 0.5 \tabularnewline
33.9 & 0.5 & 0.5 \tabularnewline
4.2 & 0.5 & 0.5 \tabularnewline
5.2 & 0.5 & 0.5 \tabularnewline
5.8 & 0.5 & 0.5 \tabularnewline
6.4 & 0.5 & 0.5 \tabularnewline
7 & 0.5 & 0.5 \tabularnewline
7.3 & 0.5 & 0.5 \tabularnewline
8.2 & 0.5 & 0.5 \tabularnewline
9.4 & 0.5 & 0.5 \tabularnewline
9.7 & 1 & 1 \tabularnewline
\hline
\end{tabular}
%Source: https://freestatistics.org/blog/index.php?pk=273557&T=2

[TABLE]
[ROW][C]Tabulation of Expected Results[/C][/ROW]
[ROW][C]Haargroei  x  Middel[/C][/ROW]
[ROW][C] [/C][C]'OJ'[/C][C]'VC'[/C][/ROW]
[C]10[/C][C]1[/C][C]1[/C][/ROW]
[C]11.2[/C][C]1[/C][C]1[/C][/ROW]
[C]11.5[/C][C]0.5[/C][C]0.5[/C][/ROW]
[C]13.6[/C][C]0.5[/C][C]0.5[/C][/ROW]
[C]14.5[/C][C]1.5[/C][C]1.5[/C][/ROW]
[C]15.2[/C][C]1[/C][C]1[/C][/ROW]
[C]15.5[/C][C]0.5[/C][C]0.5[/C][/ROW]
[C]16.5[/C][C]1.5[/C][C]1.5[/C][/ROW]
[C]17.3[/C][C]1[/C][C]1[/C][/ROW]
[C]17.6[/C][C]0.5[/C][C]0.5[/C][/ROW]
[C]18.5[/C][C]0.5[/C][C]0.5[/C][/ROW]
[C]18.8[/C][C]0.5[/C][C]0.5[/C][/ROW]
[C]19.7[/C][C]0.5[/C][C]0.5[/C][/ROW]
[C]20[/C][C]0.5[/C][C]0.5[/C][/ROW]
[C]21.2[/C][C]0.5[/C][C]0.5[/C][/ROW]
[C]21.5[/C][C]1[/C][C]1[/C][/ROW]
[C]22.4[/C][C]0.5[/C][C]0.5[/C][/ROW]
[C]22.5[/C][C]0.5[/C][C]0.5[/C][/ROW]
[C]23[/C][C]0.5[/C][C]0.5[/C][/ROW]
[C]23.3[/C][C]1[/C][C]1[/C][/ROW]
[C]23.6[/C][C]1[/C][C]1[/C][/ROW]
[C]24.5[/C][C]0.5[/C][C]0.5[/C][/ROW]
[C]24.8[/C][C]0.5[/C][C]0.5[/C][/ROW]
[C]25.2[/C][C]0.5[/C][C]0.5[/C][/ROW]
[C]25.5[/C][C]1[/C][C]1[/C][/ROW]
[C]25.8[/C][C]0.5[/C][C]0.5[/C][/ROW]
[C]26.4[/C][C]2[/C][C]2[/C][/ROW]
[C]26.7[/C][C]0.5[/C][C]0.5[/C][/ROW]
[C]27.3[/C][C]1[/C][C]1[/C][/ROW]
[C]29.4[/C][C]0.5[/C][C]0.5[/C][/ROW]
[C]29.5[/C][C]0.5[/C][C]0.5[/C][/ROW]
[C]30.9[/C][C]0.5[/C][C]0.5[/C][/ROW]
[C]32.5[/C][C]0.5[/C][C]0.5[/C][/ROW]
[C]33.9[/C][C]0.5[/C][C]0.5[/C][/ROW]
[C]4.2[/C][C]0.5[/C][C]0.5[/C][/ROW]
[C]5.2[/C][C]0.5[/C][C]0.5[/C][/ROW]
[C]5.8[/C][C]0.5[/C][C]0.5[/C][/ROW]
[C]6.4[/C][C]0.5[/C][C]0.5[/C][/ROW]
[C]7[/C][C]0.5[/C][C]0.5[/C][/ROW]
[C]7.3[/C][C]0.5[/C][C]0.5[/C][/ROW]
[C]8.2[/C][C]0.5[/C][C]0.5[/C][/ROW]
[C]9.4[/C][C]0.5[/C][C]0.5[/C][/ROW]
[C]9.7[/C][C]1[/C][C]1[/C][/ROW]
[/TABLE]
Source: https://freestatistics.org/blog/index.php?pk=273557&T=2

Globally Unique Identifier (entire table): ba.freestatistics.org/blog/index.php?pk=273557&T=2

As an alternative you can also use a QR Code:  

The GUIDs for individual cells are displayed in the table below:

Tabulation of Expected Results
Haargroei x Middel
'OJ''VC'
1011
11.211
11.50.50.5
13.60.50.5
14.51.51.5
15.211
15.50.50.5
16.51.51.5
17.311
17.60.50.5
18.50.50.5
18.80.50.5
19.70.50.5
200.50.5
21.20.50.5
21.511
22.40.50.5
22.50.50.5
230.50.5
23.311
23.611
24.50.50.5
24.80.50.5
25.20.50.5
25.511
25.80.50.5
26.422
26.70.50.5
27.311
29.40.50.5
29.50.50.5
30.90.50.5
32.50.50.5
33.90.50.5
4.20.50.5
5.20.50.5
5.80.50.5
6.40.50.5
70.50.5
7.30.50.5
8.20.50.5
9.40.50.5
9.711


Statistical Results
Pearson's Chi-squared test
Pearson Chi Square Statistic39.67
Degrees of Freedom42
P value0.57

\begin{tabular}{lllllllll}
\hline
Statistical Results \tabularnewline
Pearson's Chi-squared test \tabularnewline
Pearson Chi Square Statistic & 39.67 \tabularnewline
Degrees of Freedom & 42 \tabularnewline
P value & 0.57 \tabularnewline
\hline
\end{tabular}
%Source: https://freestatistics.org/blog/index.php?pk=273557&T=3

[TABLE]
[ROW][C]Statistical Results[/C][/ROW]
[ROW][C]Pearson's Chi-squared test[/C][/ROW]
[ROW][C]Pearson Chi Square Statistic[/C][C]39.67[/C][/ROW]
[ROW][C]Degrees of Freedom[/C][C]42[/C][/ROW]
[ROW][C]P value[/C][C]0.57[/C][/ROW]
[/TABLE]
Source: https://freestatistics.org/blog/index.php?pk=273557&T=3

Globally Unique Identifier (entire table): ba.freestatistics.org/blog/index.php?pk=273557&T=3

As an alternative you can also use a QR Code:  

The GUIDs for individual cells are displayed in the table below:

Statistical Results
Pearson's Chi-squared test
Pearson Chi Square Statistic39.67
Degrees of Freedom42
P value0.57


Parameters (Session):
par1 = 1 ; par2 = 2 ; par3 = Pearson Chi-Squared ;
Parameters (R input):
par1 = 1 ; par2 = 2 ; par3 = Pearson Chi-Squared ;
R code (references can be found in the software module):
library(vcd)
cat1 <- as.numeric(par1) #
cat2<- as.numeric(par2) #
simulate.p.value=FALSE
if (par3 == 'Exact Pearson Chi-Squared by Simulation') simulate.p.value=TRUE
x <- t(x)
(z <- array(unlist(x),dim=c(length(x[,1]),length(x[1,]))))
(table1 <- table(z[,cat1],z[,cat2]))
(V1<-dimnames(y)[[1]][cat1])
(V2<-dimnames(y)[[1]][cat2])
bitmap(file='pic1.png')
assoc(ftable(z[,cat1],z[,cat2],row.vars=1,dnn=c(V1,V2)),shade=T)
dev.off()
load(file='createtable')
a<-table.start()
a<-table.row.start(a)
a<-table.element(a,'Tabulation of Results',ncol(table1)+1,TRUE)
a<-table.row.end(a)
a<-table.row.start(a)
a<-table.element(a,paste(V1,' x ', V2),ncol(table1)+1,TRUE)
a<-table.row.end(a)
a<-table.row.start(a)
a<-table.element(a, ' ', 1,TRUE)
for(nc in 1:ncol(table1)){
a<-table.element(a, colnames(table1)[nc], 1, TRUE)
}
a<-table.row.end(a)
for(nr in 1:nrow(table1) ){
a<-table.element(a, rownames(table1)[nr], 1, TRUE)
for(nc in 1:ncol(table1) ){
a<-table.element(a, table1[nr, nc], 1, FALSE)
}
a<-table.row.end(a)
}
a<-table.end(a)
table.save(a,file='mytable.tab')
(cst<-chisq.test(table1, simulate.p.value=simulate.p.value) )
if (par3 == 'McNemar Chi-Squared') {
(cst <- mcnemar.test(table1))
}
if (par3=='Fisher Exact Test') {
(cst <- fisher.test(table1))
}
if ((par3 != 'McNemar Chi-Squared') & (par3 != 'Fisher Exact Test')) {
a<-table.start()
a<-table.row.start(a)
a<-table.element(a,'Tabulation of Expected Results',ncol(table1)+1,TRUE)
a<-table.row.end(a)
a<-table.row.start(a)
a<-table.element(a,paste(V1,' x ', V2),ncol(table1)+1,TRUE)
a<-table.row.end(a)
a<-table.row.start(a)
a<-table.element(a, ' ', 1,TRUE)
for(nc in 1:ncol(table1)){
a<-table.element(a, colnames(table1)[nc], 1, TRUE)
}
a<-table.row.end(a)
for(nr in 1:nrow(table1) ){
a<-table.element(a, rownames(table1)[nr], 1, TRUE)
for(nc in 1:ncol(table1) ){
a<-table.element(a, round(cst$expected[nr, nc], digits=2), 1, FALSE)
}
a<-table.row.end(a)
}
a<-table.end(a)
table.save(a,file='mytable1.tab')
}
a<-table.start()
a<-table.row.start(a)
a<-table.element(a,'Statistical Results',2,TRUE)
a<-table.row.end(a)
a<-table.row.start(a)
a<-table.element(a, cst$method, 2,TRUE)
a<-table.row.end(a)
a<-table.row.start(a)
if (par3=='Pearson Chi-Squared') a<-table.element(a, 'Pearson Chi Square Statistic', 1, TRUE)
if (par3=='Exact Pearson Chi-Squared by Simulation') a<-table.element(a, 'Exact Pearson Chi Square Statistic', 1, TRUE)
if (par3=='McNemar Chi-Squared') a<-table.element(a, 'McNemar Chi Square Statistic', 1, TRUE)
if (par3=='Fisher Exact Test') a<-table.element(a, 'Odds Ratio', 1, TRUE)
if (par3=='Fisher Exact Test') {
if ((ncol(table1) == 2) & (nrow(table1) == 2)) {
a<-table.element(a, round(cst$estimate, digits=2), 1,FALSE)
} else {
a<-table.element(a, '--', 1,FALSE)
}
} else {
a<-table.element(a, round(cst$statistic, digits=2), 1,FALSE)
}
a<-table.row.end(a)
if(!simulate.p.value){
if(par3!='Fisher Exact Test') {
a<-table.row.start(a)
a<-table.element(a, 'Degrees of Freedom', 1, TRUE)
a<-table.element(a, cst$parameter, 1,FALSE)
a<-table.row.end(a)
}
}
a<-table.row.start(a)
a<-table.element(a, 'P value', 1, TRUE)
a<-table.element(a, round(cst$p.value, digits=2), 1,FALSE)
a<-table.row.end(a)
a<-table.end(a)
table.save(a,file='mytable2.tab')