Free Statistics

of Irreproducible Research!

Author's title

Author*Unverified author*
R Software Modulerwasp_smp.wasp
Title produced by softwareStandard Deviation-Mean Plot
Date of computationMon, 12 Jan 2015 18:31:25 +0000
Cite this page as followsStatistical Computations at FreeStatistics.org, Office for Research Development and Education, URL https://freestatistics.org/blog/index.php?v=date/2015/Jan/12/t1421087531b35ocwcbohklw59.htm/, Retrieved Tue, 14 May 2024 00:25:09 +0000
Statistical Computations at FreeStatistics.org, Office for Research Development and Education, URL https://freestatistics.org/blog/index.php?pk=272014, Retrieved Tue, 14 May 2024 00:25:09 +0000
QR Codes:

Original text written by user:
IsPrivate?No (this computation is public)
User-defined keywords
Estimated Impact170
Family? (F = Feedback message, R = changed R code, M = changed R Module, P = changed Parameters, D = changed Data)
-       [Standard Deviation-Mean Plot] [] [2015-01-12 18:31:25] [d41d8cd98f00b204e9800998ecf8427e] [Current]
Feedback Forum

Post a new message
Dataseries X:
118
176
178
126
130
204
206
130
120
208
242
180
175
220
238
178


Summary of computational transaction
Raw Inputview raw input (R code)
Raw Outputview raw output of R engine
Computing time1 seconds
R Server'Herman Ole Andreas Wold' @ wold.wessa.net

\begin{tabular}{lllllllll}
\hline
Summary of computational transaction \tabularnewline
Raw Input & view raw input (R code)  \tabularnewline
Raw Output & view raw output of R engine  \tabularnewline
Computing time & 1 seconds \tabularnewline
R Server & 'Herman Ole Andreas Wold' @ wold.wessa.net \tabularnewline
\hline
\end{tabular}
%Source: https://freestatistics.org/blog/index.php?pk=272014&T=0

[TABLE]
[ROW][C]Summary of computational transaction[/C][/ROW]
[ROW][C]Raw Input[/C][C]view raw input (R code) [/C][/ROW]
[ROW][C]Raw Output[/C][C]view raw output of R engine [/C][/ROW]
[ROW][C]Computing time[/C][C]1 seconds[/C][/ROW]
[ROW][C]R Server[/C][C]'Herman Ole Andreas Wold' @ wold.wessa.net[/C][/ROW]
[/TABLE]
Source: https://freestatistics.org/blog/index.php?pk=272014&T=0

Globally Unique Identifier (entire table): ba.freestatistics.org/blog/index.php?pk=272014&T=0

As an alternative you can also use a QR Code:  

The GUIDs for individual cells are displayed in the table below:

Summary of computational transaction
Raw Inputview raw input (R code)
Raw Outputview raw output of R engine
Computing time1 seconds
R Server'Herman Ole Andreas Wold' @ wold.wessa.net


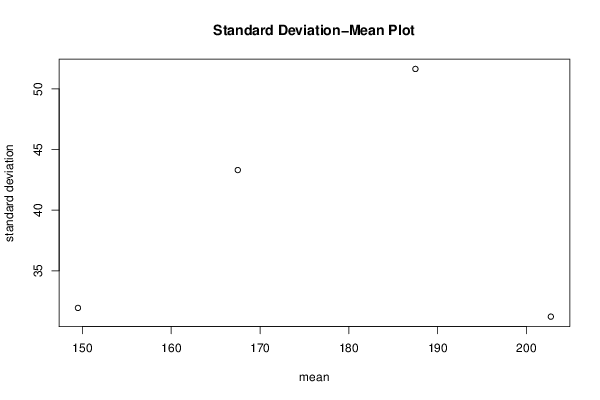
Standard Deviation-Mean Plot
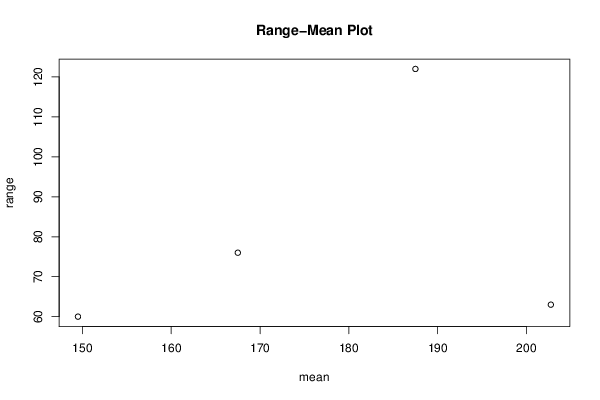
SectionMeanStandard DeviationRange
1149.531.932219883162960
2167.543.308967508665876
3187.551.6494595002374122
4202.7531.212978070027263

\begin{tabular}{lllllllll}
\hline
Standard Deviation-Mean Plot \tabularnewline
Section & Mean & Standard Deviation & Range \tabularnewline
1 & 149.5 & 31.9322198831629 & 60 \tabularnewline
2 & 167.5 & 43.3089675086658 & 76 \tabularnewline
3 & 187.5 & 51.6494595002374 & 122 \tabularnewline
4 & 202.75 & 31.2129780700272 & 63 \tabularnewline
\hline
\end{tabular}
%Source: https://freestatistics.org/blog/index.php?pk=272014&T=1

[TABLE]
[ROW][C]Standard Deviation-Mean Plot[/C][/ROW]
[ROW][C]Section[/C][C]Mean[/C][C]Standard Deviation[/C][C]Range[/C][/ROW]
[ROW][C]1[/C][C]149.5[/C][C]31.9322198831629[/C][C]60[/C][/ROW]
[ROW][C]2[/C][C]167.5[/C][C]43.3089675086658[/C][C]76[/C][/ROW]
[ROW][C]3[/C][C]187.5[/C][C]51.6494595002374[/C][C]122[/C][/ROW]
[ROW][C]4[/C][C]202.75[/C][C]31.2129780700272[/C][C]63[/C][/ROW]
[/TABLE]
Source: https://freestatistics.org/blog/index.php?pk=272014&T=1

Globally Unique Identifier (entire table): ba.freestatistics.org/blog/index.php?pk=272014&T=1

As an alternative you can also use a QR Code:  

The GUIDs for individual cells are displayed in the table below:

Standard Deviation-Mean Plot
SectionMeanStandard DeviationRange
1149.531.932219883162960
2167.543.308967508665876
3187.551.6494595002374122
4202.7531.212978070027263


Regression: S.E.(k) = alpha + beta * Mean(k)
alpha30.1238306320814
beta0.0531754011081908
S.D.0.295824100659396
T-STAT0.179753444664117
p-value0.873909575863161

\begin{tabular}{lllllllll}
\hline
Regression: S.E.(k) = alpha + beta * Mean(k) \tabularnewline
alpha & 30.1238306320814 \tabularnewline
beta & 0.0531754011081908 \tabularnewline
S.D. & 0.295824100659396 \tabularnewline
T-STAT & 0.179753444664117 \tabularnewline
p-value & 0.873909575863161 \tabularnewline
\hline
\end{tabular}
%Source: https://freestatistics.org/blog/index.php?pk=272014&T=2

[TABLE]
[ROW][C]Regression: S.E.(k) = alpha + beta * Mean(k)[/C][/ROW]
[ROW][C]alpha[/C][C]30.1238306320814[/C][/ROW]
[ROW][C]beta[/C][C]0.0531754011081908[/C][/ROW]
[ROW][C]S.D.[/C][C]0.295824100659396[/C][/ROW]
[ROW][C]T-STAT[/C][C]0.179753444664117[/C][/ROW]
[ROW][C]p-value[/C][C]0.873909575863161[/C][/ROW]
[/TABLE]
Source: https://freestatistics.org/blog/index.php?pk=272014&T=2

Globally Unique Identifier (entire table): ba.freestatistics.org/blog/index.php?pk=272014&T=2

As an alternative you can also use a QR Code:  

The GUIDs for individual cells are displayed in the table below:

Regression: S.E.(k) = alpha + beta * Mean(k)
alpha30.1238306320814
beta0.0531754011081908
S.D.0.295824100659396
T-STAT0.179753444664117
p-value0.873909575863161


Regression: ln S.E.(k) = alpha + beta * ln Mean(k)
alpha2.32690370546925
beta0.256828181926556
S.D.1.28614181275882
T-STAT0.199688851865916
p-value0.860185577117848
Lambda0.743171818073444

\begin{tabular}{lllllllll}
\hline
Regression: ln S.E.(k) = alpha + beta * ln Mean(k) \tabularnewline
alpha & 2.32690370546925 \tabularnewline
beta & 0.256828181926556 \tabularnewline
S.D. & 1.28614181275882 \tabularnewline
T-STAT & 0.199688851865916 \tabularnewline
p-value & 0.860185577117848 \tabularnewline
Lambda & 0.743171818073444 \tabularnewline
\hline
\end{tabular}
%Source: https://freestatistics.org/blog/index.php?pk=272014&T=3

[TABLE]
[ROW][C]Regression: ln S.E.(k) = alpha + beta * ln Mean(k)[/C][/ROW]
[ROW][C]alpha[/C][C]2.32690370546925[/C][/ROW]
[ROW][C]beta[/C][C]0.256828181926556[/C][/ROW]
[ROW][C]S.D.[/C][C]1.28614181275882[/C][/ROW]
[ROW][C]T-STAT[/C][C]0.199688851865916[/C][/ROW]
[ROW][C]p-value[/C][C]0.860185577117848[/C][/ROW]
[ROW][C]Lambda[/C][C]0.743171818073444[/C][/ROW]
[/TABLE]
Source: https://freestatistics.org/blog/index.php?pk=272014&T=3

Globally Unique Identifier (entire table): ba.freestatistics.org/blog/index.php?pk=272014&T=3

As an alternative you can also use a QR Code:  

The GUIDs for individual cells are displayed in the table below:

Regression: ln S.E.(k) = alpha + beta * ln Mean(k)
alpha2.32690370546925
beta0.256828181926556
S.D.1.28614181275882
T-STAT0.199688851865916
p-value0.860185577117848
Lambda0.743171818073444


Parameters (Session):
par1 = 4 ;
Parameters (R input):
par1 = 4 ;
R code (references can be found in the software module):
par1 <- as.numeric(par1)
(n <- length(x))
(np <- floor(n / par1))
arr <- array(NA,dim=c(par1,np))
j <- 0
k <- 1
for (i in 1:(np*par1))
{
j = j + 1
arr[j,k] <- x[i]
if (j == par1) {
j = 0
k=k+1
}
}
arr
arr.mean <- array(NA,dim=np)
arr.sd <- array(NA,dim=np)
arr.range <- array(NA,dim=np)
for (j in 1:np)
{
arr.mean[j] <- mean(arr[,j],na.rm=TRUE)
arr.sd[j] <- sd(arr[,j],na.rm=TRUE)
arr.range[j] <- max(arr[,j],na.rm=TRUE) - min(arr[,j],na.rm=TRUE)
}
arr.mean
arr.sd
arr.range
(lm1 <- lm(arr.sd~arr.mean))
(lnlm1 <- lm(log(arr.sd)~log(arr.mean)))
(lm2 <- lm(arr.range~arr.mean))
bitmap(file='test1.png')
plot(arr.mean,arr.sd,main='Standard Deviation-Mean Plot',xlab='mean',ylab='standard deviation')
dev.off()
bitmap(file='test2.png')
plot(arr.mean,arr.range,main='Range-Mean Plot',xlab='mean',ylab='range')
dev.off()
load(file='createtable')
a<-table.start()
a<-table.row.start(a)
a<-table.element(a,'Standard Deviation-Mean Plot',4,TRUE)
a<-table.row.end(a)
a<-table.row.start(a)
a<-table.element(a,'Section',header=TRUE)
a<-table.element(a,'Mean',header=TRUE)
a<-table.element(a,'Standard Deviation',header=TRUE)
a<-table.element(a,'Range',header=TRUE)
a<-table.row.end(a)
for (j in 1:np) {
a<-table.row.start(a)
a<-table.element(a,j,header=TRUE)
a<-table.element(a,arr.mean[j])
a<-table.element(a,arr.sd[j] )
a<-table.element(a,arr.range[j] )
a<-table.row.end(a)
}
a<-table.end(a)
table.save(a,file='mytable.tab')
a<-table.start()
a<-table.row.start(a)
a<-table.element(a,'Regression: S.E.(k) = alpha + beta * Mean(k)',2,TRUE)
a<-table.row.end(a)
a<-table.row.start(a)
a<-table.element(a,'alpha',header=TRUE)
a<-table.element(a,lm1$coefficients[[1]])
a<-table.row.end(a)
a<-table.row.start(a)
a<-table.element(a,'beta',header=TRUE)
a<-table.element(a,lm1$coefficients[[2]])
a<-table.row.end(a)
a<-table.row.start(a)
a<-table.element(a,'S.D.',header=TRUE)
a<-table.element(a,summary(lm1)$coefficients[2,2])
a<-table.row.end(a)
a<-table.row.start(a)
a<-table.element(a,'T-STAT',header=TRUE)
a<-table.element(a,summary(lm1)$coefficients[2,3])
a<-table.row.end(a)
a<-table.row.start(a)
a<-table.element(a,'p-value',header=TRUE)
a<-table.element(a,summary(lm1)$coefficients[2,4])
a<-table.row.end(a)
a<-table.end(a)
table.save(a,file='mytable1.tab')
a<-table.start()
a<-table.row.start(a)
a<-table.element(a,'Regression: ln S.E.(k) = alpha + beta * ln Mean(k)',2,TRUE)
a<-table.row.end(a)
a<-table.row.start(a)
a<-table.element(a,'alpha',header=TRUE)
a<-table.element(a,lnlm1$coefficients[[1]])
a<-table.row.end(a)
a<-table.row.start(a)
a<-table.element(a,'beta',header=TRUE)
a<-table.element(a,lnlm1$coefficients[[2]])
a<-table.row.end(a)
a<-table.row.start(a)
a<-table.element(a,'S.D.',header=TRUE)
a<-table.element(a,summary(lnlm1)$coefficients[2,2])
a<-table.row.end(a)
a<-table.row.start(a)
a<-table.element(a,'T-STAT',header=TRUE)
a<-table.element(a,summary(lnlm1)$coefficients[2,3])
a<-table.row.end(a)
a<-table.row.start(a)
a<-table.element(a,'p-value',header=TRUE)
a<-table.element(a,summary(lnlm1)$coefficients[2,4])
a<-table.row.end(a)
a<-table.row.start(a)
a<-table.element(a,'Lambda',header=TRUE)
a<-table.element(a,1-lnlm1$coefficients[[2]])
a<-table.row.end(a)
a<-table.end(a)
table.save(a,file='mytable2.tab')