Free Statistics

of Irreproducible Research!

Author's title

Author*Unverified author*
R Software Modulerwasp_exponentialsmoothing.wasp
Title produced by softwareExponential Smoothing
Date of computationMon, 05 Jan 2015 13:52:13 +0000
Cite this page as followsStatistical Computations at FreeStatistics.org, Office for Research Development and Education, URL https://freestatistics.org/blog/index.php?v=date/2015/Jan/05/t142046595698phauype3rpf90.htm/, Retrieved Tue, 14 May 2024 10:58:37 +0000
Statistical Computations at FreeStatistics.org, Office for Research Development and Education, URL https://freestatistics.org/blog/index.php?pk=271965, Retrieved Tue, 14 May 2024 10:58:37 +0000
QR Codes:

Original text written by user:
IsPrivate?No (this computation is public)
User-defined keywords
Estimated Impact130
Family? (F = Feedback message, R = changed R code, M = changed R Module, P = changed Parameters, D = changed Data)
-     [Exponential Smoothing] [opgave 11 oefening 2] [2014-11-26 16:29:09] [2bc3df78c8df63f162d0154acf354144]
- R PD    [Exponential Smoothing] [Opdracht 11 oefen...] [2015-01-05 13:52:13] [1ff8fa16e8926711af5c3a9d39132058] [Current]
Feedback Forum

Post a new message
Dataseries X:
110.48
111.41
115.5
118.32
118.42
117.5
110.23
109.19
118.41
118.3
116.1
114.11
113.41
114.33
116.61
123.64
123.77
123.39
116.03
114.95
123.4
123.53
114.45
114.26
114.35
112.77
115.31
114.93
116.38
115.07
105
103.43
114.52
115.04
117.16
115
116.22
112.92
116.56
114.32
113.22
111.56
103.87
102.85
112.27
112.76
118.55
122.73
115.44
116.97
119.84
116.37
117.23
115.58
109.82
108.46
116.54
117.49
122.87
127.1
119.81
120.03
128.58
120.4
121.54
118.71
111.57
109.97
120.29
120.61
130.15
136.12


Summary of computational transaction
Raw Inputview raw input (R code)
Raw Outputview raw output of R engine
Computing time2 seconds
R Server'Gwilym Jenkins' @ jenkins.wessa.net

\begin{tabular}{lllllllll}
\hline
Summary of computational transaction \tabularnewline
Raw Input & view raw input (R code)  \tabularnewline
Raw Output & view raw output of R engine  \tabularnewline
Computing time & 2 seconds \tabularnewline
R Server & 'Gwilym Jenkins' @ jenkins.wessa.net \tabularnewline
\hline
\end{tabular}
%Source: https://freestatistics.org/blog/index.php?pk=271965&T=0

[TABLE]
[ROW][C]Summary of computational transaction[/C][/ROW]
[ROW][C]Raw Input[/C][C]view raw input (R code) [/C][/ROW]
[ROW][C]Raw Output[/C][C]view raw output of R engine [/C][/ROW]
[ROW][C]Computing time[/C][C]2 seconds[/C][/ROW]
[ROW][C]R Server[/C][C]'Gwilym Jenkins' @ jenkins.wessa.net[/C][/ROW]
[/TABLE]
Source: https://freestatistics.org/blog/index.php?pk=271965&T=0

Globally Unique Identifier (entire table): ba.freestatistics.org/blog/index.php?pk=271965&T=0

As an alternative you can also use a QR Code:  

The GUIDs for individual cells are displayed in the table below:

Summary of computational transaction
Raw Inputview raw input (R code)
Raw Outputview raw output of R engine
Computing time2 seconds
R Server'Gwilym Jenkins' @ jenkins.wessa.net


Estimated Parameters of Exponential Smoothing
ParameterValue
alpha0.358216080441246
beta0
gamma1

\begin{tabular}{lllllllll}
\hline
Estimated Parameters of Exponential Smoothing \tabularnewline
Parameter & Value \tabularnewline
alpha & 0.358216080441246 \tabularnewline
beta & 0 \tabularnewline
gamma & 1 \tabularnewline
\hline
\end{tabular}
%Source: https://freestatistics.org/blog/index.php?pk=271965&T=1

[TABLE]
[ROW][C]Estimated Parameters of Exponential Smoothing[/C][/ROW]
[ROW][C]Parameter[/C][C]Value[/C][/ROW]
[ROW][C]alpha[/C][C]0.358216080441246[/C][/ROW]
[ROW][C]beta[/C][C]0[/C][/ROW]
[ROW][C]gamma[/C][C]1[/C][/ROW]
[/TABLE]
Source: https://freestatistics.org/blog/index.php?pk=271965&T=1

Globally Unique Identifier (entire table): ba.freestatistics.org/blog/index.php?pk=271965&T=1

As an alternative you can also use a QR Code:  

The GUIDs for individual cells are displayed in the table below:

Estimated Parameters of Exponential Smoothing
ParameterValue
alpha0.358216080441246
beta0
gamma1


Interpolation Forecasts of Exponential Smoothing
tObservedFittedResiduals
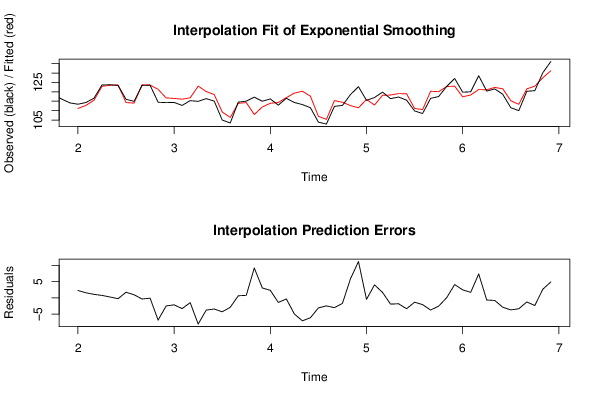
13113.41111.1532051282052.25679487179482
14114.33112.7720274394421.5579725605585
15116.61115.5342703614221.07572963857814
16123.64122.8958494474030.744150552596778
17123.77123.5153182395150.254681760485298
18123.39123.661118106084-0.271118106084373
19116.03114.2977346720221.73226532797842
20114.95114.0065787326630.943421267336944
21123.4123.768679499155-0.368679499155476
22123.53123.630764671931-0.100764671931046
23114.45121.32215457734-6.87215457734035
24114.26116.774173731695-2.51417373169454
25114.35116.506916361675-2.15691636167458
26112.77116.096183412678-3.32618341267764
27115.31116.799347373014-1.48934737301364
28114.93123.029272500428-8.09927250042782
29116.38120.166751748898-3.78675174889808
30115.07118.527395245102-3.45739524510198
31105109.308375375793-4.30837537579262
32103.43106.347097367016-2.91709736701625
33114.52113.8842131070650.635786892935243
34115.04114.2780577216740.761942278325975
35117.16107.932713975029.22728602498032
36115111.9486936677143.05130633228562
37116.22113.904362787212.31563721279007
38112.92114.345353658218-1.42535365821755
39116.56116.908277235905-0.348277235904703
40114.32119.304808379081-4.98480837908085
41113.22120.32564522887-7.10564522887012
42111.56117.708783419215-6.14878341921485
43103.87106.979519663488-3.1095196634876
44102.85105.340590902656-2.49059090265614
45112.27115.310672102741-3.04067210274084
46112.76114.468514483726-1.70851448372557
47118.55112.671134889015.87886511099043
48122.73111.52401191193411.2059880880656
49115.44115.928678556223-0.488678556223022
50116.97112.9642106399064.0057893600936
51119.84118.1639073099051.67609269009493
52116.37118.309949183112-1.93994918311211
53117.23119.060384573374-1.83038457337439
54115.58118.947304481713-3.36730448171336
55109.82111.164961814531-1.34496181453129
56108.46110.555344576119-2.09534457611882
57116.54120.313976097439-3.77397609743856
58117.49120.064094533872-2.57409453387247
59122.87122.8261084617620.0438915382383556
60127.1123.0076659861764.09233401382419
61119.81117.358658353472.45134164652981
62120.03118.3318301862671.6981698137335
63128.58121.2097385669647.37026143303626
64120.4121.074805721963-0.674805721962883
65121.54122.348752648756-0.808752648756325
66118.71121.615267057964-2.90526705796397
67111.57115.29634062937-3.7263406293696
68109.97113.352091615959-3.38209161595896
69120.29121.5724709389-1.28247093890033
70120.61122.985151280497-2.37515128049668
71130.15127.498611243552.65138875645013
72136.12131.2124414813234.90755851867709

\begin{tabular}{lllllllll}
\hline
Interpolation Forecasts of Exponential Smoothing \tabularnewline
t & Observed & Fitted & Residuals \tabularnewline
13 & 113.41 & 111.153205128205 & 2.25679487179482 \tabularnewline
14 & 114.33 & 112.772027439442 & 1.5579725605585 \tabularnewline
15 & 116.61 & 115.534270361422 & 1.07572963857814 \tabularnewline
16 & 123.64 & 122.895849447403 & 0.744150552596778 \tabularnewline
17 & 123.77 & 123.515318239515 & 0.254681760485298 \tabularnewline
18 & 123.39 & 123.661118106084 & -0.271118106084373 \tabularnewline
19 & 116.03 & 114.297734672022 & 1.73226532797842 \tabularnewline
20 & 114.95 & 114.006578732663 & 0.943421267336944 \tabularnewline
21 & 123.4 & 123.768679499155 & -0.368679499155476 \tabularnewline
22 & 123.53 & 123.630764671931 & -0.100764671931046 \tabularnewline
23 & 114.45 & 121.32215457734 & -6.87215457734035 \tabularnewline
24 & 114.26 & 116.774173731695 & -2.51417373169454 \tabularnewline
25 & 114.35 & 116.506916361675 & -2.15691636167458 \tabularnewline
26 & 112.77 & 116.096183412678 & -3.32618341267764 \tabularnewline
27 & 115.31 & 116.799347373014 & -1.48934737301364 \tabularnewline
28 & 114.93 & 123.029272500428 & -8.09927250042782 \tabularnewline
29 & 116.38 & 120.166751748898 & -3.78675174889808 \tabularnewline
30 & 115.07 & 118.527395245102 & -3.45739524510198 \tabularnewline
31 & 105 & 109.308375375793 & -4.30837537579262 \tabularnewline
32 & 103.43 & 106.347097367016 & -2.91709736701625 \tabularnewline
33 & 114.52 & 113.884213107065 & 0.635786892935243 \tabularnewline
34 & 115.04 & 114.278057721674 & 0.761942278325975 \tabularnewline
35 & 117.16 & 107.93271397502 & 9.22728602498032 \tabularnewline
36 & 115 & 111.948693667714 & 3.05130633228562 \tabularnewline
37 & 116.22 & 113.90436278721 & 2.31563721279007 \tabularnewline
38 & 112.92 & 114.345353658218 & -1.42535365821755 \tabularnewline
39 & 116.56 & 116.908277235905 & -0.348277235904703 \tabularnewline
40 & 114.32 & 119.304808379081 & -4.98480837908085 \tabularnewline
41 & 113.22 & 120.32564522887 & -7.10564522887012 \tabularnewline
42 & 111.56 & 117.708783419215 & -6.14878341921485 \tabularnewline
43 & 103.87 & 106.979519663488 & -3.1095196634876 \tabularnewline
44 & 102.85 & 105.340590902656 & -2.49059090265614 \tabularnewline
45 & 112.27 & 115.310672102741 & -3.04067210274084 \tabularnewline
46 & 112.76 & 114.468514483726 & -1.70851448372557 \tabularnewline
47 & 118.55 & 112.67113488901 & 5.87886511099043 \tabularnewline
48 & 122.73 & 111.524011911934 & 11.2059880880656 \tabularnewline
49 & 115.44 & 115.928678556223 & -0.488678556223022 \tabularnewline
50 & 116.97 & 112.964210639906 & 4.0057893600936 \tabularnewline
51 & 119.84 & 118.163907309905 & 1.67609269009493 \tabularnewline
52 & 116.37 & 118.309949183112 & -1.93994918311211 \tabularnewline
53 & 117.23 & 119.060384573374 & -1.83038457337439 \tabularnewline
54 & 115.58 & 118.947304481713 & -3.36730448171336 \tabularnewline
55 & 109.82 & 111.164961814531 & -1.34496181453129 \tabularnewline
56 & 108.46 & 110.555344576119 & -2.09534457611882 \tabularnewline
57 & 116.54 & 120.313976097439 & -3.77397609743856 \tabularnewline
58 & 117.49 & 120.064094533872 & -2.57409453387247 \tabularnewline
59 & 122.87 & 122.826108461762 & 0.0438915382383556 \tabularnewline
60 & 127.1 & 123.007665986176 & 4.09233401382419 \tabularnewline
61 & 119.81 & 117.35865835347 & 2.45134164652981 \tabularnewline
62 & 120.03 & 118.331830186267 & 1.6981698137335 \tabularnewline
63 & 128.58 & 121.209738566964 & 7.37026143303626 \tabularnewline
64 & 120.4 & 121.074805721963 & -0.674805721962883 \tabularnewline
65 & 121.54 & 122.348752648756 & -0.808752648756325 \tabularnewline
66 & 118.71 & 121.615267057964 & -2.90526705796397 \tabularnewline
67 & 111.57 & 115.29634062937 & -3.7263406293696 \tabularnewline
68 & 109.97 & 113.352091615959 & -3.38209161595896 \tabularnewline
69 & 120.29 & 121.5724709389 & -1.28247093890033 \tabularnewline
70 & 120.61 & 122.985151280497 & -2.37515128049668 \tabularnewline
71 & 130.15 & 127.49861124355 & 2.65138875645013 \tabularnewline
72 & 136.12 & 131.212441481323 & 4.90755851867709 \tabularnewline
\hline
\end{tabular}
%Source: https://freestatistics.org/blog/index.php?pk=271965&T=2

[TABLE]
[ROW][C]Interpolation Forecasts of Exponential Smoothing[/C][/ROW]
[ROW][C]t[/C][C]Observed[/C][C]Fitted[/C][C]Residuals[/C][/ROW]
[ROW][C]13[/C][C]113.41[/C][C]111.153205128205[/C][C]2.25679487179482[/C][/ROW]
[ROW][C]14[/C][C]114.33[/C][C]112.772027439442[/C][C]1.5579725605585[/C][/ROW]
[ROW][C]15[/C][C]116.61[/C][C]115.534270361422[/C][C]1.07572963857814[/C][/ROW]
[ROW][C]16[/C][C]123.64[/C][C]122.895849447403[/C][C]0.744150552596778[/C][/ROW]
[ROW][C]17[/C][C]123.77[/C][C]123.515318239515[/C][C]0.254681760485298[/C][/ROW]
[ROW][C]18[/C][C]123.39[/C][C]123.661118106084[/C][C]-0.271118106084373[/C][/ROW]
[ROW][C]19[/C][C]116.03[/C][C]114.297734672022[/C][C]1.73226532797842[/C][/ROW]
[ROW][C]20[/C][C]114.95[/C][C]114.006578732663[/C][C]0.943421267336944[/C][/ROW]
[ROW][C]21[/C][C]123.4[/C][C]123.768679499155[/C][C]-0.368679499155476[/C][/ROW]
[ROW][C]22[/C][C]123.53[/C][C]123.630764671931[/C][C]-0.100764671931046[/C][/ROW]
[ROW][C]23[/C][C]114.45[/C][C]121.32215457734[/C][C]-6.87215457734035[/C][/ROW]
[ROW][C]24[/C][C]114.26[/C][C]116.774173731695[/C][C]-2.51417373169454[/C][/ROW]
[ROW][C]25[/C][C]114.35[/C][C]116.506916361675[/C][C]-2.15691636167458[/C][/ROW]
[ROW][C]26[/C][C]112.77[/C][C]116.096183412678[/C][C]-3.32618341267764[/C][/ROW]
[ROW][C]27[/C][C]115.31[/C][C]116.799347373014[/C][C]-1.48934737301364[/C][/ROW]
[ROW][C]28[/C][C]114.93[/C][C]123.029272500428[/C][C]-8.09927250042782[/C][/ROW]
[ROW][C]29[/C][C]116.38[/C][C]120.166751748898[/C][C]-3.78675174889808[/C][/ROW]
[ROW][C]30[/C][C]115.07[/C][C]118.527395245102[/C][C]-3.45739524510198[/C][/ROW]
[ROW][C]31[/C][C]105[/C][C]109.308375375793[/C][C]-4.30837537579262[/C][/ROW]
[ROW][C]32[/C][C]103.43[/C][C]106.347097367016[/C][C]-2.91709736701625[/C][/ROW]
[ROW][C]33[/C][C]114.52[/C][C]113.884213107065[/C][C]0.635786892935243[/C][/ROW]
[ROW][C]34[/C][C]115.04[/C][C]114.278057721674[/C][C]0.761942278325975[/C][/ROW]
[ROW][C]35[/C][C]117.16[/C][C]107.93271397502[/C][C]9.22728602498032[/C][/ROW]
[ROW][C]36[/C][C]115[/C][C]111.948693667714[/C][C]3.05130633228562[/C][/ROW]
[ROW][C]37[/C][C]116.22[/C][C]113.90436278721[/C][C]2.31563721279007[/C][/ROW]
[ROW][C]38[/C][C]112.92[/C][C]114.345353658218[/C][C]-1.42535365821755[/C][/ROW]
[ROW][C]39[/C][C]116.56[/C][C]116.908277235905[/C][C]-0.348277235904703[/C][/ROW]
[ROW][C]40[/C][C]114.32[/C][C]119.304808379081[/C][C]-4.98480837908085[/C][/ROW]
[ROW][C]41[/C][C]113.22[/C][C]120.32564522887[/C][C]-7.10564522887012[/C][/ROW]
[ROW][C]42[/C][C]111.56[/C][C]117.708783419215[/C][C]-6.14878341921485[/C][/ROW]
[ROW][C]43[/C][C]103.87[/C][C]106.979519663488[/C][C]-3.1095196634876[/C][/ROW]
[ROW][C]44[/C][C]102.85[/C][C]105.340590902656[/C][C]-2.49059090265614[/C][/ROW]
[ROW][C]45[/C][C]112.27[/C][C]115.310672102741[/C][C]-3.04067210274084[/C][/ROW]
[ROW][C]46[/C][C]112.76[/C][C]114.468514483726[/C][C]-1.70851448372557[/C][/ROW]
[ROW][C]47[/C][C]118.55[/C][C]112.67113488901[/C][C]5.87886511099043[/C][/ROW]
[ROW][C]48[/C][C]122.73[/C][C]111.524011911934[/C][C]11.2059880880656[/C][/ROW]
[ROW][C]49[/C][C]115.44[/C][C]115.928678556223[/C][C]-0.488678556223022[/C][/ROW]
[ROW][C]50[/C][C]116.97[/C][C]112.964210639906[/C][C]4.0057893600936[/C][/ROW]
[ROW][C]51[/C][C]119.84[/C][C]118.163907309905[/C][C]1.67609269009493[/C][/ROW]
[ROW][C]52[/C][C]116.37[/C][C]118.309949183112[/C][C]-1.93994918311211[/C][/ROW]
[ROW][C]53[/C][C]117.23[/C][C]119.060384573374[/C][C]-1.83038457337439[/C][/ROW]
[ROW][C]54[/C][C]115.58[/C][C]118.947304481713[/C][C]-3.36730448171336[/C][/ROW]
[ROW][C]55[/C][C]109.82[/C][C]111.164961814531[/C][C]-1.34496181453129[/C][/ROW]
[ROW][C]56[/C][C]108.46[/C][C]110.555344576119[/C][C]-2.09534457611882[/C][/ROW]
[ROW][C]57[/C][C]116.54[/C][C]120.313976097439[/C][C]-3.77397609743856[/C][/ROW]
[ROW][C]58[/C][C]117.49[/C][C]120.064094533872[/C][C]-2.57409453387247[/C][/ROW]
[ROW][C]59[/C][C]122.87[/C][C]122.826108461762[/C][C]0.0438915382383556[/C][/ROW]
[ROW][C]60[/C][C]127.1[/C][C]123.007665986176[/C][C]4.09233401382419[/C][/ROW]
[ROW][C]61[/C][C]119.81[/C][C]117.35865835347[/C][C]2.45134164652981[/C][/ROW]
[ROW][C]62[/C][C]120.03[/C][C]118.331830186267[/C][C]1.6981698137335[/C][/ROW]
[ROW][C]63[/C][C]128.58[/C][C]121.209738566964[/C][C]7.37026143303626[/C][/ROW]
[ROW][C]64[/C][C]120.4[/C][C]121.074805721963[/C][C]-0.674805721962883[/C][/ROW]
[ROW][C]65[/C][C]121.54[/C][C]122.348752648756[/C][C]-0.808752648756325[/C][/ROW]
[ROW][C]66[/C][C]118.71[/C][C]121.615267057964[/C][C]-2.90526705796397[/C][/ROW]
[ROW][C]67[/C][C]111.57[/C][C]115.29634062937[/C][C]-3.7263406293696[/C][/ROW]
[ROW][C]68[/C][C]109.97[/C][C]113.352091615959[/C][C]-3.38209161595896[/C][/ROW]
[ROW][C]69[/C][C]120.29[/C][C]121.5724709389[/C][C]-1.28247093890033[/C][/ROW]
[ROW][C]70[/C][C]120.61[/C][C]122.985151280497[/C][C]-2.37515128049668[/C][/ROW]
[ROW][C]71[/C][C]130.15[/C][C]127.49861124355[/C][C]2.65138875645013[/C][/ROW]
[ROW][C]72[/C][C]136.12[/C][C]131.212441481323[/C][C]4.90755851867709[/C][/ROW]
[/TABLE]
Source: https://freestatistics.org/blog/index.php?pk=271965&T=2

Globally Unique Identifier (entire table): ba.freestatistics.org/blog/index.php?pk=271965&T=2

As an alternative you can also use a QR Code:  

The GUIDs for individual cells are displayed in the table below:

Interpolation Forecasts of Exponential Smoothing
tObservedFittedResiduals
13113.41111.1532051282052.25679487179482
14114.33112.7720274394421.5579725605585
15116.61115.5342703614221.07572963857814
16123.64122.8958494474030.744150552596778
17123.77123.5153182395150.254681760485298
18123.39123.661118106084-0.271118106084373
19116.03114.2977346720221.73226532797842
20114.95114.0065787326630.943421267336944
21123.4123.768679499155-0.368679499155476
22123.53123.630764671931-0.100764671931046
23114.45121.32215457734-6.87215457734035
24114.26116.774173731695-2.51417373169454
25114.35116.506916361675-2.15691636167458
26112.77116.096183412678-3.32618341267764
27115.31116.799347373014-1.48934737301364
28114.93123.029272500428-8.09927250042782
29116.38120.166751748898-3.78675174889808
30115.07118.527395245102-3.45739524510198
31105109.308375375793-4.30837537579262
32103.43106.347097367016-2.91709736701625
33114.52113.8842131070650.635786892935243
34115.04114.2780577216740.761942278325975
35117.16107.932713975029.22728602498032
36115111.9486936677143.05130633228562
37116.22113.904362787212.31563721279007
38112.92114.345353658218-1.42535365821755
39116.56116.908277235905-0.348277235904703
40114.32119.304808379081-4.98480837908085
41113.22120.32564522887-7.10564522887012
42111.56117.708783419215-6.14878341921485
43103.87106.979519663488-3.1095196634876
44102.85105.340590902656-2.49059090265614
45112.27115.310672102741-3.04067210274084
46112.76114.468514483726-1.70851448372557
47118.55112.671134889015.87886511099043
48122.73111.52401191193411.2059880880656
49115.44115.928678556223-0.488678556223022
50116.97112.9642106399064.0057893600936
51119.84118.1639073099051.67609269009493
52116.37118.309949183112-1.93994918311211
53117.23119.060384573374-1.83038457337439
54115.58118.947304481713-3.36730448171336
55109.82111.164961814531-1.34496181453129
56108.46110.555344576119-2.09534457611882
57116.54120.313976097439-3.77397609743856
58117.49120.064094533872-2.57409453387247
59122.87122.8261084617620.0438915382383556
60127.1123.0076659861764.09233401382419
61119.81117.358658353472.45134164652981
62120.03118.3318301862671.6981698137335
63128.58121.2097385669647.37026143303626
64120.4121.074805721963-0.674805721962883
65121.54122.348752648756-0.808752648756325
66118.71121.615267057964-2.90526705796397
67111.57115.29634062937-3.7263406293696
68109.97113.352091615959-3.38209161595896
69120.29121.5724709389-1.28247093890033
70120.61122.985151280497-2.37515128049668
71130.15127.498611243552.65138875645013
72136.12131.2124414813234.90755851867709


Extrapolation Forecasts of Exponential Smoothing
tForecast95% Lower Bound95% Upper Bound
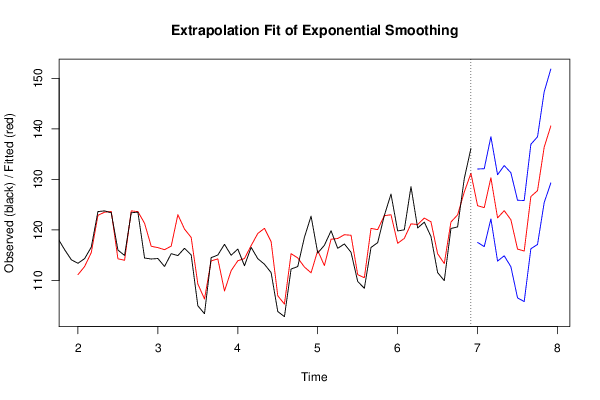
73124.802297861977117.545350105136132.059245618818
74124.413986127378116.70548569431132.122486560446
75130.323839965008122.188812791871138.458867138146
76122.385566225789113.845287817636130.925844633943
77123.815274429673114.888122393898132.742426465449
78122.025987807812112.728045473568131.323930142057
79116.220822942454106.566320374635125.875325510273
80115.832342544816105.833987279419125.830697810213
81126.611744257829116.280974867595136.942513648062
82127.782561639983117.12974584437138.435377435596
83136.372791551922125.407383554207147.338199549636
84140.584825174825129.315492420069151.854157929582

\begin{tabular}{lllllllll}
\hline
Extrapolation Forecasts of Exponential Smoothing \tabularnewline
t & Forecast & 95% Lower Bound & 95% Upper Bound \tabularnewline
73 & 124.802297861977 & 117.545350105136 & 132.059245618818 \tabularnewline
74 & 124.413986127378 & 116.70548569431 & 132.122486560446 \tabularnewline
75 & 130.323839965008 & 122.188812791871 & 138.458867138146 \tabularnewline
76 & 122.385566225789 & 113.845287817636 & 130.925844633943 \tabularnewline
77 & 123.815274429673 & 114.888122393898 & 132.742426465449 \tabularnewline
78 & 122.025987807812 & 112.728045473568 & 131.323930142057 \tabularnewline
79 & 116.220822942454 & 106.566320374635 & 125.875325510273 \tabularnewline
80 & 115.832342544816 & 105.833987279419 & 125.830697810213 \tabularnewline
81 & 126.611744257829 & 116.280974867595 & 136.942513648062 \tabularnewline
82 & 127.782561639983 & 117.12974584437 & 138.435377435596 \tabularnewline
83 & 136.372791551922 & 125.407383554207 & 147.338199549636 \tabularnewline
84 & 140.584825174825 & 129.315492420069 & 151.854157929582 \tabularnewline
\hline
\end{tabular}
%Source: https://freestatistics.org/blog/index.php?pk=271965&T=3

[TABLE]
[ROW][C]Extrapolation Forecasts of Exponential Smoothing[/C][/ROW]
[ROW][C]t[/C][C]Forecast[/C][C]95% Lower Bound[/C][C]95% Upper Bound[/C][/ROW]
[ROW][C]73[/C][C]124.802297861977[/C][C]117.545350105136[/C][C]132.059245618818[/C][/ROW]
[ROW][C]74[/C][C]124.413986127378[/C][C]116.70548569431[/C][C]132.122486560446[/C][/ROW]
[ROW][C]75[/C][C]130.323839965008[/C][C]122.188812791871[/C][C]138.458867138146[/C][/ROW]
[ROW][C]76[/C][C]122.385566225789[/C][C]113.845287817636[/C][C]130.925844633943[/C][/ROW]
[ROW][C]77[/C][C]123.815274429673[/C][C]114.888122393898[/C][C]132.742426465449[/C][/ROW]
[ROW][C]78[/C][C]122.025987807812[/C][C]112.728045473568[/C][C]131.323930142057[/C][/ROW]
[ROW][C]79[/C][C]116.220822942454[/C][C]106.566320374635[/C][C]125.875325510273[/C][/ROW]
[ROW][C]80[/C][C]115.832342544816[/C][C]105.833987279419[/C][C]125.830697810213[/C][/ROW]
[ROW][C]81[/C][C]126.611744257829[/C][C]116.280974867595[/C][C]136.942513648062[/C][/ROW]
[ROW][C]82[/C][C]127.782561639983[/C][C]117.12974584437[/C][C]138.435377435596[/C][/ROW]
[ROW][C]83[/C][C]136.372791551922[/C][C]125.407383554207[/C][C]147.338199549636[/C][/ROW]
[ROW][C]84[/C][C]140.584825174825[/C][C]129.315492420069[/C][C]151.854157929582[/C][/ROW]
[/TABLE]
Source: https://freestatistics.org/blog/index.php?pk=271965&T=3

Globally Unique Identifier (entire table): ba.freestatistics.org/blog/index.php?pk=271965&T=3

As an alternative you can also use a QR Code:  

The GUIDs for individual cells are displayed in the table below:

Extrapolation Forecasts of Exponential Smoothing
tForecast95% Lower Bound95% Upper Bound
73124.802297861977117.545350105136132.059245618818
74124.413986127378116.70548569431132.122486560446
75130.323839965008122.188812791871138.458867138146
76122.385566225789113.845287817636130.925844633943
77123.815274429673114.888122393898132.742426465449
78122.025987807812112.728045473568131.323930142057
79116.220822942454106.566320374635125.875325510273
80115.832342544816105.833987279419125.830697810213
81126.611744257829116.280974867595136.942513648062
82127.782561639983117.12974584437138.435377435596
83136.372791551922125.407383554207147.338199549636
84140.584825174825129.315492420069151.854157929582


Parameters (Session):
par1 = 48 ; par2 = 1 ; par3 = 0 ; par4 = 0 ; par5 = 12 ; par6 = White Noise ; par7 = 0.95 ;
Parameters (R input):
par1 = 12 ; par2 = Triple ; par3 = additive ;
R code (references can be found in the software module):
par1 <- as.numeric(par1)
if (par2 == 'Single') K <- 1
if (par2 == 'Double') K <- 2
if (par2 == 'Triple') K <- par1
nx <- length(x)
nxmK <- nx - K
x <- ts(x, frequency = par1)
if (par2 == 'Single') fit <- HoltWinters(x, gamma=F, beta=F)
if (par2 == 'Double') fit <- HoltWinters(x, gamma=F)
if (par2 == 'Triple') fit <- HoltWinters(x, seasonal=par3)
fit
myresid <- x - fit$fitted[,'xhat']
bitmap(file='test1.png')
op <- par(mfrow=c(2,1))
plot(fit,ylab='Observed (black) / Fitted (red)',main='Interpolation Fit of Exponential Smoothing')
plot(myresid,ylab='Residuals',main='Interpolation Prediction Errors')
par(op)
dev.off()
bitmap(file='test2.png')
p <- predict(fit, par1, prediction.interval=TRUE)
np <- length(p[,1])
plot(fit,p,ylab='Observed (black) / Fitted (red)',main='Extrapolation Fit of Exponential Smoothing')
dev.off()
bitmap(file='test3.png')
op <- par(mfrow = c(2,2))
acf(as.numeric(myresid),lag.max = nx/2,main='Residual ACF')
spectrum(myresid,main='Residals Periodogram')
cpgram(myresid,main='Residal Cumulative Periodogram')
qqnorm(myresid,main='Residual Normal QQ Plot')
qqline(myresid)
par(op)
dev.off()
load(file='createtable')
a<-table.start()
a<-table.row.start(a)
a<-table.element(a,'Estimated Parameters of Exponential Smoothing',2,TRUE)
a<-table.row.end(a)
a<-table.row.start(a)
a<-table.element(a,'Parameter',header=TRUE)
a<-table.element(a,'Value',header=TRUE)
a<-table.row.end(a)
a<-table.row.start(a)
a<-table.element(a,'alpha',header=TRUE)
a<-table.element(a,fit$alpha)
a<-table.row.end(a)
a<-table.row.start(a)
a<-table.element(a,'beta',header=TRUE)
a<-table.element(a,fit$beta)
a<-table.row.end(a)
a<-table.row.start(a)
a<-table.element(a,'gamma',header=TRUE)
a<-table.element(a,fit$gamma)
a<-table.row.end(a)
a<-table.end(a)
table.save(a,file='mytable.tab')
a<-table.start()
a<-table.row.start(a)
a<-table.element(a,'Interpolation Forecasts of Exponential Smoothing',4,TRUE)
a<-table.row.end(a)
a<-table.row.start(a)
a<-table.element(a,'t',header=TRUE)
a<-table.element(a,'Observed',header=TRUE)
a<-table.element(a,'Fitted',header=TRUE)
a<-table.element(a,'Residuals',header=TRUE)
a<-table.row.end(a)
for (i in 1:nxmK) {
a<-table.row.start(a)
a<-table.element(a,i+K,header=TRUE)
a<-table.element(a,x[i+K])
a<-table.element(a,fit$fitted[i,'xhat'])
a<-table.element(a,myresid[i])
a<-table.row.end(a)
}
a<-table.end(a)
table.save(a,file='mytable1.tab')
a<-table.start()
a<-table.row.start(a)
a<-table.element(a,'Extrapolation Forecasts of Exponential Smoothing',4,TRUE)
a<-table.row.end(a)
a<-table.row.start(a)
a<-table.element(a,'t',header=TRUE)
a<-table.element(a,'Forecast',header=TRUE)
a<-table.element(a,'95% Lower Bound',header=TRUE)
a<-table.element(a,'95% Upper Bound',header=TRUE)
a<-table.row.end(a)
for (i in 1:np) {
a<-table.row.start(a)
a<-table.element(a,nx+i,header=TRUE)
a<-table.element(a,p[i,'fit'])
a<-table.element(a,p[i,'lwr'])
a<-table.element(a,p[i,'upr'])
a<-table.row.end(a)
}
a<-table.end(a)
table.save(a,file='mytable2.tab')