Free Statistics

of Irreproducible Research!

Author's title

Author*Unverified author*
R Software Modulerwasp_autocorrelation.wasp
Title produced by software(Partial) Autocorrelation Function
Date of computationSun, 04 Jan 2015 19:02:11 +0000
Cite this page as followsStatistical Computations at FreeStatistics.org, Office for Research Development and Education, URL https://freestatistics.org/blog/index.php?v=date/2015/Jan/04/t1420398226imjuw1hg2tkxfac.htm/, Retrieved Tue, 14 May 2024 14:45:18 +0000
Statistical Computations at FreeStatistics.org, Office for Research Development and Education, URL https://freestatistics.org/blog/index.php?pk=271930, Retrieved Tue, 14 May 2024 14:45:18 +0000
QR Codes:

Original text written by user:
IsPrivate?No (this computation is public)
User-defined keywords
Estimated Impact145
Family? (F = Feedback message, R = changed R code, M = changed R Module, P = changed Parameters, D = changed Data)
-     [Harrell-Davis Quantiles] [Passagiers Luchtv...] [2014-10-04 18:09:38] [da203b4044df9dd26d1159f6b4128273]
- RMPD  [Mean Plot] [Verkopen Mini Ned...] [2015-01-04 17:45:27] [497bb8e6e78035d7f05a07fa2cbbdf7c]
- RM D      [(Partial) Autocorrelation Function] [verkopen BMW] [2015-01-04 19:02:11] [8f795c08ce5b45f0e59533fe19a9a846] [Current]
Feedback Forum

Post a new message
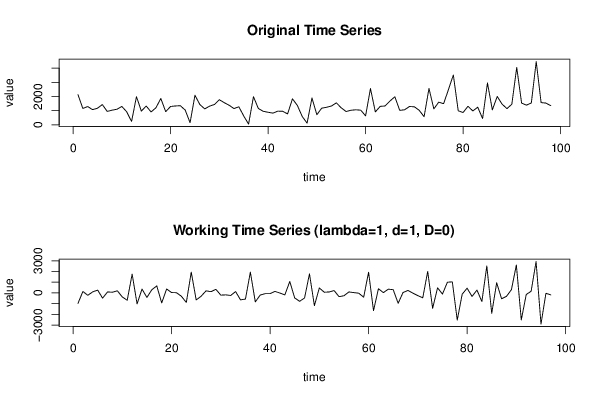
Dataseries X:
2135
1157
1290
1071
1169
1431
945
1034
1100
1297
921
236
1990
966
1326
908
1206
1861
929
1296
1332
1352
1040
148
2090
1435
1124
1319
1436
1774
1566
1385
1147
1274
625
52
1990
1154
954
887
825
966
954
770
1838
1371
589
116
1898
712
1175
1240
1329
1550
1201
938
1030
1060
1035
635
2565
910
1304
1331
1681
1983
1021
1061
1292
1274
1024
568
2570
1125
1600
1492
2492
3523
990
869
1310
979
1244
442
2956
1055
2004
1462
1144
1454
4060
1538
1388
1547
4473
1570
1535
1352


Summary of computational transaction
Raw Inputview raw input (R code)
Raw Outputview raw output of R engine
Computing time2 seconds
R Server'Gwilym Jenkins' @ jenkins.wessa.net

\begin{tabular}{lllllllll}
\hline
Summary of computational transaction \tabularnewline
Raw Input & view raw input (R code)  \tabularnewline
Raw Output & view raw output of R engine  \tabularnewline
Computing time & 2 seconds \tabularnewline
R Server & 'Gwilym Jenkins' @ jenkins.wessa.net \tabularnewline
\hline
\end{tabular}
%Source: https://freestatistics.org/blog/index.php?pk=271930&T=0

[TABLE]
[ROW][C]Summary of computational transaction[/C][/ROW]
[ROW][C]Raw Input[/C][C]view raw input (R code) [/C][/ROW]
[ROW][C]Raw Output[/C][C]view raw output of R engine [/C][/ROW]
[ROW][C]Computing time[/C][C]2 seconds[/C][/ROW]
[ROW][C]R Server[/C][C]'Gwilym Jenkins' @ jenkins.wessa.net[/C][/ROW]
[/TABLE]
Source: https://freestatistics.org/blog/index.php?pk=271930&T=0

Globally Unique Identifier (entire table): ba.freestatistics.org/blog/index.php?pk=271930&T=0

As an alternative you can also use a QR Code:  

The GUIDs for individual cells are displayed in the table below:

Summary of computational transaction
Raw Inputview raw input (R code)
Raw Outputview raw output of R engine
Computing time2 seconds
R Server'Gwilym Jenkins' @ jenkins.wessa.net


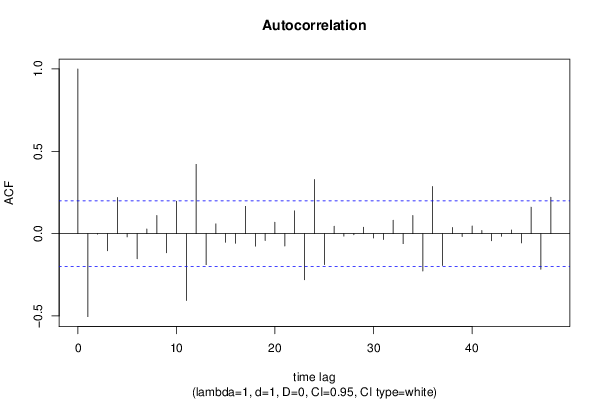
Autocorrelation Function
Time lag kACF(k)T-STATP-value
1-0.504307-4.96681e-06
2-0.003421-0.03370.486594
3-0.103722-1.02150.154769
40.2197962.16470.016431
5-0.019992-0.19690.422158
6-0.15312-1.50810.067396
70.0277530.27330.392587
80.110061.0840.140533
9-0.116423-1.14660.127176
100.1965111.93540.027926
11-0.406201-4.00066.2e-05
120.4206184.14263.7e-05
13-0.188556-1.85710.033168
140.0594140.58520.279899
15-0.053023-0.52220.301356
16-0.058549-0.57660.282757
170.1656941.63190.052972
18-0.075898-0.74750.228282
19-0.042247-0.41610.339135
200.0687610.67720.249939
21-0.075343-0.7420.229927
220.1381031.36020.088466
23-0.28003-2.7580.003476
240.3287453.23780.000825
25-0.188184-1.85340.033433
260.0443840.43710.331492
27-0.015267-0.15040.440394
28-0.006487-0.06390.474594
290.0382910.37710.353452
30-0.027047-0.26640.395256
31-0.036195-0.35650.361128
320.0809890.79760.213513
33-0.060918-0.60.274963
340.1098191.08160.141058
35-0.226692-2.23270.013936
360.286512.82180.002897
37-0.193255-1.90330.02998
380.0367560.3620.359067
39-0.017887-0.17620.430265
400.0465110.45810.323959
410.0184720.18190.428011
42-0.04352-0.42860.334573
43-0.015882-0.15640.438014
440.0220210.21690.41438
45-0.056236-0.55390.290476
460.1607171.58290.058353
47-0.216259-2.12990.017855
480.2209482.17610.015988

\begin{tabular}{lllllllll}
\hline
Autocorrelation Function \tabularnewline
Time lag k & ACF(k) & T-STAT & P-value \tabularnewline
1 & -0.504307 & -4.9668 & 1e-06 \tabularnewline
2 & -0.003421 & -0.0337 & 0.486594 \tabularnewline
3 & -0.103722 & -1.0215 & 0.154769 \tabularnewline
4 & 0.219796 & 2.1647 & 0.016431 \tabularnewline
5 & -0.019992 & -0.1969 & 0.422158 \tabularnewline
6 & -0.15312 & -1.5081 & 0.067396 \tabularnewline
7 & 0.027753 & 0.2733 & 0.392587 \tabularnewline
8 & 0.11006 & 1.084 & 0.140533 \tabularnewline
9 & -0.116423 & -1.1466 & 0.127176 \tabularnewline
10 & 0.196511 & 1.9354 & 0.027926 \tabularnewline
11 & -0.406201 & -4.0006 & 6.2e-05 \tabularnewline
12 & 0.420618 & 4.1426 & 3.7e-05 \tabularnewline
13 & -0.188556 & -1.8571 & 0.033168 \tabularnewline
14 & 0.059414 & 0.5852 & 0.279899 \tabularnewline
15 & -0.053023 & -0.5222 & 0.301356 \tabularnewline
16 & -0.058549 & -0.5766 & 0.282757 \tabularnewline
17 & 0.165694 & 1.6319 & 0.052972 \tabularnewline
18 & -0.075898 & -0.7475 & 0.228282 \tabularnewline
19 & -0.042247 & -0.4161 & 0.339135 \tabularnewline
20 & 0.068761 & 0.6772 & 0.249939 \tabularnewline
21 & -0.075343 & -0.742 & 0.229927 \tabularnewline
22 & 0.138103 & 1.3602 & 0.088466 \tabularnewline
23 & -0.28003 & -2.758 & 0.003476 \tabularnewline
24 & 0.328745 & 3.2378 & 0.000825 \tabularnewline
25 & -0.188184 & -1.8534 & 0.033433 \tabularnewline
26 & 0.044384 & 0.4371 & 0.331492 \tabularnewline
27 & -0.015267 & -0.1504 & 0.440394 \tabularnewline
28 & -0.006487 & -0.0639 & 0.474594 \tabularnewline
29 & 0.038291 & 0.3771 & 0.353452 \tabularnewline
30 & -0.027047 & -0.2664 & 0.395256 \tabularnewline
31 & -0.036195 & -0.3565 & 0.361128 \tabularnewline
32 & 0.080989 & 0.7976 & 0.213513 \tabularnewline
33 & -0.060918 & -0.6 & 0.274963 \tabularnewline
34 & 0.109819 & 1.0816 & 0.141058 \tabularnewline
35 & -0.226692 & -2.2327 & 0.013936 \tabularnewline
36 & 0.28651 & 2.8218 & 0.002897 \tabularnewline
37 & -0.193255 & -1.9033 & 0.02998 \tabularnewline
38 & 0.036756 & 0.362 & 0.359067 \tabularnewline
39 & -0.017887 & -0.1762 & 0.430265 \tabularnewline
40 & 0.046511 & 0.4581 & 0.323959 \tabularnewline
41 & 0.018472 & 0.1819 & 0.428011 \tabularnewline
42 & -0.04352 & -0.4286 & 0.334573 \tabularnewline
43 & -0.015882 & -0.1564 & 0.438014 \tabularnewline
44 & 0.022021 & 0.2169 & 0.41438 \tabularnewline
45 & -0.056236 & -0.5539 & 0.290476 \tabularnewline
46 & 0.160717 & 1.5829 & 0.058353 \tabularnewline
47 & -0.216259 & -2.1299 & 0.017855 \tabularnewline
48 & 0.220948 & 2.1761 & 0.015988 \tabularnewline
\hline
\end{tabular}
%Source: https://freestatistics.org/blog/index.php?pk=271930&T=1

[TABLE]
[ROW][C]Autocorrelation Function[/C][/ROW]
[ROW][C]Time lag k[/C][C]ACF(k)[/C][C]T-STAT[/C][C]P-value[/C][/ROW]
[ROW][C]1[/C][C]-0.504307[/C][C]-4.9668[/C][C]1e-06[/C][/ROW]
[ROW][C]2[/C][C]-0.003421[/C][C]-0.0337[/C][C]0.486594[/C][/ROW]
[ROW][C]3[/C][C]-0.103722[/C][C]-1.0215[/C][C]0.154769[/C][/ROW]
[ROW][C]4[/C][C]0.219796[/C][C]2.1647[/C][C]0.016431[/C][/ROW]
[ROW][C]5[/C][C]-0.019992[/C][C]-0.1969[/C][C]0.422158[/C][/ROW]
[ROW][C]6[/C][C]-0.15312[/C][C]-1.5081[/C][C]0.067396[/C][/ROW]
[ROW][C]7[/C][C]0.027753[/C][C]0.2733[/C][C]0.392587[/C][/ROW]
[ROW][C]8[/C][C]0.11006[/C][C]1.084[/C][C]0.140533[/C][/ROW]
[ROW][C]9[/C][C]-0.116423[/C][C]-1.1466[/C][C]0.127176[/C][/ROW]
[ROW][C]10[/C][C]0.196511[/C][C]1.9354[/C][C]0.027926[/C][/ROW]
[ROW][C]11[/C][C]-0.406201[/C][C]-4.0006[/C][C]6.2e-05[/C][/ROW]
[ROW][C]12[/C][C]0.420618[/C][C]4.1426[/C][C]3.7e-05[/C][/ROW]
[ROW][C]13[/C][C]-0.188556[/C][C]-1.8571[/C][C]0.033168[/C][/ROW]
[ROW][C]14[/C][C]0.059414[/C][C]0.5852[/C][C]0.279899[/C][/ROW]
[ROW][C]15[/C][C]-0.053023[/C][C]-0.5222[/C][C]0.301356[/C][/ROW]
[ROW][C]16[/C][C]-0.058549[/C][C]-0.5766[/C][C]0.282757[/C][/ROW]
[ROW][C]17[/C][C]0.165694[/C][C]1.6319[/C][C]0.052972[/C][/ROW]
[ROW][C]18[/C][C]-0.075898[/C][C]-0.7475[/C][C]0.228282[/C][/ROW]
[ROW][C]19[/C][C]-0.042247[/C][C]-0.4161[/C][C]0.339135[/C][/ROW]
[ROW][C]20[/C][C]0.068761[/C][C]0.6772[/C][C]0.249939[/C][/ROW]
[ROW][C]21[/C][C]-0.075343[/C][C]-0.742[/C][C]0.229927[/C][/ROW]
[ROW][C]22[/C][C]0.138103[/C][C]1.3602[/C][C]0.088466[/C][/ROW]
[ROW][C]23[/C][C]-0.28003[/C][C]-2.758[/C][C]0.003476[/C][/ROW]
[ROW][C]24[/C][C]0.328745[/C][C]3.2378[/C][C]0.000825[/C][/ROW]
[ROW][C]25[/C][C]-0.188184[/C][C]-1.8534[/C][C]0.033433[/C][/ROW]
[ROW][C]26[/C][C]0.044384[/C][C]0.4371[/C][C]0.331492[/C][/ROW]
[ROW][C]27[/C][C]-0.015267[/C][C]-0.1504[/C][C]0.440394[/C][/ROW]
[ROW][C]28[/C][C]-0.006487[/C][C]-0.0639[/C][C]0.474594[/C][/ROW]
[ROW][C]29[/C][C]0.038291[/C][C]0.3771[/C][C]0.353452[/C][/ROW]
[ROW][C]30[/C][C]-0.027047[/C][C]-0.2664[/C][C]0.395256[/C][/ROW]
[ROW][C]31[/C][C]-0.036195[/C][C]-0.3565[/C][C]0.361128[/C][/ROW]
[ROW][C]32[/C][C]0.080989[/C][C]0.7976[/C][C]0.213513[/C][/ROW]
[ROW][C]33[/C][C]-0.060918[/C][C]-0.6[/C][C]0.274963[/C][/ROW]
[ROW][C]34[/C][C]0.109819[/C][C]1.0816[/C][C]0.141058[/C][/ROW]
[ROW][C]35[/C][C]-0.226692[/C][C]-2.2327[/C][C]0.013936[/C][/ROW]
[ROW][C]36[/C][C]0.28651[/C][C]2.8218[/C][C]0.002897[/C][/ROW]
[ROW][C]37[/C][C]-0.193255[/C][C]-1.9033[/C][C]0.02998[/C][/ROW]
[ROW][C]38[/C][C]0.036756[/C][C]0.362[/C][C]0.359067[/C][/ROW]
[ROW][C]39[/C][C]-0.017887[/C][C]-0.1762[/C][C]0.430265[/C][/ROW]
[ROW][C]40[/C][C]0.046511[/C][C]0.4581[/C][C]0.323959[/C][/ROW]
[ROW][C]41[/C][C]0.018472[/C][C]0.1819[/C][C]0.428011[/C][/ROW]
[ROW][C]42[/C][C]-0.04352[/C][C]-0.4286[/C][C]0.334573[/C][/ROW]
[ROW][C]43[/C][C]-0.015882[/C][C]-0.1564[/C][C]0.438014[/C][/ROW]
[ROW][C]44[/C][C]0.022021[/C][C]0.2169[/C][C]0.41438[/C][/ROW]
[ROW][C]45[/C][C]-0.056236[/C][C]-0.5539[/C][C]0.290476[/C][/ROW]
[ROW][C]46[/C][C]0.160717[/C][C]1.5829[/C][C]0.058353[/C][/ROW]
[ROW][C]47[/C][C]-0.216259[/C][C]-2.1299[/C][C]0.017855[/C][/ROW]
[ROW][C]48[/C][C]0.220948[/C][C]2.1761[/C][C]0.015988[/C][/ROW]
[/TABLE]
Source: https://freestatistics.org/blog/index.php?pk=271930&T=1

Globally Unique Identifier (entire table): ba.freestatistics.org/blog/index.php?pk=271930&T=1

As an alternative you can also use a QR Code:  

The GUIDs for individual cells are displayed in the table below:

Autocorrelation Function
Time lag kACF(k)T-STATP-value
1-0.504307-4.96681e-06
2-0.003421-0.03370.486594
3-0.103722-1.02150.154769
40.2197962.16470.016431
5-0.019992-0.19690.422158
6-0.15312-1.50810.067396
70.0277530.27330.392587
80.110061.0840.140533
9-0.116423-1.14660.127176
100.1965111.93540.027926
11-0.406201-4.00066.2e-05
120.4206184.14263.7e-05
13-0.188556-1.85710.033168
140.0594140.58520.279899
15-0.053023-0.52220.301356
16-0.058549-0.57660.282757
170.1656941.63190.052972
18-0.075898-0.74750.228282
19-0.042247-0.41610.339135
200.0687610.67720.249939
21-0.075343-0.7420.229927
220.1381031.36020.088466
23-0.28003-2.7580.003476
240.3287453.23780.000825
25-0.188184-1.85340.033433
260.0443840.43710.331492
27-0.015267-0.15040.440394
28-0.006487-0.06390.474594
290.0382910.37710.353452
30-0.027047-0.26640.395256
31-0.036195-0.35650.361128
320.0809890.79760.213513
33-0.060918-0.60.274963
340.1098191.08160.141058
35-0.226692-2.23270.013936
360.286512.82180.002897
37-0.193255-1.90330.02998
380.0367560.3620.359067
39-0.017887-0.17620.430265
400.0465110.45810.323959
410.0184720.18190.428011
42-0.04352-0.42860.334573
43-0.015882-0.15640.438014
440.0220210.21690.41438
45-0.056236-0.55390.290476
460.1607171.58290.058353
47-0.216259-2.12990.017855
480.2209482.17610.015988


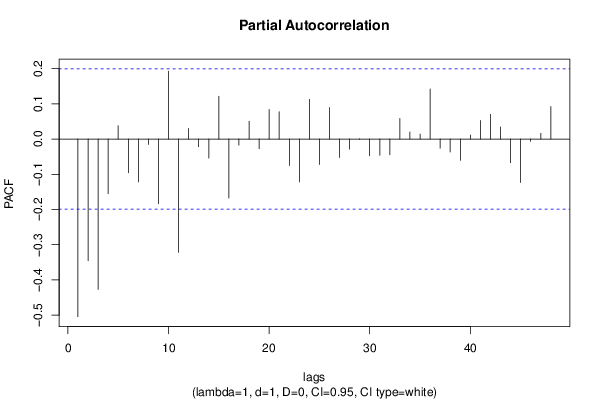
Partial Autocorrelation Function
Time lag kPACF(k)T-STATP-value
1-0.504307-4.96681e-06
2-0.345655-3.40430.000483
3-0.426998-4.20542.9e-05
4-0.15537-1.53020.064609
50.0377670.3720.355366
6-0.095939-0.94490.173533
7-0.121759-1.19920.116687
8-0.015484-0.15250.439553
9-0.183687-1.80910.036766
100.1925011.89590.030474
11-0.321839-3.16970.001021
120.0300290.29580.384026
13-0.021894-0.21560.414864
14-0.054134-0.53320.297572
150.1215991.19760.116993
16-0.167452-1.64920.051169
17-0.017269-0.17010.43265
180.0503070.49550.310695
19-0.027187-0.26780.394726
200.0838230.82560.205539
210.077430.76260.223778
22-0.075033-0.7390.23085
23-0.121593-1.19760.117005
240.1126881.10990.134903
25-0.07238-0.71290.238821
260.0895870.88230.189891
27-0.052606-0.51810.302782
28-0.028718-0.28280.388951
29-0.00046-0.00450.498198
30-0.047253-0.46540.321349
31-0.046227-0.45530.32496
32-0.044681-0.44010.330436
330.0580980.57220.284254
340.0197740.19480.422996
350.0140280.13820.4452
360.1419781.39830.082602
37-0.025894-0.2550.399622
38-0.036628-0.36070.359537
39-0.060717-0.5980.27562
400.0115270.11350.454923
410.0527770.51980.302197
420.0700530.68990.245938
430.0342250.33710.368393
44-0.067396-0.66380.254206
45-0.123319-1.21450.113743
46-0.006298-0.0620.475333
470.016040.1580.437404
480.0920710.90680.183382

\begin{tabular}{lllllllll}
\hline
Partial Autocorrelation Function \tabularnewline
Time lag k & PACF(k) & T-STAT & P-value \tabularnewline
1 & -0.504307 & -4.9668 & 1e-06 \tabularnewline
2 & -0.345655 & -3.4043 & 0.000483 \tabularnewline
3 & -0.426998 & -4.2054 & 2.9e-05 \tabularnewline
4 & -0.15537 & -1.5302 & 0.064609 \tabularnewline
5 & 0.037767 & 0.372 & 0.355366 \tabularnewline
6 & -0.095939 & -0.9449 & 0.173533 \tabularnewline
7 & -0.121759 & -1.1992 & 0.116687 \tabularnewline
8 & -0.015484 & -0.1525 & 0.439553 \tabularnewline
9 & -0.183687 & -1.8091 & 0.036766 \tabularnewline
10 & 0.192501 & 1.8959 & 0.030474 \tabularnewline
11 & -0.321839 & -3.1697 & 0.001021 \tabularnewline
12 & 0.030029 & 0.2958 & 0.384026 \tabularnewline
13 & -0.021894 & -0.2156 & 0.414864 \tabularnewline
14 & -0.054134 & -0.5332 & 0.297572 \tabularnewline
15 & 0.121599 & 1.1976 & 0.116993 \tabularnewline
16 & -0.167452 & -1.6492 & 0.051169 \tabularnewline
17 & -0.017269 & -0.1701 & 0.43265 \tabularnewline
18 & 0.050307 & 0.4955 & 0.310695 \tabularnewline
19 & -0.027187 & -0.2678 & 0.394726 \tabularnewline
20 & 0.083823 & 0.8256 & 0.205539 \tabularnewline
21 & 0.07743 & 0.7626 & 0.223778 \tabularnewline
22 & -0.075033 & -0.739 & 0.23085 \tabularnewline
23 & -0.121593 & -1.1976 & 0.117005 \tabularnewline
24 & 0.112688 & 1.1099 & 0.134903 \tabularnewline
25 & -0.07238 & -0.7129 & 0.238821 \tabularnewline
26 & 0.089587 & 0.8823 & 0.189891 \tabularnewline
27 & -0.052606 & -0.5181 & 0.302782 \tabularnewline
28 & -0.028718 & -0.2828 & 0.388951 \tabularnewline
29 & -0.00046 & -0.0045 & 0.498198 \tabularnewline
30 & -0.047253 & -0.4654 & 0.321349 \tabularnewline
31 & -0.046227 & -0.4553 & 0.32496 \tabularnewline
32 & -0.044681 & -0.4401 & 0.330436 \tabularnewline
33 & 0.058098 & 0.5722 & 0.284254 \tabularnewline
34 & 0.019774 & 0.1948 & 0.422996 \tabularnewline
35 & 0.014028 & 0.1382 & 0.4452 \tabularnewline
36 & 0.141978 & 1.3983 & 0.082602 \tabularnewline
37 & -0.025894 & -0.255 & 0.399622 \tabularnewline
38 & -0.036628 & -0.3607 & 0.359537 \tabularnewline
39 & -0.060717 & -0.598 & 0.27562 \tabularnewline
40 & 0.011527 & 0.1135 & 0.454923 \tabularnewline
41 & 0.052777 & 0.5198 & 0.302197 \tabularnewline
42 & 0.070053 & 0.6899 & 0.245938 \tabularnewline
43 & 0.034225 & 0.3371 & 0.368393 \tabularnewline
44 & -0.067396 & -0.6638 & 0.254206 \tabularnewline
45 & -0.123319 & -1.2145 & 0.113743 \tabularnewline
46 & -0.006298 & -0.062 & 0.475333 \tabularnewline
47 & 0.01604 & 0.158 & 0.437404 \tabularnewline
48 & 0.092071 & 0.9068 & 0.183382 \tabularnewline
\hline
\end{tabular}
%Source: https://freestatistics.org/blog/index.php?pk=271930&T=2

[TABLE]
[ROW][C]Partial Autocorrelation Function[/C][/ROW]
[ROW][C]Time lag k[/C][C]PACF(k)[/C][C]T-STAT[/C][C]P-value[/C][/ROW]
[ROW][C]1[/C][C]-0.504307[/C][C]-4.9668[/C][C]1e-06[/C][/ROW]
[ROW][C]2[/C][C]-0.345655[/C][C]-3.4043[/C][C]0.000483[/C][/ROW]
[ROW][C]3[/C][C]-0.426998[/C][C]-4.2054[/C][C]2.9e-05[/C][/ROW]
[ROW][C]4[/C][C]-0.15537[/C][C]-1.5302[/C][C]0.064609[/C][/ROW]
[ROW][C]5[/C][C]0.037767[/C][C]0.372[/C][C]0.355366[/C][/ROW]
[ROW][C]6[/C][C]-0.095939[/C][C]-0.9449[/C][C]0.173533[/C][/ROW]
[ROW][C]7[/C][C]-0.121759[/C][C]-1.1992[/C][C]0.116687[/C][/ROW]
[ROW][C]8[/C][C]-0.015484[/C][C]-0.1525[/C][C]0.439553[/C][/ROW]
[ROW][C]9[/C][C]-0.183687[/C][C]-1.8091[/C][C]0.036766[/C][/ROW]
[ROW][C]10[/C][C]0.192501[/C][C]1.8959[/C][C]0.030474[/C][/ROW]
[ROW][C]11[/C][C]-0.321839[/C][C]-3.1697[/C][C]0.001021[/C][/ROW]
[ROW][C]12[/C][C]0.030029[/C][C]0.2958[/C][C]0.384026[/C][/ROW]
[ROW][C]13[/C][C]-0.021894[/C][C]-0.2156[/C][C]0.414864[/C][/ROW]
[ROW][C]14[/C][C]-0.054134[/C][C]-0.5332[/C][C]0.297572[/C][/ROW]
[ROW][C]15[/C][C]0.121599[/C][C]1.1976[/C][C]0.116993[/C][/ROW]
[ROW][C]16[/C][C]-0.167452[/C][C]-1.6492[/C][C]0.051169[/C][/ROW]
[ROW][C]17[/C][C]-0.017269[/C][C]-0.1701[/C][C]0.43265[/C][/ROW]
[ROW][C]18[/C][C]0.050307[/C][C]0.4955[/C][C]0.310695[/C][/ROW]
[ROW][C]19[/C][C]-0.027187[/C][C]-0.2678[/C][C]0.394726[/C][/ROW]
[ROW][C]20[/C][C]0.083823[/C][C]0.8256[/C][C]0.205539[/C][/ROW]
[ROW][C]21[/C][C]0.07743[/C][C]0.7626[/C][C]0.223778[/C][/ROW]
[ROW][C]22[/C][C]-0.075033[/C][C]-0.739[/C][C]0.23085[/C][/ROW]
[ROW][C]23[/C][C]-0.121593[/C][C]-1.1976[/C][C]0.117005[/C][/ROW]
[ROW][C]24[/C][C]0.112688[/C][C]1.1099[/C][C]0.134903[/C][/ROW]
[ROW][C]25[/C][C]-0.07238[/C][C]-0.7129[/C][C]0.238821[/C][/ROW]
[ROW][C]26[/C][C]0.089587[/C][C]0.8823[/C][C]0.189891[/C][/ROW]
[ROW][C]27[/C][C]-0.052606[/C][C]-0.5181[/C][C]0.302782[/C][/ROW]
[ROW][C]28[/C][C]-0.028718[/C][C]-0.2828[/C][C]0.388951[/C][/ROW]
[ROW][C]29[/C][C]-0.00046[/C][C]-0.0045[/C][C]0.498198[/C][/ROW]
[ROW][C]30[/C][C]-0.047253[/C][C]-0.4654[/C][C]0.321349[/C][/ROW]
[ROW][C]31[/C][C]-0.046227[/C][C]-0.4553[/C][C]0.32496[/C][/ROW]
[ROW][C]32[/C][C]-0.044681[/C][C]-0.4401[/C][C]0.330436[/C][/ROW]
[ROW][C]33[/C][C]0.058098[/C][C]0.5722[/C][C]0.284254[/C][/ROW]
[ROW][C]34[/C][C]0.019774[/C][C]0.1948[/C][C]0.422996[/C][/ROW]
[ROW][C]35[/C][C]0.014028[/C][C]0.1382[/C][C]0.4452[/C][/ROW]
[ROW][C]36[/C][C]0.141978[/C][C]1.3983[/C][C]0.082602[/C][/ROW]
[ROW][C]37[/C][C]-0.025894[/C][C]-0.255[/C][C]0.399622[/C][/ROW]
[ROW][C]38[/C][C]-0.036628[/C][C]-0.3607[/C][C]0.359537[/C][/ROW]
[ROW][C]39[/C][C]-0.060717[/C][C]-0.598[/C][C]0.27562[/C][/ROW]
[ROW][C]40[/C][C]0.011527[/C][C]0.1135[/C][C]0.454923[/C][/ROW]
[ROW][C]41[/C][C]0.052777[/C][C]0.5198[/C][C]0.302197[/C][/ROW]
[ROW][C]42[/C][C]0.070053[/C][C]0.6899[/C][C]0.245938[/C][/ROW]
[ROW][C]43[/C][C]0.034225[/C][C]0.3371[/C][C]0.368393[/C][/ROW]
[ROW][C]44[/C][C]-0.067396[/C][C]-0.6638[/C][C]0.254206[/C][/ROW]
[ROW][C]45[/C][C]-0.123319[/C][C]-1.2145[/C][C]0.113743[/C][/ROW]
[ROW][C]46[/C][C]-0.006298[/C][C]-0.062[/C][C]0.475333[/C][/ROW]
[ROW][C]47[/C][C]0.01604[/C][C]0.158[/C][C]0.437404[/C][/ROW]
[ROW][C]48[/C][C]0.092071[/C][C]0.9068[/C][C]0.183382[/C][/ROW]
[/TABLE]
Source: https://freestatistics.org/blog/index.php?pk=271930&T=2

Globally Unique Identifier (entire table): ba.freestatistics.org/blog/index.php?pk=271930&T=2

As an alternative you can also use a QR Code:  

The GUIDs for individual cells are displayed in the table below:

Partial Autocorrelation Function
Time lag kPACF(k)T-STATP-value
1-0.504307-4.96681e-06
2-0.345655-3.40430.000483
3-0.426998-4.20542.9e-05
4-0.15537-1.53020.064609
50.0377670.3720.355366
6-0.095939-0.94490.173533
7-0.121759-1.19920.116687
8-0.015484-0.15250.439553
9-0.183687-1.80910.036766
100.1925011.89590.030474
11-0.321839-3.16970.001021
120.0300290.29580.384026
13-0.021894-0.21560.414864
14-0.054134-0.53320.297572
150.1215991.19760.116993
16-0.167452-1.64920.051169
17-0.017269-0.17010.43265
180.0503070.49550.310695
19-0.027187-0.26780.394726
200.0838230.82560.205539
210.077430.76260.223778
22-0.075033-0.7390.23085
23-0.121593-1.19760.117005
240.1126881.10990.134903
25-0.07238-0.71290.238821
260.0895870.88230.189891
27-0.052606-0.51810.302782
28-0.028718-0.28280.388951
29-0.00046-0.00450.498198
30-0.047253-0.46540.321349
31-0.046227-0.45530.32496
32-0.044681-0.44010.330436
330.0580980.57220.284254
340.0197740.19480.422996
350.0140280.13820.4452
360.1419781.39830.082602
37-0.025894-0.2550.399622
38-0.036628-0.36070.359537
39-0.060717-0.5980.27562
400.0115270.11350.454923
410.0527770.51980.302197
420.0700530.68990.245938
430.0342250.33710.368393
44-0.067396-0.66380.254206
45-0.123319-1.21450.113743
46-0.006298-0.0620.475333
470.016040.1580.437404
480.0920710.90680.183382


Parameters (Session):
Parameters (R input):
par1 = 48 ; par2 = 1 ; par3 = 1 ; par4 = 0 ; par5 = 12 ; par6 = White Noise ; par7 = 0.95 ; par8 = ;
R code (references can be found in the software module):
if (par1 == 'Default') {
par1 = 10*log10(length(x))
} else {
par1 <- as.numeric(par1)
}
par2 <- as.numeric(par2)
par3 <- as.numeric(par3)
par4 <- as.numeric(par4)
par5 <- as.numeric(par5)
if (par6 == 'White Noise') par6 <- 'white' else par6 <- 'ma'
par7 <- as.numeric(par7)
if (par8 != '') par8 <- as.numeric(par8)
ox <- x
if (par8 == '') {
if (par2 == 0) {
x <- log(x)
} else {
x <- (x ^ par2 - 1) / par2
}
} else {
x <- log(x,base=par8)
}
if (par3 > 0) x <- diff(x,lag=1,difference=par3)
if (par4 > 0) x <- diff(x,lag=par5,difference=par4)
bitmap(file='picts.png')
op <- par(mfrow=c(2,1))
plot(ox,type='l',main='Original Time Series',xlab='time',ylab='value')
if (par8=='') {
mytitle <- paste('Working Time Series (lambda=',par2,', d=',par3,', D=',par4,')',sep='')
mysub <- paste('(lambda=',par2,', d=',par3,', D=',par4,', CI=', par7, ', CI type=',par6,')',sep='')
} else {
mytitle <- paste('Working Time Series (base=',par8,', d=',par3,', D=',par4,')',sep='')
mysub <- paste('(base=',par8,', d=',par3,', D=',par4,', CI=', par7, ', CI type=',par6,')',sep='')
}
plot(x,type='l', main=mytitle,xlab='time',ylab='value')
par(op)
dev.off()
bitmap(file='pic1.png')
racf <- acf(x, par1, main='Autocorrelation', xlab='time lag', ylab='ACF', ci.type=par6, ci=par7, sub=mysub)
dev.off()
bitmap(file='pic2.png')
rpacf <- pacf(x,par1,main='Partial Autocorrelation',xlab='lags',ylab='PACF',sub=mysub)
dev.off()
(myacf <- c(racf$acf))
(mypacf <- c(rpacf$acf))
lengthx <- length(x)
sqrtn <- sqrt(lengthx)
load(file='createtable')
a<-table.start()
a<-table.row.start(a)
a<-table.element(a,'Autocorrelation Function',4,TRUE)
a<-table.row.end(a)
a<-table.row.start(a)
a<-table.element(a,'Time lag k',header=TRUE)
a<-table.element(a,hyperlink('basics.htm','ACF(k)','click here for more information about the Autocorrelation Function'),header=TRUE)
a<-table.element(a,'T-STAT',header=TRUE)
a<-table.element(a,'P-value',header=TRUE)
a<-table.row.end(a)
for (i in 2:(par1+1)) {
a<-table.row.start(a)
a<-table.element(a,i-1,header=TRUE)
a<-table.element(a,round(myacf[i],6))
mytstat <- myacf[i]*sqrtn
a<-table.element(a,round(mytstat,4))
a<-table.element(a,round(1-pt(abs(mytstat),lengthx),6))
a<-table.row.end(a)
}
a<-table.end(a)
table.save(a,file='mytable.tab')
a<-table.start()
a<-table.row.start(a)
a<-table.element(a,'Partial Autocorrelation Function',4,TRUE)
a<-table.row.end(a)
a<-table.row.start(a)
a<-table.element(a,'Time lag k',header=TRUE)
a<-table.element(a,hyperlink('basics.htm','PACF(k)','click here for more information about the Partial Autocorrelation Function'),header=TRUE)
a<-table.element(a,'T-STAT',header=TRUE)
a<-table.element(a,'P-value',header=TRUE)
a<-table.row.end(a)
for (i in 1:par1) {
a<-table.row.start(a)
a<-table.element(a,i,header=TRUE)
a<-table.element(a,round(mypacf[i],6))
mytstat <- mypacf[i]*sqrtn
a<-table.element(a,round(mytstat,4))
a<-table.element(a,round(1-pt(abs(mytstat),lengthx),6))
a<-table.row.end(a)
}
a<-table.end(a)
table.save(a,file='mytable1.tab')