Free Statistics

of Irreproducible Research!

Author's title

Author*Unverified author*
R Software Modulerwasp_autocorrelation.wasp
Title produced by software(Partial) Autocorrelation Function
Date of computationSun, 04 Jan 2015 15:46:41 +0000
Cite this page as followsStatistical Computations at FreeStatistics.org, Office for Research Development and Education, URL https://freestatistics.org/blog/index.php?v=date/2015/Jan/04/t1420386639botoryqn6me333z.htm/, Retrieved Tue, 14 May 2024 05:16:20 +0000
Statistical Computations at FreeStatistics.org, Office for Research Development and Education, URL https://freestatistics.org/blog/index.php?pk=271916, Retrieved Tue, 14 May 2024 05:16:20 +0000
QR Codes:

Original text written by user:
IsPrivate?No (this computation is public)
User-defined keywords
Estimated Impact153
Family? (F = Feedback message, R = changed R code, M = changed R Module, P = changed Parameters, D = changed Data)
-       [(Partial) Autocorrelation Function] [eigen reeks-gaell...] [2015-01-04 15:46:41] [3acc2e190882a8fff3240b97d842d2ea] [Current]
Feedback Forum

Post a new message
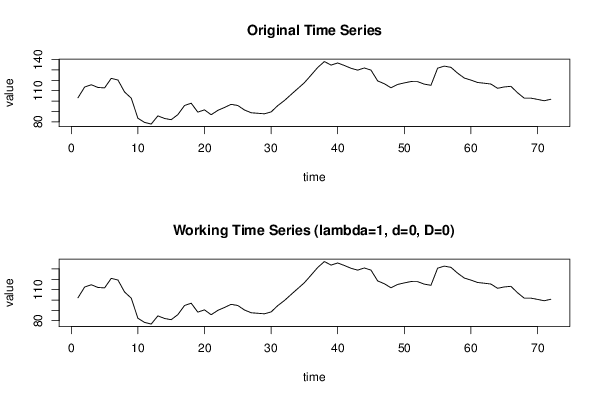
Dataseries X:
103.1
113.5
115.7
113.1
112.7
121.9
120.3
108.7
102.8
83.4
79.4
77.8
85.7
83.2
82
86.9
95.7
97.9
89.3
91.5
86.8
91
93.8
96.8
95.7
91.4
88.7
88.2
87.7
89.5
95.6
100.5
106.3
112
117.7
125
132.4
138.1
134.7
136.7
134.3
131.6
129.8
131.9
129.8
119.4
116.7
112.8
116
117.5
118.8
118.7
116.3
115.2
131.7
133.7
132.5
126.9
122.2
120.2
117.9
117.2
116.4
112.3
113.6
114.2
108
102.8
102.8
101.6
100.3
101.7


Summary of computational transaction
Raw Inputview raw input (R code)
Raw Outputview raw output of R engine
Computing time1 seconds
R Server'George Udny Yule' @ yule.wessa.net

\begin{tabular}{lllllllll}
\hline
Summary of computational transaction \tabularnewline
Raw Input & view raw input (R code)  \tabularnewline
Raw Output & view raw output of R engine  \tabularnewline
Computing time & 1 seconds \tabularnewline
R Server & 'George Udny Yule' @ yule.wessa.net \tabularnewline
\hline
\end{tabular}
%Source: https://freestatistics.org/blog/index.php?pk=271916&T=0

[TABLE]
[ROW][C]Summary of computational transaction[/C][/ROW]
[ROW][C]Raw Input[/C][C]view raw input (R code) [/C][/ROW]
[ROW][C]Raw Output[/C][C]view raw output of R engine [/C][/ROW]
[ROW][C]Computing time[/C][C]1 seconds[/C][/ROW]
[ROW][C]R Server[/C][C]'George Udny Yule' @ yule.wessa.net[/C][/ROW]
[/TABLE]
Source: https://freestatistics.org/blog/index.php?pk=271916&T=0

Globally Unique Identifier (entire table): ba.freestatistics.org/blog/index.php?pk=271916&T=0

As an alternative you can also use a QR Code:  

The GUIDs for individual cells are displayed in the table below:

Summary of computational transaction
Raw Inputview raw input (R code)
Raw Outputview raw output of R engine
Computing time1 seconds
R Server'George Udny Yule' @ yule.wessa.net


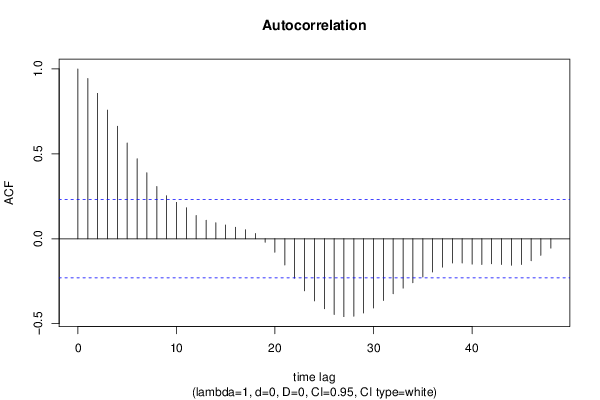
Autocorrelation Function
Time lag kACF(k)T-STATP-value
10.9442998.01260
20.8563237.26610
30.7574816.42740
40.6624235.62080
50.5636554.78284e-06
60.471634.00197.5e-05
70.3886643.29790.000758
80.30782.61180.005478
90.2532052.14850.017518
100.2141481.81710.036681
110.1827571.55070.062674
120.1368691.16140.124663
130.1089380.92440.179191
140.0939830.79750.2139
150.0814280.69090.245914
160.0679590.57660.282988
170.0535170.45410.32556
180.0305030.25880.398253
19-0.020198-0.17140.432199
20-0.080043-0.67920.249599
21-0.154611-1.31190.096857
22-0.232006-1.96860.026423
23-0.306874-2.60390.005594
24-0.366161-3.1070.001352
25-0.412136-3.49710.000405
26-0.446413-3.78790.000156
27-0.458814-3.89320.000109
28-0.456361-3.87230.000117
29-0.437256-3.71020.000202
30-0.408399-3.46540.000448
31-0.364139-3.08980.001423
32-0.324241-2.75130.003752
33-0.290965-2.46890.007963
34-0.259631-2.2030.015396
35-0.225566-1.9140.029798
36-0.196226-1.6650.050127
37-0.167253-1.41920.080079
38-0.142873-1.21230.114678
39-0.143061-1.21390.114374
40-0.149408-1.26780.104483
41-0.151266-1.28350.10171
42-0.147696-1.25320.107087
43-0.15174-1.28760.101011
44-0.155915-1.3230.095014
45-0.151237-1.28330.101753
46-0.129941-1.10260.13694
47-0.097761-0.82950.204773
48-0.05538-0.46990.319919

\begin{tabular}{lllllllll}
\hline
Autocorrelation Function \tabularnewline
Time lag k & ACF(k) & T-STAT & P-value \tabularnewline
1 & 0.944299 & 8.0126 & 0 \tabularnewline
2 & 0.856323 & 7.2661 & 0 \tabularnewline
3 & 0.757481 & 6.4274 & 0 \tabularnewline
4 & 0.662423 & 5.6208 & 0 \tabularnewline
5 & 0.563655 & 4.7828 & 4e-06 \tabularnewline
6 & 0.47163 & 4.0019 & 7.5e-05 \tabularnewline
7 & 0.388664 & 3.2979 & 0.000758 \tabularnewline
8 & 0.3078 & 2.6118 & 0.005478 \tabularnewline
9 & 0.253205 & 2.1485 & 0.017518 \tabularnewline
10 & 0.214148 & 1.8171 & 0.036681 \tabularnewline
11 & 0.182757 & 1.5507 & 0.062674 \tabularnewline
12 & 0.136869 & 1.1614 & 0.124663 \tabularnewline
13 & 0.108938 & 0.9244 & 0.179191 \tabularnewline
14 & 0.093983 & 0.7975 & 0.2139 \tabularnewline
15 & 0.081428 & 0.6909 & 0.245914 \tabularnewline
16 & 0.067959 & 0.5766 & 0.282988 \tabularnewline
17 & 0.053517 & 0.4541 & 0.32556 \tabularnewline
18 & 0.030503 & 0.2588 & 0.398253 \tabularnewline
19 & -0.020198 & -0.1714 & 0.432199 \tabularnewline
20 & -0.080043 & -0.6792 & 0.249599 \tabularnewline
21 & -0.154611 & -1.3119 & 0.096857 \tabularnewline
22 & -0.232006 & -1.9686 & 0.026423 \tabularnewline
23 & -0.306874 & -2.6039 & 0.005594 \tabularnewline
24 & -0.366161 & -3.107 & 0.001352 \tabularnewline
25 & -0.412136 & -3.4971 & 0.000405 \tabularnewline
26 & -0.446413 & -3.7879 & 0.000156 \tabularnewline
27 & -0.458814 & -3.8932 & 0.000109 \tabularnewline
28 & -0.456361 & -3.8723 & 0.000117 \tabularnewline
29 & -0.437256 & -3.7102 & 0.000202 \tabularnewline
30 & -0.408399 & -3.4654 & 0.000448 \tabularnewline
31 & -0.364139 & -3.0898 & 0.001423 \tabularnewline
32 & -0.324241 & -2.7513 & 0.003752 \tabularnewline
33 & -0.290965 & -2.4689 & 0.007963 \tabularnewline
34 & -0.259631 & -2.203 & 0.015396 \tabularnewline
35 & -0.225566 & -1.914 & 0.029798 \tabularnewline
36 & -0.196226 & -1.665 & 0.050127 \tabularnewline
37 & -0.167253 & -1.4192 & 0.080079 \tabularnewline
38 & -0.142873 & -1.2123 & 0.114678 \tabularnewline
39 & -0.143061 & -1.2139 & 0.114374 \tabularnewline
40 & -0.149408 & -1.2678 & 0.104483 \tabularnewline
41 & -0.151266 & -1.2835 & 0.10171 \tabularnewline
42 & -0.147696 & -1.2532 & 0.107087 \tabularnewline
43 & -0.15174 & -1.2876 & 0.101011 \tabularnewline
44 & -0.155915 & -1.323 & 0.095014 \tabularnewline
45 & -0.151237 & -1.2833 & 0.101753 \tabularnewline
46 & -0.129941 & -1.1026 & 0.13694 \tabularnewline
47 & -0.097761 & -0.8295 & 0.204773 \tabularnewline
48 & -0.05538 & -0.4699 & 0.319919 \tabularnewline
\hline
\end{tabular}
%Source: https://freestatistics.org/blog/index.php?pk=271916&T=1

[TABLE]
[ROW][C]Autocorrelation Function[/C][/ROW]
[ROW][C]Time lag k[/C][C]ACF(k)[/C][C]T-STAT[/C][C]P-value[/C][/ROW]
[ROW][C]1[/C][C]0.944299[/C][C]8.0126[/C][C]0[/C][/ROW]
[ROW][C]2[/C][C]0.856323[/C][C]7.2661[/C][C]0[/C][/ROW]
[ROW][C]3[/C][C]0.757481[/C][C]6.4274[/C][C]0[/C][/ROW]
[ROW][C]4[/C][C]0.662423[/C][C]5.6208[/C][C]0[/C][/ROW]
[ROW][C]5[/C][C]0.563655[/C][C]4.7828[/C][C]4e-06[/C][/ROW]
[ROW][C]6[/C][C]0.47163[/C][C]4.0019[/C][C]7.5e-05[/C][/ROW]
[ROW][C]7[/C][C]0.388664[/C][C]3.2979[/C][C]0.000758[/C][/ROW]
[ROW][C]8[/C][C]0.3078[/C][C]2.6118[/C][C]0.005478[/C][/ROW]
[ROW][C]9[/C][C]0.253205[/C][C]2.1485[/C][C]0.017518[/C][/ROW]
[ROW][C]10[/C][C]0.214148[/C][C]1.8171[/C][C]0.036681[/C][/ROW]
[ROW][C]11[/C][C]0.182757[/C][C]1.5507[/C][C]0.062674[/C][/ROW]
[ROW][C]12[/C][C]0.136869[/C][C]1.1614[/C][C]0.124663[/C][/ROW]
[ROW][C]13[/C][C]0.108938[/C][C]0.9244[/C][C]0.179191[/C][/ROW]
[ROW][C]14[/C][C]0.093983[/C][C]0.7975[/C][C]0.2139[/C][/ROW]
[ROW][C]15[/C][C]0.081428[/C][C]0.6909[/C][C]0.245914[/C][/ROW]
[ROW][C]16[/C][C]0.067959[/C][C]0.5766[/C][C]0.282988[/C][/ROW]
[ROW][C]17[/C][C]0.053517[/C][C]0.4541[/C][C]0.32556[/C][/ROW]
[ROW][C]18[/C][C]0.030503[/C][C]0.2588[/C][C]0.398253[/C][/ROW]
[ROW][C]19[/C][C]-0.020198[/C][C]-0.1714[/C][C]0.432199[/C][/ROW]
[ROW][C]20[/C][C]-0.080043[/C][C]-0.6792[/C][C]0.249599[/C][/ROW]
[ROW][C]21[/C][C]-0.154611[/C][C]-1.3119[/C][C]0.096857[/C][/ROW]
[ROW][C]22[/C][C]-0.232006[/C][C]-1.9686[/C][C]0.026423[/C][/ROW]
[ROW][C]23[/C][C]-0.306874[/C][C]-2.6039[/C][C]0.005594[/C][/ROW]
[ROW][C]24[/C][C]-0.366161[/C][C]-3.107[/C][C]0.001352[/C][/ROW]
[ROW][C]25[/C][C]-0.412136[/C][C]-3.4971[/C][C]0.000405[/C][/ROW]
[ROW][C]26[/C][C]-0.446413[/C][C]-3.7879[/C][C]0.000156[/C][/ROW]
[ROW][C]27[/C][C]-0.458814[/C][C]-3.8932[/C][C]0.000109[/C][/ROW]
[ROW][C]28[/C][C]-0.456361[/C][C]-3.8723[/C][C]0.000117[/C][/ROW]
[ROW][C]29[/C][C]-0.437256[/C][C]-3.7102[/C][C]0.000202[/C][/ROW]
[ROW][C]30[/C][C]-0.408399[/C][C]-3.4654[/C][C]0.000448[/C][/ROW]
[ROW][C]31[/C][C]-0.364139[/C][C]-3.0898[/C][C]0.001423[/C][/ROW]
[ROW][C]32[/C][C]-0.324241[/C][C]-2.7513[/C][C]0.003752[/C][/ROW]
[ROW][C]33[/C][C]-0.290965[/C][C]-2.4689[/C][C]0.007963[/C][/ROW]
[ROW][C]34[/C][C]-0.259631[/C][C]-2.203[/C][C]0.015396[/C][/ROW]
[ROW][C]35[/C][C]-0.225566[/C][C]-1.914[/C][C]0.029798[/C][/ROW]
[ROW][C]36[/C][C]-0.196226[/C][C]-1.665[/C][C]0.050127[/C][/ROW]
[ROW][C]37[/C][C]-0.167253[/C][C]-1.4192[/C][C]0.080079[/C][/ROW]
[ROW][C]38[/C][C]-0.142873[/C][C]-1.2123[/C][C]0.114678[/C][/ROW]
[ROW][C]39[/C][C]-0.143061[/C][C]-1.2139[/C][C]0.114374[/C][/ROW]
[ROW][C]40[/C][C]-0.149408[/C][C]-1.2678[/C][C]0.104483[/C][/ROW]
[ROW][C]41[/C][C]-0.151266[/C][C]-1.2835[/C][C]0.10171[/C][/ROW]
[ROW][C]42[/C][C]-0.147696[/C][C]-1.2532[/C][C]0.107087[/C][/ROW]
[ROW][C]43[/C][C]-0.15174[/C][C]-1.2876[/C][C]0.101011[/C][/ROW]
[ROW][C]44[/C][C]-0.155915[/C][C]-1.323[/C][C]0.095014[/C][/ROW]
[ROW][C]45[/C][C]-0.151237[/C][C]-1.2833[/C][C]0.101753[/C][/ROW]
[ROW][C]46[/C][C]-0.129941[/C][C]-1.1026[/C][C]0.13694[/C][/ROW]
[ROW][C]47[/C][C]-0.097761[/C][C]-0.8295[/C][C]0.204773[/C][/ROW]
[ROW][C]48[/C][C]-0.05538[/C][C]-0.4699[/C][C]0.319919[/C][/ROW]
[/TABLE]
Source: https://freestatistics.org/blog/index.php?pk=271916&T=1

Globally Unique Identifier (entire table): ba.freestatistics.org/blog/index.php?pk=271916&T=1

As an alternative you can also use a QR Code:  

The GUIDs for individual cells are displayed in the table below:

Autocorrelation Function
Time lag kACF(k)T-STATP-value
10.9442998.01260
20.8563237.26610
30.7574816.42740
40.6624235.62080
50.5636554.78284e-06
60.471634.00197.5e-05
70.3886643.29790.000758
80.30782.61180.005478
90.2532052.14850.017518
100.2141481.81710.036681
110.1827571.55070.062674
120.1368691.16140.124663
130.1089380.92440.179191
140.0939830.79750.2139
150.0814280.69090.245914
160.0679590.57660.282988
170.0535170.45410.32556
180.0305030.25880.398253
19-0.020198-0.17140.432199
20-0.080043-0.67920.249599
21-0.154611-1.31190.096857
22-0.232006-1.96860.026423
23-0.306874-2.60390.005594
24-0.366161-3.1070.001352
25-0.412136-3.49710.000405
26-0.446413-3.78790.000156
27-0.458814-3.89320.000109
28-0.456361-3.87230.000117
29-0.437256-3.71020.000202
30-0.408399-3.46540.000448
31-0.364139-3.08980.001423
32-0.324241-2.75130.003752
33-0.290965-2.46890.007963
34-0.259631-2.2030.015396
35-0.225566-1.9140.029798
36-0.196226-1.6650.050127
37-0.167253-1.41920.080079
38-0.142873-1.21230.114678
39-0.143061-1.21390.114374
40-0.149408-1.26780.104483
41-0.151266-1.28350.10171
42-0.147696-1.25320.107087
43-0.15174-1.28760.101011
44-0.155915-1.3230.095014
45-0.151237-1.28330.101753
46-0.129941-1.10260.13694
47-0.097761-0.82950.204773
48-0.05538-0.46990.319919


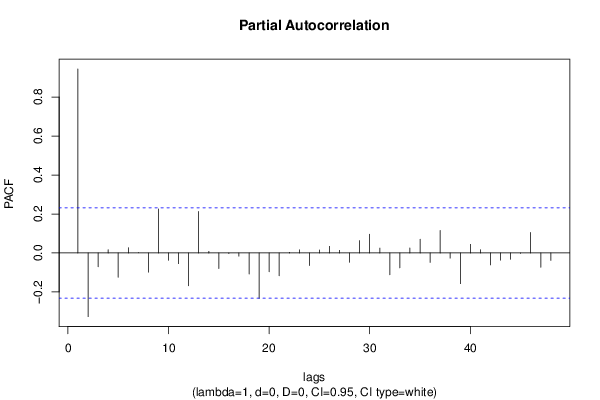
Partial Autocorrelation Function
Time lag kPACF(k)T-STATP-value
10.9442998.01260
2-0.326679-2.7720.003544
3-0.070519-0.59840.275736
40.016580.14070.444254
5-0.124702-1.05810.146767
60.0268060.22750.410358
70.0005110.00430.498276
8-0.098461-0.83550.203108
90.2256891.9150.02973
10-0.037366-0.31710.376059
11-0.054671-0.46390.32206
12-0.167805-1.42390.079401
130.2130571.80780.037404
140.0082480.070.472201
15-0.080003-0.67880.249707
16-0.002976-0.02530.489961
17-0.01631-0.13840.445157
18-0.108116-0.91740.180999
19-0.233015-1.97720.025924
20-0.095947-0.81410.209126
21-0.116934-0.99220.162208
220.0030660.0260.48966
230.0160940.13660.445878
24-0.064247-0.54520.293666
250.0153390.13020.448404
260.0338350.28710.387431
270.0133490.11330.455065
28-0.047714-0.40490.343389
290.0633140.53720.296379
300.0960730.81520.20882
310.0249290.21150.416535
32-0.111712-0.94790.173173
33-0.076263-0.64710.259808
340.0253380.2150.415187
350.0703740.59710.276142
36-0.048177-0.40880.341953
370.1152380.97780.165717
38-0.026561-0.22540.411163
39-0.157455-1.3360.092871
400.0441550.37470.354504
410.0166960.14170.443868
42-0.060958-0.51720.303284
43-0.036721-0.31160.378128
44-0.032263-0.27380.392525
45-0.002055-0.01740.493066
460.1054990.89520.186835
47-0.073546-0.62410.267281
48-0.037866-0.32130.374454

\begin{tabular}{lllllllll}
\hline
Partial Autocorrelation Function \tabularnewline
Time lag k & PACF(k) & T-STAT & P-value \tabularnewline
1 & 0.944299 & 8.0126 & 0 \tabularnewline
2 & -0.326679 & -2.772 & 0.003544 \tabularnewline
3 & -0.070519 & -0.5984 & 0.275736 \tabularnewline
4 & 0.01658 & 0.1407 & 0.444254 \tabularnewline
5 & -0.124702 & -1.0581 & 0.146767 \tabularnewline
6 & 0.026806 & 0.2275 & 0.410358 \tabularnewline
7 & 0.000511 & 0.0043 & 0.498276 \tabularnewline
8 & -0.098461 & -0.8355 & 0.203108 \tabularnewline
9 & 0.225689 & 1.915 & 0.02973 \tabularnewline
10 & -0.037366 & -0.3171 & 0.376059 \tabularnewline
11 & -0.054671 & -0.4639 & 0.32206 \tabularnewline
12 & -0.167805 & -1.4239 & 0.079401 \tabularnewline
13 & 0.213057 & 1.8078 & 0.037404 \tabularnewline
14 & 0.008248 & 0.07 & 0.472201 \tabularnewline
15 & -0.080003 & -0.6788 & 0.249707 \tabularnewline
16 & -0.002976 & -0.0253 & 0.489961 \tabularnewline
17 & -0.01631 & -0.1384 & 0.445157 \tabularnewline
18 & -0.108116 & -0.9174 & 0.180999 \tabularnewline
19 & -0.233015 & -1.9772 & 0.025924 \tabularnewline
20 & -0.095947 & -0.8141 & 0.209126 \tabularnewline
21 & -0.116934 & -0.9922 & 0.162208 \tabularnewline
22 & 0.003066 & 0.026 & 0.48966 \tabularnewline
23 & 0.016094 & 0.1366 & 0.445878 \tabularnewline
24 & -0.064247 & -0.5452 & 0.293666 \tabularnewline
25 & 0.015339 & 0.1302 & 0.448404 \tabularnewline
26 & 0.033835 & 0.2871 & 0.387431 \tabularnewline
27 & 0.013349 & 0.1133 & 0.455065 \tabularnewline
28 & -0.047714 & -0.4049 & 0.343389 \tabularnewline
29 & 0.063314 & 0.5372 & 0.296379 \tabularnewline
30 & 0.096073 & 0.8152 & 0.20882 \tabularnewline
31 & 0.024929 & 0.2115 & 0.416535 \tabularnewline
32 & -0.111712 & -0.9479 & 0.173173 \tabularnewline
33 & -0.076263 & -0.6471 & 0.259808 \tabularnewline
34 & 0.025338 & 0.215 & 0.415187 \tabularnewline
35 & 0.070374 & 0.5971 & 0.276142 \tabularnewline
36 & -0.048177 & -0.4088 & 0.341953 \tabularnewline
37 & 0.115238 & 0.9778 & 0.165717 \tabularnewline
38 & -0.026561 & -0.2254 & 0.411163 \tabularnewline
39 & -0.157455 & -1.336 & 0.092871 \tabularnewline
40 & 0.044155 & 0.3747 & 0.354504 \tabularnewline
41 & 0.016696 & 0.1417 & 0.443868 \tabularnewline
42 & -0.060958 & -0.5172 & 0.303284 \tabularnewline
43 & -0.036721 & -0.3116 & 0.378128 \tabularnewline
44 & -0.032263 & -0.2738 & 0.392525 \tabularnewline
45 & -0.002055 & -0.0174 & 0.493066 \tabularnewline
46 & 0.105499 & 0.8952 & 0.186835 \tabularnewline
47 & -0.073546 & -0.6241 & 0.267281 \tabularnewline
48 & -0.037866 & -0.3213 & 0.374454 \tabularnewline
\hline
\end{tabular}
%Source: https://freestatistics.org/blog/index.php?pk=271916&T=2

[TABLE]
[ROW][C]Partial Autocorrelation Function[/C][/ROW]
[ROW][C]Time lag k[/C][C]PACF(k)[/C][C]T-STAT[/C][C]P-value[/C][/ROW]
[ROW][C]1[/C][C]0.944299[/C][C]8.0126[/C][C]0[/C][/ROW]
[ROW][C]2[/C][C]-0.326679[/C][C]-2.772[/C][C]0.003544[/C][/ROW]
[ROW][C]3[/C][C]-0.070519[/C][C]-0.5984[/C][C]0.275736[/C][/ROW]
[ROW][C]4[/C][C]0.01658[/C][C]0.1407[/C][C]0.444254[/C][/ROW]
[ROW][C]5[/C][C]-0.124702[/C][C]-1.0581[/C][C]0.146767[/C][/ROW]
[ROW][C]6[/C][C]0.026806[/C][C]0.2275[/C][C]0.410358[/C][/ROW]
[ROW][C]7[/C][C]0.000511[/C][C]0.0043[/C][C]0.498276[/C][/ROW]
[ROW][C]8[/C][C]-0.098461[/C][C]-0.8355[/C][C]0.203108[/C][/ROW]
[ROW][C]9[/C][C]0.225689[/C][C]1.915[/C][C]0.02973[/C][/ROW]
[ROW][C]10[/C][C]-0.037366[/C][C]-0.3171[/C][C]0.376059[/C][/ROW]
[ROW][C]11[/C][C]-0.054671[/C][C]-0.4639[/C][C]0.32206[/C][/ROW]
[ROW][C]12[/C][C]-0.167805[/C][C]-1.4239[/C][C]0.079401[/C][/ROW]
[ROW][C]13[/C][C]0.213057[/C][C]1.8078[/C][C]0.037404[/C][/ROW]
[ROW][C]14[/C][C]0.008248[/C][C]0.07[/C][C]0.472201[/C][/ROW]
[ROW][C]15[/C][C]-0.080003[/C][C]-0.6788[/C][C]0.249707[/C][/ROW]
[ROW][C]16[/C][C]-0.002976[/C][C]-0.0253[/C][C]0.489961[/C][/ROW]
[ROW][C]17[/C][C]-0.01631[/C][C]-0.1384[/C][C]0.445157[/C][/ROW]
[ROW][C]18[/C][C]-0.108116[/C][C]-0.9174[/C][C]0.180999[/C][/ROW]
[ROW][C]19[/C][C]-0.233015[/C][C]-1.9772[/C][C]0.025924[/C][/ROW]
[ROW][C]20[/C][C]-0.095947[/C][C]-0.8141[/C][C]0.209126[/C][/ROW]
[ROW][C]21[/C][C]-0.116934[/C][C]-0.9922[/C][C]0.162208[/C][/ROW]
[ROW][C]22[/C][C]0.003066[/C][C]0.026[/C][C]0.48966[/C][/ROW]
[ROW][C]23[/C][C]0.016094[/C][C]0.1366[/C][C]0.445878[/C][/ROW]
[ROW][C]24[/C][C]-0.064247[/C][C]-0.5452[/C][C]0.293666[/C][/ROW]
[ROW][C]25[/C][C]0.015339[/C][C]0.1302[/C][C]0.448404[/C][/ROW]
[ROW][C]26[/C][C]0.033835[/C][C]0.2871[/C][C]0.387431[/C][/ROW]
[ROW][C]27[/C][C]0.013349[/C][C]0.1133[/C][C]0.455065[/C][/ROW]
[ROW][C]28[/C][C]-0.047714[/C][C]-0.4049[/C][C]0.343389[/C][/ROW]
[ROW][C]29[/C][C]0.063314[/C][C]0.5372[/C][C]0.296379[/C][/ROW]
[ROW][C]30[/C][C]0.096073[/C][C]0.8152[/C][C]0.20882[/C][/ROW]
[ROW][C]31[/C][C]0.024929[/C][C]0.2115[/C][C]0.416535[/C][/ROW]
[ROW][C]32[/C][C]-0.111712[/C][C]-0.9479[/C][C]0.173173[/C][/ROW]
[ROW][C]33[/C][C]-0.076263[/C][C]-0.6471[/C][C]0.259808[/C][/ROW]
[ROW][C]34[/C][C]0.025338[/C][C]0.215[/C][C]0.415187[/C][/ROW]
[ROW][C]35[/C][C]0.070374[/C][C]0.5971[/C][C]0.276142[/C][/ROW]
[ROW][C]36[/C][C]-0.048177[/C][C]-0.4088[/C][C]0.341953[/C][/ROW]
[ROW][C]37[/C][C]0.115238[/C][C]0.9778[/C][C]0.165717[/C][/ROW]
[ROW][C]38[/C][C]-0.026561[/C][C]-0.2254[/C][C]0.411163[/C][/ROW]
[ROW][C]39[/C][C]-0.157455[/C][C]-1.336[/C][C]0.092871[/C][/ROW]
[ROW][C]40[/C][C]0.044155[/C][C]0.3747[/C][C]0.354504[/C][/ROW]
[ROW][C]41[/C][C]0.016696[/C][C]0.1417[/C][C]0.443868[/C][/ROW]
[ROW][C]42[/C][C]-0.060958[/C][C]-0.5172[/C][C]0.303284[/C][/ROW]
[ROW][C]43[/C][C]-0.036721[/C][C]-0.3116[/C][C]0.378128[/C][/ROW]
[ROW][C]44[/C][C]-0.032263[/C][C]-0.2738[/C][C]0.392525[/C][/ROW]
[ROW][C]45[/C][C]-0.002055[/C][C]-0.0174[/C][C]0.493066[/C][/ROW]
[ROW][C]46[/C][C]0.105499[/C][C]0.8952[/C][C]0.186835[/C][/ROW]
[ROW][C]47[/C][C]-0.073546[/C][C]-0.6241[/C][C]0.267281[/C][/ROW]
[ROW][C]48[/C][C]-0.037866[/C][C]-0.3213[/C][C]0.374454[/C][/ROW]
[/TABLE]
Source: https://freestatistics.org/blog/index.php?pk=271916&T=2

Globally Unique Identifier (entire table): ba.freestatistics.org/blog/index.php?pk=271916&T=2

As an alternative you can also use a QR Code:  

The GUIDs for individual cells are displayed in the table below:

Partial Autocorrelation Function
Time lag kPACF(k)T-STATP-value
10.9442998.01260
2-0.326679-2.7720.003544
3-0.070519-0.59840.275736
40.016580.14070.444254
5-0.124702-1.05810.146767
60.0268060.22750.410358
70.0005110.00430.498276
8-0.098461-0.83550.203108
90.2256891.9150.02973
10-0.037366-0.31710.376059
11-0.054671-0.46390.32206
12-0.167805-1.42390.079401
130.2130571.80780.037404
140.0082480.070.472201
15-0.080003-0.67880.249707
16-0.002976-0.02530.489961
17-0.01631-0.13840.445157
18-0.108116-0.91740.180999
19-0.233015-1.97720.025924
20-0.095947-0.81410.209126
21-0.116934-0.99220.162208
220.0030660.0260.48966
230.0160940.13660.445878
24-0.064247-0.54520.293666
250.0153390.13020.448404
260.0338350.28710.387431
270.0133490.11330.455065
28-0.047714-0.40490.343389
290.0633140.53720.296379
300.0960730.81520.20882
310.0249290.21150.416535
32-0.111712-0.94790.173173
33-0.076263-0.64710.259808
340.0253380.2150.415187
350.0703740.59710.276142
36-0.048177-0.40880.341953
370.1152380.97780.165717
38-0.026561-0.22540.411163
39-0.157455-1.3360.092871
400.0441550.37470.354504
410.0166960.14170.443868
42-0.060958-0.51720.303284
43-0.036721-0.31160.378128
44-0.032263-0.27380.392525
45-0.002055-0.01740.493066
460.1054990.89520.186835
47-0.073546-0.62410.267281
48-0.037866-0.32130.374454


Parameters (Session):
par1 = 48 ; par2 = 1 ; par3 = 0 ; par4 = 0 ; par5 = 12 ; par6 = White Noise ; par7 = 0.95 ;
Parameters (R input):
par1 = 48 ; par2 = 1 ; par3 = 0 ; par4 = 0 ; par5 = 12 ; par6 = White Noise ; par7 = 0.95 ; par8 = ;
R code (references can be found in the software module):
if (par1 == 'Default') {
par1 = 10*log10(length(x))
} else {
par1 <- as.numeric(par1)
}
par2 <- as.numeric(par2)
par3 <- as.numeric(par3)
par4 <- as.numeric(par4)
par5 <- as.numeric(par5)
if (par6 == 'White Noise') par6 <- 'white' else par6 <- 'ma'
par7 <- as.numeric(par7)
if (par8 != '') par8 <- as.numeric(par8)
ox <- x
if (par8 == '') {
if (par2 == 0) {
x <- log(x)
} else {
x <- (x ^ par2 - 1) / par2
}
} else {
x <- log(x,base=par8)
}
if (par3 > 0) x <- diff(x,lag=1,difference=par3)
if (par4 > 0) x <- diff(x,lag=par5,difference=par4)
bitmap(file='picts.png')
op <- par(mfrow=c(2,1))
plot(ox,type='l',main='Original Time Series',xlab='time',ylab='value')
if (par8=='') {
mytitle <- paste('Working Time Series (lambda=',par2,', d=',par3,', D=',par4,')',sep='')
mysub <- paste('(lambda=',par2,', d=',par3,', D=',par4,', CI=', par7, ', CI type=',par6,')',sep='')
} else {
mytitle <- paste('Working Time Series (base=',par8,', d=',par3,', D=',par4,')',sep='')
mysub <- paste('(base=',par8,', d=',par3,', D=',par4,', CI=', par7, ', CI type=',par6,')',sep='')
}
plot(x,type='l', main=mytitle,xlab='time',ylab='value')
par(op)
dev.off()
bitmap(file='pic1.png')
racf <- acf(x, par1, main='Autocorrelation', xlab='time lag', ylab='ACF', ci.type=par6, ci=par7, sub=mysub)
dev.off()
bitmap(file='pic2.png')
rpacf <- pacf(x,par1,main='Partial Autocorrelation',xlab='lags',ylab='PACF',sub=mysub)
dev.off()
(myacf <- c(racf$acf))
(mypacf <- c(rpacf$acf))
lengthx <- length(x)
sqrtn <- sqrt(lengthx)
load(file='createtable')
a<-table.start()
a<-table.row.start(a)
a<-table.element(a,'Autocorrelation Function',4,TRUE)
a<-table.row.end(a)
a<-table.row.start(a)
a<-table.element(a,'Time lag k',header=TRUE)
a<-table.element(a,hyperlink('basics.htm','ACF(k)','click here for more information about the Autocorrelation Function'),header=TRUE)
a<-table.element(a,'T-STAT',header=TRUE)
a<-table.element(a,'P-value',header=TRUE)
a<-table.row.end(a)
for (i in 2:(par1+1)) {
a<-table.row.start(a)
a<-table.element(a,i-1,header=TRUE)
a<-table.element(a,round(myacf[i],6))
mytstat <- myacf[i]*sqrtn
a<-table.element(a,round(mytstat,4))
a<-table.element(a,round(1-pt(abs(mytstat),lengthx),6))
a<-table.row.end(a)
}
a<-table.end(a)
table.save(a,file='mytable.tab')
a<-table.start()
a<-table.row.start(a)
a<-table.element(a,'Partial Autocorrelation Function',4,TRUE)
a<-table.row.end(a)
a<-table.row.start(a)
a<-table.element(a,'Time lag k',header=TRUE)
a<-table.element(a,hyperlink('basics.htm','PACF(k)','click here for more information about the Partial Autocorrelation Function'),header=TRUE)
a<-table.element(a,'T-STAT',header=TRUE)
a<-table.element(a,'P-value',header=TRUE)
a<-table.row.end(a)
for (i in 1:par1) {
a<-table.row.start(a)
a<-table.element(a,i,header=TRUE)
a<-table.element(a,round(mypacf[i],6))
mytstat <- mypacf[i]*sqrtn
a<-table.element(a,round(mytstat,4))
a<-table.element(a,round(1-pt(abs(mytstat),lengthx),6))
a<-table.row.end(a)
}
a<-table.end(a)
table.save(a,file='mytable1.tab')