Free Statistics

of Irreproducible Research!

Author's title

Author*Unverified author*
R Software Modulerwasp_centraltendency.wasp
Title produced by softwareCentral Tendency
Date of computationWed, 25 Feb 2015 17:24:33 +0000
Cite this page as followsStatistical Computations at FreeStatistics.org, Office for Research Development and Education, URL https://freestatistics.org/blog/index.php?v=date/2015/Feb/25/t1424885163bqb8014o7yd684t.htm/, Retrieved Sun, 19 May 2024 02:15:14 +0000
Statistical Computations at FreeStatistics.org, Office for Research Development and Education, URL https://freestatistics.org/blog/index.php?pk=277506, Retrieved Sun, 19 May 2024 02:15:14 +0000
QR Codes:

Original text written by user:
IsPrivate?No (this computation is public)
User-defined keywords
Estimated Impact142
Family? (F = Feedback message, R = changed R code, M = changed R Module, P = changed Parameters, D = changed Data)
-       [Central Tendency] [Opgave 5 oefening 2] [2015-02-25 17:24:33] [2dcc5595e1714d1f573b61116e4d8205] [Current]
Feedback Forum

Post a new message
Dataseries X:
790
766
1040
949
758
1023
921
775
907
835
871
836
789
811
996
778
603
990
735
800
706
766
870
647
726
784
884
696
893
674
703
799
793
799
1022
758
1021
944
915
864
1022
891
1087
822
890
1092
967
833
1104
1063
1103
1039
1185
1047
1155
878
879
1133
920
943
938
900
781
1040
792
653
866
679
799
760
697
750


Summary of computational transaction
Raw Inputview raw input (R code)
Raw Outputview raw output of R engine
Computing time1 seconds
R Server'Gertrude Mary Cox' @ cox.wessa.net

\begin{tabular}{lllllllll}
\hline
Summary of computational transaction \tabularnewline
Raw Input & view raw input (R code)  \tabularnewline
Raw Output & view raw output of R engine  \tabularnewline
Computing time & 1 seconds \tabularnewline
R Server & 'Gertrude Mary Cox' @ cox.wessa.net \tabularnewline
\hline
\end{tabular}
%Source: https://freestatistics.org/blog/index.php?pk=277506&T=0

[TABLE]
[ROW][C]Summary of computational transaction[/C][/ROW]
[ROW][C]Raw Input[/C][C]view raw input (R code) [/C][/ROW]
[ROW][C]Raw Output[/C][C]view raw output of R engine [/C][/ROW]
[ROW][C]Computing time[/C][C]1 seconds[/C][/ROW]
[ROW][C]R Server[/C][C]'Gertrude Mary Cox' @ cox.wessa.net[/C][/ROW]
[/TABLE]
Source: https://freestatistics.org/blog/index.php?pk=277506&T=0

Globally Unique Identifier (entire table): ba.freestatistics.org/blog/index.php?pk=277506&T=0

As an alternative you can also use a QR Code:  

The GUIDs for individual cells are displayed in the table below:

Summary of computational transaction
Raw Inputview raw input (R code)
Raw Outputview raw output of R engine
Computing time1 seconds
R Server'Gertrude Mary Cox' @ cox.wessa.net


Central Tendency - Ungrouped Data
MeasureValueS.E.Value/S.E.
Arithmetic Mean874.23611111111116.136697126524754.1768928459396
Geometric Mean863.77875137596
Harmonic Mean853.465879557785
Quadratic Mean884.746675922298
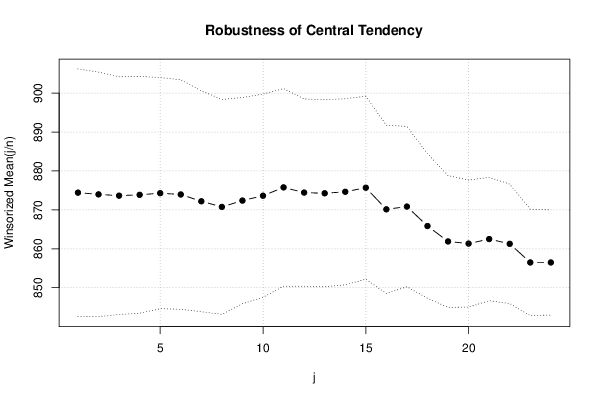
Winsorized Mean ( 1 / 24 )874.43055555555615.894357646771355.0151553770518
Winsorized Mean ( 2 / 24 )873.98611111111115.714123670414855.6178715047647
Winsorized Mean ( 3 / 24 )873.65277777777815.278135488058757.1832065804507
Winsorized Mean ( 4 / 24 )873.87515.215727509854657.4323507984765
Winsorized Mean ( 5 / 24 )874.29166666666714.849445771155458.8770571063973
Winsorized Mean ( 6 / 24 )873.95833333333314.749956068739159.2515889037521
Winsorized Mean ( 7 / 24 )872.20833333333314.193153057058761.4527532977991
Winsorized Mean ( 8 / 24 )870.76388888888913.808967922772463.0578544145148
Winsorized Mean ( 9 / 24 )872.38888888888913.247413240802865.8535272532968
Winsorized Mean ( 10 / 24 )873.63888888888913.056640566907366.9114604489587
Winsorized Mean ( 11 / 24 )875.77777777777812.697719876863468.9712630512143
Winsorized Mean ( 12 / 24 )874.44444444444412.040488049096872.6253322023805
Winsorized Mean ( 13 / 24 )874.26388888888912.009157842557672.7997666739548
Winsorized Mean ( 14 / 24 )874.65277777777811.956381990964473.1536327995177
Winsorized Mean ( 15 / 24 )875.69444444444411.753577001715174.5045056765836
Winsorized Mean ( 16 / 24 )870.13888888888910.813349310010180.468952212927
Winsorized Mean ( 17 / 24 )870.84722222222210.298264354618984.5625235704535
Winsorized Mean ( 18 / 24 )865.8472222222229.2882811833224893.2193163765206
Winsorized Mean ( 19 / 24 )861.8888888888898.47322847355625101.719066301437
Winsorized Mean ( 20 / 24 )861.3333333333338.16194651367055105.530381985556
Winsorized Mean ( 21 / 24 )862.57.9277350350275108.795260713076
Winsorized Mean ( 22 / 24 )861.2777777777787.67090672255219112.278484008371
Winsorized Mean ( 23 / 24 )856.4861111111116.8424018909122125.173312641671
Winsorized Mean ( 24 / 24 )856.4861111111116.75400516008735126.811586726717
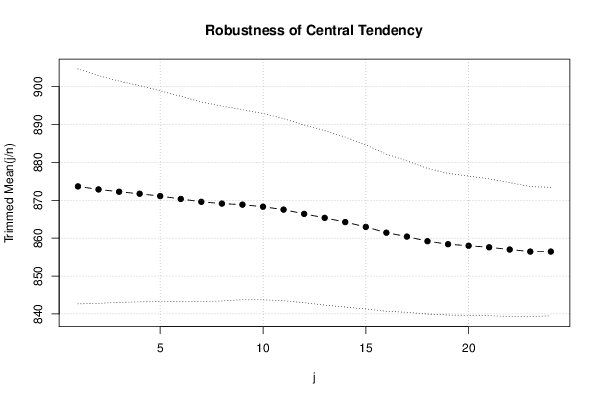
Trimmed Mean ( 1 / 24 )873.67142857142915.503712524450956.352401219615
Trimmed Mean ( 2 / 24 )872.86764705882415.038681532474558.0415008572362
Trimmed Mean ( 3 / 24 )872.25757575757614.599219422344259.7468638920912
Trimmed Mean ( 4 / 24 )871.73437514.272455889468261.078092078271
Trimmed Mean ( 5 / 24 )871.11290322580613.899581404292362.671880388916
Trimmed Mean ( 6 / 24 )870.3513.562844413601864.1716422793398
Trimmed Mean ( 7 / 24 )869.60344827586213.17853898156265.9863319820594
Trimmed Mean ( 8 / 24 )869.12512.855264788879667.6084868163768
Trimmed Mean ( 9 / 24 )868.85185185185212.549563719546169.2336300503102
Trimmed Mean ( 10 / 24 )868.30769230769212.297025921006970.6111947624973
Trimmed Mean ( 11 / 24 )867.5412.016118766227472.1980214142288
Trimmed Mean ( 12 / 24 )866.41666666666711.731210770699373.8556900563655
Trimmed Mean ( 13 / 24 )865.36956521739111.508256170785375.195542432763
Trimmed Mean ( 14 / 24 )864.2511.21654645496277.0513458371733
Trimmed Mean ( 15 / 24 )862.9761904761910.83647259591479.6362638153658
Trimmed Mean ( 16 / 24 )861.4510.369577668624783.0747430154741
Trimmed Mean ( 17 / 24 )860.4210526315799.9960612142661586.0760087586904
Trimmed Mean ( 18 / 24 )859.1944444444449.6093389961829689.4124397927615
Trimmed Mean ( 19 / 24 )858.4117647058829.3511528688676691.7974261295364
Trimmed Mean ( 20 / 24 )8589.1969928465425593.2913632005868
Trimmed Mean ( 21 / 24 )857.69.0357654612802194.9117154130396
Trimmed Mean ( 22 / 24 )8578.8358037875129796.9917418504855
Trimmed Mean ( 23 / 24 )856.4615384615388.5901966968132299.7022034174453
Trimmed Mean ( 24 / 24 )856.4583333333338.47459527627239101.061856691999
Median868
Midrange894
Midmean - Weighted Average at Xnp856.918918918919
Midmean - Weighted Average at X(n+1)p859.194444444444
Midmean - Empirical Distribution Function856.918918918919
Midmean - Empirical Distribution Function - Averaging859.194444444444
Midmean - Empirical Distribution Function - Interpolation859.194444444444
Midmean - Closest Observation856.918918918919
Midmean - True Basic - Statistics Graphics Toolkit859.194444444444
Midmean - MS Excel (old versions)860.421052631579
Number of observations72

\begin{tabular}{lllllllll}
\hline
Central Tendency - Ungrouped Data \tabularnewline
Measure & Value & S.E. & Value/S.E. \tabularnewline
Arithmetic Mean & 874.236111111111 & 16.1366971265247 & 54.1768928459396 \tabularnewline
Geometric Mean & 863.77875137596 &  &  \tabularnewline
Harmonic Mean & 853.465879557785 &  &  \tabularnewline
Quadratic Mean & 884.746675922298 &  &  \tabularnewline
Winsorized Mean ( 1 / 24 ) & 874.430555555556 & 15.8943576467713 & 55.0151553770518 \tabularnewline
Winsorized Mean ( 2 / 24 ) & 873.986111111111 & 15.7141236704148 & 55.6178715047647 \tabularnewline
Winsorized Mean ( 3 / 24 ) & 873.652777777778 & 15.2781354880587 & 57.1832065804507 \tabularnewline
Winsorized Mean ( 4 / 24 ) & 873.875 & 15.2157275098546 & 57.4323507984765 \tabularnewline
Winsorized Mean ( 5 / 24 ) & 874.291666666667 & 14.8494457711554 & 58.8770571063973 \tabularnewline
Winsorized Mean ( 6 / 24 ) & 873.958333333333 & 14.7499560687391 & 59.2515889037521 \tabularnewline
Winsorized Mean ( 7 / 24 ) & 872.208333333333 & 14.1931530570587 & 61.4527532977991 \tabularnewline
Winsorized Mean ( 8 / 24 ) & 870.763888888889 & 13.8089679227724 & 63.0578544145148 \tabularnewline
Winsorized Mean ( 9 / 24 ) & 872.388888888889 & 13.2474132408028 & 65.8535272532968 \tabularnewline
Winsorized Mean ( 10 / 24 ) & 873.638888888889 & 13.0566405669073 & 66.9114604489587 \tabularnewline
Winsorized Mean ( 11 / 24 ) & 875.777777777778 & 12.6977198768634 & 68.9712630512143 \tabularnewline
Winsorized Mean ( 12 / 24 ) & 874.444444444444 & 12.0404880490968 & 72.6253322023805 \tabularnewline
Winsorized Mean ( 13 / 24 ) & 874.263888888889 & 12.0091578425576 & 72.7997666739548 \tabularnewline
Winsorized Mean ( 14 / 24 ) & 874.652777777778 & 11.9563819909644 & 73.1536327995177 \tabularnewline
Winsorized Mean ( 15 / 24 ) & 875.694444444444 & 11.7535770017151 & 74.5045056765836 \tabularnewline
Winsorized Mean ( 16 / 24 ) & 870.138888888889 & 10.8133493100101 & 80.468952212927 \tabularnewline
Winsorized Mean ( 17 / 24 ) & 870.847222222222 & 10.2982643546189 & 84.5625235704535 \tabularnewline
Winsorized Mean ( 18 / 24 ) & 865.847222222222 & 9.28828118332248 & 93.2193163765206 \tabularnewline
Winsorized Mean ( 19 / 24 ) & 861.888888888889 & 8.47322847355625 & 101.719066301437 \tabularnewline
Winsorized Mean ( 20 / 24 ) & 861.333333333333 & 8.16194651367055 & 105.530381985556 \tabularnewline
Winsorized Mean ( 21 / 24 ) & 862.5 & 7.9277350350275 & 108.795260713076 \tabularnewline
Winsorized Mean ( 22 / 24 ) & 861.277777777778 & 7.67090672255219 & 112.278484008371 \tabularnewline
Winsorized Mean ( 23 / 24 ) & 856.486111111111 & 6.8424018909122 & 125.173312641671 \tabularnewline
Winsorized Mean ( 24 / 24 ) & 856.486111111111 & 6.75400516008735 & 126.811586726717 \tabularnewline
Trimmed Mean ( 1 / 24 ) & 873.671428571429 & 15.5037125244509 & 56.352401219615 \tabularnewline
Trimmed Mean ( 2 / 24 ) & 872.867647058824 & 15.0386815324745 & 58.0415008572362 \tabularnewline
Trimmed Mean ( 3 / 24 ) & 872.257575757576 & 14.5992194223442 & 59.7468638920912 \tabularnewline
Trimmed Mean ( 4 / 24 ) & 871.734375 & 14.2724558894682 & 61.078092078271 \tabularnewline
Trimmed Mean ( 5 / 24 ) & 871.112903225806 & 13.8995814042923 & 62.671880388916 \tabularnewline
Trimmed Mean ( 6 / 24 ) & 870.35 & 13.5628444136018 & 64.1716422793398 \tabularnewline
Trimmed Mean ( 7 / 24 ) & 869.603448275862 & 13.178538981562 & 65.9863319820594 \tabularnewline
Trimmed Mean ( 8 / 24 ) & 869.125 & 12.8552647888796 & 67.6084868163768 \tabularnewline
Trimmed Mean ( 9 / 24 ) & 868.851851851852 & 12.5495637195461 & 69.2336300503102 \tabularnewline
Trimmed Mean ( 10 / 24 ) & 868.307692307692 & 12.2970259210069 & 70.6111947624973 \tabularnewline
Trimmed Mean ( 11 / 24 ) & 867.54 & 12.0161187662274 & 72.1980214142288 \tabularnewline
Trimmed Mean ( 12 / 24 ) & 866.416666666667 & 11.7312107706993 & 73.8556900563655 \tabularnewline
Trimmed Mean ( 13 / 24 ) & 865.369565217391 & 11.5082561707853 & 75.195542432763 \tabularnewline
Trimmed Mean ( 14 / 24 ) & 864.25 & 11.216546454962 & 77.0513458371733 \tabularnewline
Trimmed Mean ( 15 / 24 ) & 862.97619047619 & 10.836472595914 & 79.6362638153658 \tabularnewline
Trimmed Mean ( 16 / 24 ) & 861.45 & 10.3695776686247 & 83.0747430154741 \tabularnewline
Trimmed Mean ( 17 / 24 ) & 860.421052631579 & 9.99606121426615 & 86.0760087586904 \tabularnewline
Trimmed Mean ( 18 / 24 ) & 859.194444444444 & 9.60933899618296 & 89.4124397927615 \tabularnewline
Trimmed Mean ( 19 / 24 ) & 858.411764705882 & 9.35115286886766 & 91.7974261295364 \tabularnewline
Trimmed Mean ( 20 / 24 ) & 858 & 9.19699284654255 & 93.2913632005868 \tabularnewline
Trimmed Mean ( 21 / 24 ) & 857.6 & 9.03576546128021 & 94.9117154130396 \tabularnewline
Trimmed Mean ( 22 / 24 ) & 857 & 8.83580378751297 & 96.9917418504855 \tabularnewline
Trimmed Mean ( 23 / 24 ) & 856.461538461538 & 8.59019669681322 & 99.7022034174453 \tabularnewline
Trimmed Mean ( 24 / 24 ) & 856.458333333333 & 8.47459527627239 & 101.061856691999 \tabularnewline
Median & 868 &  &  \tabularnewline
Midrange & 894 &  &  \tabularnewline
Midmean - Weighted Average at Xnp & 856.918918918919 &  &  \tabularnewline
Midmean - Weighted Average at X(n+1)p & 859.194444444444 &  &  \tabularnewline
Midmean - Empirical Distribution Function & 856.918918918919 &  &  \tabularnewline
Midmean - Empirical Distribution Function - Averaging & 859.194444444444 &  &  \tabularnewline
Midmean - Empirical Distribution Function - Interpolation & 859.194444444444 &  &  \tabularnewline
Midmean - Closest Observation & 856.918918918919 &  &  \tabularnewline
Midmean - True Basic - Statistics Graphics Toolkit & 859.194444444444 &  &  \tabularnewline
Midmean - MS Excel (old versions) & 860.421052631579 &  &  \tabularnewline
Number of observations & 72 &  &  \tabularnewline
\hline
\end{tabular}
%Source: https://freestatistics.org/blog/index.php?pk=277506&T=1

[TABLE]
[ROW][C]Central Tendency - Ungrouped Data[/C][/ROW]
[ROW][C]Measure[/C][C]Value[/C][C]S.E.[/C][C]Value/S.E.[/C][/ROW]
[ROW][C]Arithmetic Mean[/C][C]874.236111111111[/C][C]16.1366971265247[/C][C]54.1768928459396[/C][/ROW]
[ROW][C]Geometric Mean[/C][C]863.77875137596[/C][C][/C][C][/C][/ROW]
[ROW][C]Harmonic Mean[/C][C]853.465879557785[/C][C][/C][C][/C][/ROW]
[ROW][C]Quadratic Mean[/C][C]884.746675922298[/C][C][/C][C][/C][/ROW]
[ROW][C]Winsorized Mean ( 1 / 24 )[/C][C]874.430555555556[/C][C]15.8943576467713[/C][C]55.0151553770518[/C][/ROW]
[ROW][C]Winsorized Mean ( 2 / 24 )[/C][C]873.986111111111[/C][C]15.7141236704148[/C][C]55.6178715047647[/C][/ROW]
[ROW][C]Winsorized Mean ( 3 / 24 )[/C][C]873.652777777778[/C][C]15.2781354880587[/C][C]57.1832065804507[/C][/ROW]
[ROW][C]Winsorized Mean ( 4 / 24 )[/C][C]873.875[/C][C]15.2157275098546[/C][C]57.4323507984765[/C][/ROW]
[ROW][C]Winsorized Mean ( 5 / 24 )[/C][C]874.291666666667[/C][C]14.8494457711554[/C][C]58.8770571063973[/C][/ROW]
[ROW][C]Winsorized Mean ( 6 / 24 )[/C][C]873.958333333333[/C][C]14.7499560687391[/C][C]59.2515889037521[/C][/ROW]
[ROW][C]Winsorized Mean ( 7 / 24 )[/C][C]872.208333333333[/C][C]14.1931530570587[/C][C]61.4527532977991[/C][/ROW]
[ROW][C]Winsorized Mean ( 8 / 24 )[/C][C]870.763888888889[/C][C]13.8089679227724[/C][C]63.0578544145148[/C][/ROW]
[ROW][C]Winsorized Mean ( 9 / 24 )[/C][C]872.388888888889[/C][C]13.2474132408028[/C][C]65.8535272532968[/C][/ROW]
[ROW][C]Winsorized Mean ( 10 / 24 )[/C][C]873.638888888889[/C][C]13.0566405669073[/C][C]66.9114604489587[/C][/ROW]
[ROW][C]Winsorized Mean ( 11 / 24 )[/C][C]875.777777777778[/C][C]12.6977198768634[/C][C]68.9712630512143[/C][/ROW]
[ROW][C]Winsorized Mean ( 12 / 24 )[/C][C]874.444444444444[/C][C]12.0404880490968[/C][C]72.6253322023805[/C][/ROW]
[ROW][C]Winsorized Mean ( 13 / 24 )[/C][C]874.263888888889[/C][C]12.0091578425576[/C][C]72.7997666739548[/C][/ROW]
[ROW][C]Winsorized Mean ( 14 / 24 )[/C][C]874.652777777778[/C][C]11.9563819909644[/C][C]73.1536327995177[/C][/ROW]
[ROW][C]Winsorized Mean ( 15 / 24 )[/C][C]875.694444444444[/C][C]11.7535770017151[/C][C]74.5045056765836[/C][/ROW]
[ROW][C]Winsorized Mean ( 16 / 24 )[/C][C]870.138888888889[/C][C]10.8133493100101[/C][C]80.468952212927[/C][/ROW]
[ROW][C]Winsorized Mean ( 17 / 24 )[/C][C]870.847222222222[/C][C]10.2982643546189[/C][C]84.5625235704535[/C][/ROW]
[ROW][C]Winsorized Mean ( 18 / 24 )[/C][C]865.847222222222[/C][C]9.28828118332248[/C][C]93.2193163765206[/C][/ROW]
[ROW][C]Winsorized Mean ( 19 / 24 )[/C][C]861.888888888889[/C][C]8.47322847355625[/C][C]101.719066301437[/C][/ROW]
[ROW][C]Winsorized Mean ( 20 / 24 )[/C][C]861.333333333333[/C][C]8.16194651367055[/C][C]105.530381985556[/C][/ROW]
[ROW][C]Winsorized Mean ( 21 / 24 )[/C][C]862.5[/C][C]7.9277350350275[/C][C]108.795260713076[/C][/ROW]
[ROW][C]Winsorized Mean ( 22 / 24 )[/C][C]861.277777777778[/C][C]7.67090672255219[/C][C]112.278484008371[/C][/ROW]
[ROW][C]Winsorized Mean ( 23 / 24 )[/C][C]856.486111111111[/C][C]6.8424018909122[/C][C]125.173312641671[/C][/ROW]
[ROW][C]Winsorized Mean ( 24 / 24 )[/C][C]856.486111111111[/C][C]6.75400516008735[/C][C]126.811586726717[/C][/ROW]
[ROW][C]Trimmed Mean ( 1 / 24 )[/C][C]873.671428571429[/C][C]15.5037125244509[/C][C]56.352401219615[/C][/ROW]
[ROW][C]Trimmed Mean ( 2 / 24 )[/C][C]872.867647058824[/C][C]15.0386815324745[/C][C]58.0415008572362[/C][/ROW]
[ROW][C]Trimmed Mean ( 3 / 24 )[/C][C]872.257575757576[/C][C]14.5992194223442[/C][C]59.7468638920912[/C][/ROW]
[ROW][C]Trimmed Mean ( 4 / 24 )[/C][C]871.734375[/C][C]14.2724558894682[/C][C]61.078092078271[/C][/ROW]
[ROW][C]Trimmed Mean ( 5 / 24 )[/C][C]871.112903225806[/C][C]13.8995814042923[/C][C]62.671880388916[/C][/ROW]
[ROW][C]Trimmed Mean ( 6 / 24 )[/C][C]870.35[/C][C]13.5628444136018[/C][C]64.1716422793398[/C][/ROW]
[ROW][C]Trimmed Mean ( 7 / 24 )[/C][C]869.603448275862[/C][C]13.178538981562[/C][C]65.9863319820594[/C][/ROW]
[ROW][C]Trimmed Mean ( 8 / 24 )[/C][C]869.125[/C][C]12.8552647888796[/C][C]67.6084868163768[/C][/ROW]
[ROW][C]Trimmed Mean ( 9 / 24 )[/C][C]868.851851851852[/C][C]12.5495637195461[/C][C]69.2336300503102[/C][/ROW]
[ROW][C]Trimmed Mean ( 10 / 24 )[/C][C]868.307692307692[/C][C]12.2970259210069[/C][C]70.6111947624973[/C][/ROW]
[ROW][C]Trimmed Mean ( 11 / 24 )[/C][C]867.54[/C][C]12.0161187662274[/C][C]72.1980214142288[/C][/ROW]
[ROW][C]Trimmed Mean ( 12 / 24 )[/C][C]866.416666666667[/C][C]11.7312107706993[/C][C]73.8556900563655[/C][/ROW]
[ROW][C]Trimmed Mean ( 13 / 24 )[/C][C]865.369565217391[/C][C]11.5082561707853[/C][C]75.195542432763[/C][/ROW]
[ROW][C]Trimmed Mean ( 14 / 24 )[/C][C]864.25[/C][C]11.216546454962[/C][C]77.0513458371733[/C][/ROW]
[ROW][C]Trimmed Mean ( 15 / 24 )[/C][C]862.97619047619[/C][C]10.836472595914[/C][C]79.6362638153658[/C][/ROW]
[ROW][C]Trimmed Mean ( 16 / 24 )[/C][C]861.45[/C][C]10.3695776686247[/C][C]83.0747430154741[/C][/ROW]
[ROW][C]Trimmed Mean ( 17 / 24 )[/C][C]860.421052631579[/C][C]9.99606121426615[/C][C]86.0760087586904[/C][/ROW]
[ROW][C]Trimmed Mean ( 18 / 24 )[/C][C]859.194444444444[/C][C]9.60933899618296[/C][C]89.4124397927615[/C][/ROW]
[ROW][C]Trimmed Mean ( 19 / 24 )[/C][C]858.411764705882[/C][C]9.35115286886766[/C][C]91.7974261295364[/C][/ROW]
[ROW][C]Trimmed Mean ( 20 / 24 )[/C][C]858[/C][C]9.19699284654255[/C][C]93.2913632005868[/C][/ROW]
[ROW][C]Trimmed Mean ( 21 / 24 )[/C][C]857.6[/C][C]9.03576546128021[/C][C]94.9117154130396[/C][/ROW]
[ROW][C]Trimmed Mean ( 22 / 24 )[/C][C]857[/C][C]8.83580378751297[/C][C]96.9917418504855[/C][/ROW]
[ROW][C]Trimmed Mean ( 23 / 24 )[/C][C]856.461538461538[/C][C]8.59019669681322[/C][C]99.7022034174453[/C][/ROW]
[ROW][C]Trimmed Mean ( 24 / 24 )[/C][C]856.458333333333[/C][C]8.47459527627239[/C][C]101.061856691999[/C][/ROW]
[ROW][C]Median[/C][C]868[/C][C][/C][C][/C][/ROW]
[ROW][C]Midrange[/C][C]894[/C][C][/C][C][/C][/ROW]
[ROW][C]Midmean - Weighted Average at Xnp[/C][C]856.918918918919[/C][C][/C][C][/C][/ROW]
[ROW][C]Midmean - Weighted Average at X(n+1)p[/C][C]859.194444444444[/C][C][/C][C][/C][/ROW]
[ROW][C]Midmean - Empirical Distribution Function[/C][C]856.918918918919[/C][C][/C][C][/C][/ROW]
[ROW][C]Midmean - Empirical Distribution Function - Averaging[/C][C]859.194444444444[/C][C][/C][C][/C][/ROW]
[ROW][C]Midmean - Empirical Distribution Function - Interpolation[/C][C]859.194444444444[/C][C][/C][C][/C][/ROW]
[ROW][C]Midmean - Closest Observation[/C][C]856.918918918919[/C][C][/C][C][/C][/ROW]
[ROW][C]Midmean - True Basic - Statistics Graphics Toolkit[/C][C]859.194444444444[/C][C][/C][C][/C][/ROW]
[ROW][C]Midmean - MS Excel (old versions)[/C][C]860.421052631579[/C][C][/C][C][/C][/ROW]
[ROW][C]Number of observations[/C][C]72[/C][C][/C][C][/C][/ROW]
[/TABLE]
Source: https://freestatistics.org/blog/index.php?pk=277506&T=1

Globally Unique Identifier (entire table): ba.freestatistics.org/blog/index.php?pk=277506&T=1

As an alternative you can also use a QR Code:  

The GUIDs for individual cells are displayed in the table below:

Central Tendency - Ungrouped Data
MeasureValueS.E.Value/S.E.
Arithmetic Mean874.23611111111116.136697126524754.1768928459396
Geometric Mean863.77875137596
Harmonic Mean853.465879557785
Quadratic Mean884.746675922298
Winsorized Mean ( 1 / 24 )874.43055555555615.894357646771355.0151553770518
Winsorized Mean ( 2 / 24 )873.98611111111115.714123670414855.6178715047647
Winsorized Mean ( 3 / 24 )873.65277777777815.278135488058757.1832065804507
Winsorized Mean ( 4 / 24 )873.87515.215727509854657.4323507984765
Winsorized Mean ( 5 / 24 )874.29166666666714.849445771155458.8770571063973
Winsorized Mean ( 6 / 24 )873.95833333333314.749956068739159.2515889037521
Winsorized Mean ( 7 / 24 )872.20833333333314.193153057058761.4527532977991
Winsorized Mean ( 8 / 24 )870.76388888888913.808967922772463.0578544145148
Winsorized Mean ( 9 / 24 )872.38888888888913.247413240802865.8535272532968
Winsorized Mean ( 10 / 24 )873.63888888888913.056640566907366.9114604489587
Winsorized Mean ( 11 / 24 )875.77777777777812.697719876863468.9712630512143
Winsorized Mean ( 12 / 24 )874.44444444444412.040488049096872.6253322023805
Winsorized Mean ( 13 / 24 )874.26388888888912.009157842557672.7997666739548
Winsorized Mean ( 14 / 24 )874.65277777777811.956381990964473.1536327995177
Winsorized Mean ( 15 / 24 )875.69444444444411.753577001715174.5045056765836
Winsorized Mean ( 16 / 24 )870.13888888888910.813349310010180.468952212927
Winsorized Mean ( 17 / 24 )870.84722222222210.298264354618984.5625235704535
Winsorized Mean ( 18 / 24 )865.8472222222229.2882811833224893.2193163765206
Winsorized Mean ( 19 / 24 )861.8888888888898.47322847355625101.719066301437
Winsorized Mean ( 20 / 24 )861.3333333333338.16194651367055105.530381985556
Winsorized Mean ( 21 / 24 )862.57.9277350350275108.795260713076
Winsorized Mean ( 22 / 24 )861.2777777777787.67090672255219112.278484008371
Winsorized Mean ( 23 / 24 )856.4861111111116.8424018909122125.173312641671
Winsorized Mean ( 24 / 24 )856.4861111111116.75400516008735126.811586726717
Trimmed Mean ( 1 / 24 )873.67142857142915.503712524450956.352401219615
Trimmed Mean ( 2 / 24 )872.86764705882415.038681532474558.0415008572362
Trimmed Mean ( 3 / 24 )872.25757575757614.599219422344259.7468638920912
Trimmed Mean ( 4 / 24 )871.73437514.272455889468261.078092078271
Trimmed Mean ( 5 / 24 )871.11290322580613.899581404292362.671880388916
Trimmed Mean ( 6 / 24 )870.3513.562844413601864.1716422793398
Trimmed Mean ( 7 / 24 )869.60344827586213.17853898156265.9863319820594
Trimmed Mean ( 8 / 24 )869.12512.855264788879667.6084868163768
Trimmed Mean ( 9 / 24 )868.85185185185212.549563719546169.2336300503102
Trimmed Mean ( 10 / 24 )868.30769230769212.297025921006970.6111947624973
Trimmed Mean ( 11 / 24 )867.5412.016118766227472.1980214142288
Trimmed Mean ( 12 / 24 )866.41666666666711.731210770699373.8556900563655
Trimmed Mean ( 13 / 24 )865.36956521739111.508256170785375.195542432763
Trimmed Mean ( 14 / 24 )864.2511.21654645496277.0513458371733
Trimmed Mean ( 15 / 24 )862.9761904761910.83647259591479.6362638153658
Trimmed Mean ( 16 / 24 )861.4510.369577668624783.0747430154741
Trimmed Mean ( 17 / 24 )860.4210526315799.9960612142661586.0760087586904
Trimmed Mean ( 18 / 24 )859.1944444444449.6093389961829689.4124397927615
Trimmed Mean ( 19 / 24 )858.4117647058829.3511528688676691.7974261295364
Trimmed Mean ( 20 / 24 )8589.1969928465425593.2913632005868
Trimmed Mean ( 21 / 24 )857.69.0357654612802194.9117154130396
Trimmed Mean ( 22 / 24 )8578.8358037875129796.9917418504855
Trimmed Mean ( 23 / 24 )856.4615384615388.5901966968132299.7022034174453
Trimmed Mean ( 24 / 24 )856.4583333333338.47459527627239101.061856691999
Median868
Midrange894
Midmean - Weighted Average at Xnp856.918918918919
Midmean - Weighted Average at X(n+1)p859.194444444444
Midmean - Empirical Distribution Function856.918918918919
Midmean - Empirical Distribution Function - Averaging859.194444444444
Midmean - Empirical Distribution Function - Interpolation859.194444444444
Midmean - Closest Observation856.918918918919
Midmean - True Basic - Statistics Graphics Toolkit859.194444444444
Midmean - MS Excel (old versions)860.421052631579
Number of observations72


Parameters (Session):
Parameters (R input):
R code (references can be found in the software module):
geomean <- function(x) {
return(exp(mean(log(x))))
}
harmean <- function(x) {
return(1/mean(1/x))
}
quamean <- function(x) {
return(sqrt(mean(x*x)))
}
winmean <- function(x) {
x <-sort(x[!is.na(x)])
n<-length(x)
denom <- 3
nodenom <- n/denom
if (nodenom>40) denom <- n/40
sqrtn = sqrt(n)
roundnodenom = floor(nodenom)
win <- array(NA,dim=c(roundnodenom,2))
for (j in 1:roundnodenom) {
win[j,1] <- (j*x[j+1]+sum(x[(j+1):(n-j)])+j*x[n-j])/n
win[j,2] <- sd(c(rep(x[j+1],j),x[(j+1):(n-j)],rep(x[n-j],j)))/sqrtn
}
return(win)
}
trimean <- function(x) {
x <-sort(x[!is.na(x)])
n<-length(x)
denom <- 3
nodenom <- n/denom
if (nodenom>40) denom <- n/40
sqrtn = sqrt(n)
roundnodenom = floor(nodenom)
tri <- array(NA,dim=c(roundnodenom,2))
for (j in 1:roundnodenom) {
tri[j,1] <- mean(x,trim=j/n)
tri[j,2] <- sd(x[(j+1):(n-j)]) / sqrt(n-j*2)
}
return(tri)
}
midrange <- function(x) {
return((max(x)+min(x))/2)
}
q1 <- function(data,n,p,i,f) {
np <- n*p;
i <<- floor(np)
f <<- np - i
qvalue <- (1-f)*data[i] + f*data[i+1]
}
q2 <- function(data,n,p,i,f) {
np <- (n+1)*p
i <<- floor(np)
f <<- np - i
qvalue <- (1-f)*data[i] + f*data[i+1]
}
q3 <- function(data,n,p,i,f) {
np <- n*p
i <<- floor(np)
f <<- np - i
if (f==0) {
qvalue <- data[i]
} else {
qvalue <- data[i+1]
}
}
q4 <- function(data,n,p,i,f) {
np <- n*p
i <<- floor(np)
f <<- np - i
if (f==0) {
qvalue <- (data[i]+data[i+1])/2
} else {
qvalue <- data[i+1]
}
}
q5 <- function(data,n,p,i,f) {
np <- (n-1)*p
i <<- floor(np)
f <<- np - i
if (f==0) {
qvalue <- data[i+1]
} else {
qvalue <- data[i+1] + f*(data[i+2]-data[i+1])
}
}
q6 <- function(data,n,p,i,f) {
np <- n*p+0.5
i <<- floor(np)
f <<- np - i
qvalue <- data[i]
}
q7 <- function(data,n,p,i,f) {
np <- (n+1)*p
i <<- floor(np)
f <<- np - i
if (f==0) {
qvalue <- data[i]
} else {
qvalue <- f*data[i] + (1-f)*data[i+1]
}
}
q8 <- function(data,n,p,i,f) {
np <- (n+1)*p
i <<- floor(np)
f <<- np - i
if (f==0) {
qvalue <- data[i]
} else {
if (f == 0.5) {
qvalue <- (data[i]+data[i+1])/2
} else {
if (f < 0.5) {
qvalue <- data[i]
} else {
qvalue <- data[i+1]
}
}
}
}
midmean <- function(x,def) {
x <-sort(x[!is.na(x)])
n<-length(x)
if (def==1) {
qvalue1 <- q1(x,n,0.25,i,f)
qvalue3 <- q1(x,n,0.75,i,f)
}
if (def==2) {
qvalue1 <- q2(x,n,0.25,i,f)
qvalue3 <- q2(x,n,0.75,i,f)
}
if (def==3) {
qvalue1 <- q3(x,n,0.25,i,f)
qvalue3 <- q3(x,n,0.75,i,f)
}
if (def==4) {
qvalue1 <- q4(x,n,0.25,i,f)
qvalue3 <- q4(x,n,0.75,i,f)
}
if (def==5) {
qvalue1 <- q5(x,n,0.25,i,f)
qvalue3 <- q5(x,n,0.75,i,f)
}
if (def==6) {
qvalue1 <- q6(x,n,0.25,i,f)
qvalue3 <- q6(x,n,0.75,i,f)
}
if (def==7) {
qvalue1 <- q7(x,n,0.25,i,f)
qvalue3 <- q7(x,n,0.75,i,f)
}
if (def==8) {
qvalue1 <- q8(x,n,0.25,i,f)
qvalue3 <- q8(x,n,0.75,i,f)
}
midm <- 0
myn <- 0
roundno4 <- round(n/4)
round3no4 <- round(3*n/4)
for (i in 1:n) {
if ((x[i]>=qvalue1) & (x[i]<=qvalue3)){
midm = midm + x[i]
myn = myn + 1
}
}
midm = midm / myn
return(midm)
}
(arm <- mean(x))
sqrtn <- sqrt(length(x))
(armse <- sd(x) / sqrtn)
(armose <- arm / armse)
(geo <- geomean(x))
(har <- harmean(x))
(qua <- quamean(x))
(win <- winmean(x))
(tri <- trimean(x))
(midr <- midrange(x))
midm <- array(NA,dim=8)
for (j in 1:8) midm[j] <- midmean(x,j)
midm
bitmap(file='test1.png')
lb <- win[,1] - 2*win[,2]
ub <- win[,1] + 2*win[,2]
if ((ylimmin == '') | (ylimmax == '')) plot(win[,1],type='b',main=main, xlab='j', pch=19, ylab='Winsorized Mean(j/n)', ylim=c(min(lb),max(ub))) else plot(win[,1],type='l',main=main, xlab='j', pch=19, ylab='Winsorized Mean(j/n)', ylim=c(ylimmin,ylimmax))
lines(ub,lty=3)
lines(lb,lty=3)
grid()
dev.off()
bitmap(file='test2.png')
lb <- tri[,1] - 2*tri[,2]
ub <- tri[,1] + 2*tri[,2]
if ((ylimmin == '') | (ylimmax == '')) plot(tri[,1],type='b',main=main, xlab='j', pch=19, ylab='Trimmed Mean(j/n)', ylim=c(min(lb),max(ub))) else plot(tri[,1],type='l',main=main, xlab='j', pch=19, ylab='Trimmed Mean(j/n)', ylim=c(ylimmin,ylimmax))
lines(ub,lty=3)
lines(lb,lty=3)
grid()
dev.off()
load(file='createtable')
a<-table.start()
a<-table.row.start(a)
a<-table.element(a,'Central Tendency - Ungrouped Data',4,TRUE)
a<-table.row.end(a)
a<-table.row.start(a)
a<-table.element(a,'Measure',header=TRUE)
a<-table.element(a,'Value',header=TRUE)
a<-table.element(a,'S.E.',header=TRUE)
a<-table.element(a,'Value/S.E.',header=TRUE)
a<-table.row.end(a)
a<-table.row.start(a)
a<-table.element(a,hyperlink('arithmetic_mean.htm', 'Arithmetic Mean', 'click to view the definition of the Arithmetic Mean'),header=TRUE)
a<-table.element(a,arm)
a<-table.element(a,hyperlink('arithmetic_mean_standard_error.htm', armse, 'click to view the definition of the Standard Error of the Arithmetic Mean'))
a<-table.element(a,armose)
a<-table.row.end(a)
a<-table.row.start(a)
a<-table.element(a,hyperlink('geometric_mean.htm', 'Geometric Mean', 'click to view the definition of the Geometric Mean'),header=TRUE)
a<-table.element(a,geo)
a<-table.element(a,'')
a<-table.row.end(a)
a<-table.row.start(a)
a<-table.element(a,hyperlink('harmonic_mean.htm', 'Harmonic Mean', 'click to view the definition of the Harmonic Mean'),header=TRUE)
a<-table.element(a,har)
a<-table.element(a,'')
a<-table.row.end(a)
a<-table.row.start(a)
a<-table.element(a,hyperlink('quadratic_mean.htm', 'Quadratic Mean', 'click to view the definition of the Quadratic Mean'),header=TRUE)
a<-table.element(a,qua)
a<-table.element(a,'')
a<-table.row.end(a)
for (j in 1:length(win[,1])) {
a<-table.row.start(a)
mylabel <- paste('Winsorized Mean (',j)
mylabel <- paste(mylabel,'/')
mylabel <- paste(mylabel,length(win[,1]))
mylabel <- paste(mylabel,')')
a<-table.element(a,hyperlink('winsorized_mean.htm', mylabel, 'click to view the definition of the Winsorized Mean'),header=TRUE)
a<-table.element(a,win[j,1])
a<-table.element(a,win[j,2])
a<-table.element(a,win[j,1]/win[j,2])
a<-table.row.end(a)
}
for (j in 1:length(tri[,1])) {
a<-table.row.start(a)
mylabel <- paste('Trimmed Mean (',j)
mylabel <- paste(mylabel,'/')
mylabel <- paste(mylabel,length(tri[,1]))
mylabel <- paste(mylabel,')')
a<-table.element(a,hyperlink('arithmetic_mean.htm', mylabel, 'click to view the definition of the Trimmed Mean'),header=TRUE)
a<-table.element(a,tri[j,1])
a<-table.element(a,tri[j,2])
a<-table.element(a,tri[j,1]/tri[j,2])
a<-table.row.end(a)
}
a<-table.row.start(a)
a<-table.element(a,hyperlink('median_1.htm', 'Median', 'click to view the definition of the Median'),header=TRUE)
a<-table.element(a,median(x))
a<-table.element(a,'')
a<-table.row.end(a)
a<-table.row.start(a)
a<-table.element(a,hyperlink('midrange.htm', 'Midrange', 'click to view the definition of the Midrange'),header=TRUE)
a<-table.element(a,midr)
a<-table.element(a,'')
a<-table.row.end(a)
a<-table.row.start(a)
mymid <- hyperlink('midmean.htm', 'Midmean', 'click to view the definition of the Midmean')
mylabel <- paste(mymid,hyperlink('method_1.htm','Weighted Average at Xnp',''),sep=' - ')
a<-table.element(a,mylabel,header=TRUE)
a<-table.element(a,midm[1])
a<-table.element(a,'')
a<-table.row.end(a)
a<-table.row.start(a)
mymid <- hyperlink('midmean.htm', 'Midmean', 'click to view the definition of the Midmean')
mylabel <- paste(mymid,hyperlink('method_2.htm','Weighted Average at X(n+1)p',''),sep=' - ')
a<-table.element(a,mylabel,header=TRUE)
a<-table.element(a,midm[2])
a<-table.element(a,'')
a<-table.row.end(a)
a<-table.row.start(a)
mymid <- hyperlink('midmean.htm', 'Midmean', 'click to view the definition of the Midmean')
mylabel <- paste(mymid,hyperlink('method_3.htm','Empirical Distribution Function',''),sep=' - ')
a<-table.element(a,mylabel,header=TRUE)
a<-table.element(a,midm[3])
a<-table.element(a,'')
a<-table.row.end(a)
a<-table.row.start(a)
mymid <- hyperlink('midmean.htm', 'Midmean', 'click to view the definition of the Midmean')
mylabel <- paste(mymid,hyperlink('method_4.htm','Empirical Distribution Function - Averaging',''),sep=' - ')
a<-table.element(a,mylabel,header=TRUE)
a<-table.element(a,midm[4])
a<-table.element(a,'')
a<-table.row.end(a)
a<-table.row.start(a)
mymid <- hyperlink('midmean.htm', 'Midmean', 'click to view the definition of the Midmean')
mylabel <- paste(mymid,hyperlink('method_5.htm','Empirical Distribution Function - Interpolation',''),sep=' - ')
a<-table.element(a,mylabel,header=TRUE)
a<-table.element(a,midm[5])
a<-table.element(a,'')
a<-table.row.end(a)
a<-table.row.start(a)
mymid <- hyperlink('midmean.htm', 'Midmean', 'click to view the definition of the Midmean')
mylabel <- paste(mymid,hyperlink('method_6.htm','Closest Observation',''),sep=' - ')
a<-table.element(a,mylabel,header=TRUE)
a<-table.element(a,midm[6])
a<-table.element(a,'')
a<-table.row.end(a)
a<-table.row.start(a)
mymid <- hyperlink('midmean.htm', 'Midmean', 'click to view the definition of the Midmean')
mylabel <- paste(mymid,hyperlink('method_7.htm','True Basic - Statistics Graphics Toolkit',''),sep=' - ')
a<-table.element(a,mylabel,header=TRUE)
a<-table.element(a,midm[7])
a<-table.element(a,'')
a<-table.row.end(a)
a<-table.row.start(a)
mymid <- hyperlink('midmean.htm', 'Midmean', 'click to view the definition of the Midmean')
mylabel <- paste(mymid,hyperlink('method_8.htm','MS Excel (old versions)',''),sep=' - ')
a<-table.element(a,mylabel,header=TRUE)
a<-table.element(a,midm[8])
a<-table.element(a,'')
a<-table.row.end(a)
a<-table.row.start(a)
a<-table.element(a,'Number of observations',header=TRUE)
a<-table.element(a,length(x))
a<-table.element(a,'')
a<-table.row.end(a)
a<-table.end(a)
table.save(a,file='mytable.tab')