Free Statistics

of Irreproducible Research!

Author's title

Rekenkundig gedmiddelde vs Mediaan: Windenergie: Productie per maand op het...

Author*Unverified author*
R Software Modulerwasp_meanversusmedian.wasp
Title produced by softwareMean versus Median
Date of computationWed, 25 Feb 2015 16:26:27 +0000
Cite this page as followsStatistical Computations at FreeStatistics.org, Office for Research Development and Education, URL https://freestatistics.org/blog/index.php?v=date/2015/Feb/25/t1424881632xrvjvugxdxfy709.htm/, Retrieved Sat, 18 May 2024 23:41:27 +0000
Statistical Computations at FreeStatistics.org, Office for Research Development and Education, URL https://freestatistics.org/blog/index.php?pk=277496, Retrieved Sat, 18 May 2024 23:41:27 +0000
QR Codes:

Original text written by user:
IsPrivate?No (this computation is public)
User-defined keywords
Estimated Impact135
Family? (F = Feedback message, R = changed R code, M = changed R Module, P = changed Parameters, D = changed Data)
-       [Mean versus Median] [Rekenkundig gedmi...] [2015-02-25 16:26:27] [f898ec974b62c60a8bec4044c4c271e3] [Current]
Feedback Forum

Post a new message
Dataseries X:
507
233
346
159
225
146
253
169
246
129
318
378
580
336
468
229
189
181
210
270
229
319
377
275
365
269
377
194
337
212
278
197
305
343
588
382
266
305
345
249
253
167
149
286
260
375
339
322
396
421
254
279
347
264
324
243
324
420
295
731
576
391
229
347
262
317
249
211
303
337
383
588
456
375
507
405
363
394
166
217
299
549
395
730


Summary of computational transaction
Raw Inputview raw input (R code)
Raw Outputview raw output of R engine
Computing time1 seconds
R Server'Sir Ronald Aylmer Fisher' @ fisher.wessa.net

\begin{tabular}{lllllllll}
\hline
Summary of computational transaction \tabularnewline
Raw Input & view raw input (R code)  \tabularnewline
Raw Output & view raw output of R engine  \tabularnewline
Computing time & 1 seconds \tabularnewline
R Server & 'Sir Ronald Aylmer Fisher' @ fisher.wessa.net \tabularnewline
\hline
\end{tabular}
%Source: https://freestatistics.org/blog/index.php?pk=277496&T=0

[TABLE]
[ROW][C]Summary of computational transaction[/C][/ROW]
[ROW][C]Raw Input[/C][C]view raw input (R code) [/C][/ROW]
[ROW][C]Raw Output[/C][C]view raw output of R engine [/C][/ROW]
[ROW][C]Computing time[/C][C]1 seconds[/C][/ROW]
[ROW][C]R Server[/C][C]'Sir Ronald Aylmer Fisher' @ fisher.wessa.net[/C][/ROW]
[/TABLE]
Source: https://freestatistics.org/blog/index.php?pk=277496&T=0

Globally Unique Identifier (entire table): ba.freestatistics.org/blog/index.php?pk=277496&T=0

As an alternative you can also use a QR Code:  

The GUIDs for individual cells are displayed in the table below:

Summary of computational transaction
Raw Inputview raw input (R code)
Raw Outputview raw output of R engine
Computing time1 seconds
R Server'Sir Ronald Aylmer Fisher' @ fisher.wessa.net


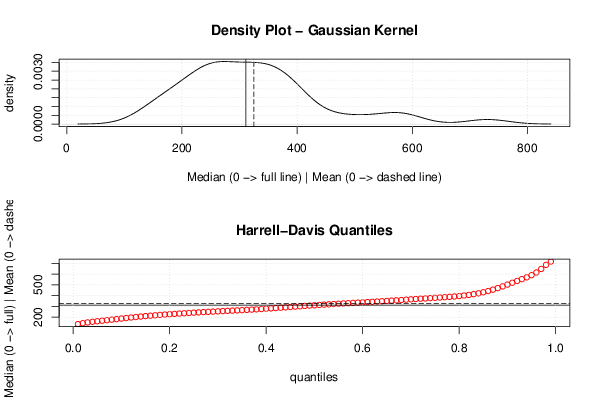
Median versus Mean
mean324.785714285714
median311

\begin{tabular}{lllllllll}
\hline
Median versus Mean \tabularnewline
mean & 324.785714285714 \tabularnewline
median & 311 \tabularnewline
\hline
\end{tabular}
%Source: https://freestatistics.org/blog/index.php?pk=277496&T=1

[TABLE]
[ROW][C]Median versus Mean[/C][/ROW]
[ROW][C]mean[/C][C]324.785714285714[/C][/ROW]
[ROW][C]median[/C][C]311[/C][/ROW]
[/TABLE]
Source: https://freestatistics.org/blog/index.php?pk=277496&T=1

Globally Unique Identifier (entire table): ba.freestatistics.org/blog/index.php?pk=277496&T=1

As an alternative you can also use a QR Code:  

The GUIDs for individual cells are displayed in the table below:

Median versus Mean
mean324.785714285714
median311


Parameters (Session):
Parameters (R input):
R code (references can be found in the software module):
library(Hmisc)
m <- mean(x)
e <- median(x)
bitmap(file='test1.png')
op <- par(mfrow=c(2,1))
mydensity1 <- density(x,kernel='gaussian',na.rm=TRUE)
plot(mydensity1,main='Density Plot - Gaussian Kernel',xlab='Median (0 -> full line) | Mean (0 -> dashed line)',ylab='density')
abline(v=e,lty=1)
abline(v=m,lty=5)
grid()
myseq <- seq(0.01, 0.99, 0.01)
hd <- hdquantile(x, probs = myseq, se = TRUE, na.rm = FALSE, names = TRUE, weights=FALSE)
plot(myseq,hd,col=2,main='Harrell-Davis Quantiles',xlab='quantiles',ylab='Median (0 -> full) | Mean (0 -> dashed)')
abline(h=m,lty=5)
abline(h=e,lty=1)
grid()
par(op)
dev.off()
load(file='createtable')
a<-table.start()
a<-table.row.start(a)
a<-table.element(a,'Median versus Mean',2,TRUE)
a<-table.row.end(a)
a<-table.row.start(a)
a<-table.element(a,'mean',header=TRUE)
a<-table.element(a,mean(x))
a<-table.row.end(a)
a<-table.row.start(a)
a<-table.element(a,'median',header=TRUE)
a<-table.element(a,median(x))
a<-table.row.end(a)
a<-table.end(a)
table.save(a,file='mytable.tab')