Free Statistics
of Irreproducible Research!
Description of Statistical Computation | |||||||||||||||||||||||||||||||||||||||||
|---|---|---|---|---|---|---|---|---|---|---|---|---|---|---|---|---|---|---|---|---|---|---|---|---|---|---|---|---|---|---|---|---|---|---|---|---|---|---|---|---|---|
| Author's title | |||||||||||||||||||||||||||||||||||||||||
| Author | *Unverified author* | ||||||||||||||||||||||||||||||||||||||||
| R Software Module | -- | ||||||||||||||||||||||||||||||||||||||||
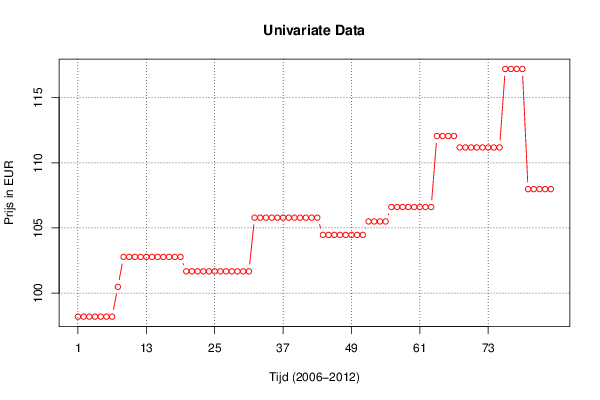
| Title produced by software | Univariate Data Series | ||||||||||||||||||||||||||||||||||||||||
| Date of computation | Thu, 26 Sep 2013 15:34:17 -0400 | ||||||||||||||||||||||||||||||||||||||||
| Cite this page as follows | Statistical Computations at FreeStatistics.org, Office for Research Development and Education, URL https://freestatistics.org/blog/index.php?v=date/2013/Sep/26/t1380224132xpvky7opc9v42t3.htm/, Retrieved Mon, 29 Apr 2024 14:05:31 +0000 | ||||||||||||||||||||||||||||||||||||||||
| Statistical Computations at FreeStatistics.org, Office for Research Development and Education, URL https://freestatistics.org/blog/index.php?pk=212188, Retrieved Mon, 29 Apr 2024 14:05:31 +0000 | |||||||||||||||||||||||||||||||||||||||||
| QR Codes: | |||||||||||||||||||||||||||||||||||||||||
|
| |||||||||||||||||||||||||||||||||||||||||
| Original text written by user: | |||||||||||||||||||||||||||||||||||||||||
| IsPrivate? | No (this computation is public) | ||||||||||||||||||||||||||||||||||||||||
| User-defined keywords | |||||||||||||||||||||||||||||||||||||||||
| Estimated Impact | 46 | ||||||||||||||||||||||||||||||||||||||||
Tree of Dependent Computations | |||||||||||||||||||||||||||||||||||||||||
| Family? (F = Feedback message, R = changed R code, M = changed R Module, P = changed Parameters, D = changed Data) | |||||||||||||||||||||||||||||||||||||||||
| - [Univariate Data Series] [] [2013-09-26 19:27:55] [f1b4e037718d22c2d53dadc64c29fc43] - RMP [Univariate Data Series] [] [2013-09-26 19:34:17] [3c7daf9c150a57900c7784703a011e78] [Current] | |||||||||||||||||||||||||||||||||||||||||
| Feedback Forum | |||||||||||||||||||||||||||||||||||||||||
Post a new message | |||||||||||||||||||||||||||||||||||||||||
Dataset | |||||||||||||||||||||||||||||||||||||||||
| Dataseries X: | |||||||||||||||||||||||||||||||||||||||||
98,19 98,19 98,19 98,19 98,19 98,19 98,19 100,48 102,78 102,78 102,78 102,78 102,78 102,78 102,78 102,78 102,78 102,78 102,78 101,67 101,67 101,67 101,67 101,67 101,67 101,67 101,67 101,67 101,67 101,67 101,67 105,79 105,79 105,79 105,79 105,79 105,79 105,79 105,79 105,79 105,79 105,79 105,79 104,47 104,47 104,47 104,47 104,47 104,47 104,47 104,47 105,5 105,5 105,5 105,5 106,61 106,61 106,61 106,61 106,61 106,61 106,61 106,61 112,06 112,06 112,06 112,06 111,18 111,18 111,18 111,18 111,18 111,18 111,18 111,18 117,21 117,21 117,21 117,21 107,98 107,98 107,98 107,98 107,98 | |||||||||||||||||||||||||||||||||||||||||
Tables (Output of Computation) | |||||||||||||||||||||||||||||||||||||||||
| |||||||||||||||||||||||||||||||||||||||||
Figures (Output of Computation) | |||||||||||||||||||||||||||||||||||||||||
Input Parameters & R Code | |||||||||||||||||||||||||||||||||||||||||
| Parameters (Session): | |||||||||||||||||||||||||||||||||||||||||
| par1 = Gemiddelde Consumptieprijs per product:Voetbalwedstrijd 1e Klasse ; par2 = Belgostat ; par3 = Gemiddelde Consumptieprijs per product:Voetbalwedstrijd 1e Klasse ; par4 = 12 ; | |||||||||||||||||||||||||||||||||||||||||
| Parameters (R input): | |||||||||||||||||||||||||||||||||||||||||
| par1 = Gemiddelde Consumptieprijs per product:Voetbalwedstrijd 1e Klasse ; par2 = Belgostat ; par3 = Gemiddelde Consumptieprijs per product:Voetbalwedstrijd 1e Klasse ; par4 = 12 ; par5 = ; par6 = ; par7 = ; par8 = ; par9 = ; par10 = ; par11 = ; par12 = ; par13 = ; par14 = ; par15 = ; par16 = ; par17 = ; par18 = ; par19 = ; par20 = ; | |||||||||||||||||||||||||||||||||||||||||
| R code (references can be found in the software module): | |||||||||||||||||||||||||||||||||||||||||
if (par4 != 'No season') { | |||||||||||||||||||||||||||||||||||||||||