Free Statistics
of Irreproducible Research!
Description of Statistical Computation | |||||||||||||||||||||||||||||||||||||||||
|---|---|---|---|---|---|---|---|---|---|---|---|---|---|---|---|---|---|---|---|---|---|---|---|---|---|---|---|---|---|---|---|---|---|---|---|---|---|---|---|---|---|
| Author's title | |||||||||||||||||||||||||||||||||||||||||
| Author | *Unverified author* | ||||||||||||||||||||||||||||||||||||||||
| R Software Module | rwasp_univariatedataseries.wasp | ||||||||||||||||||||||||||||||||||||||||
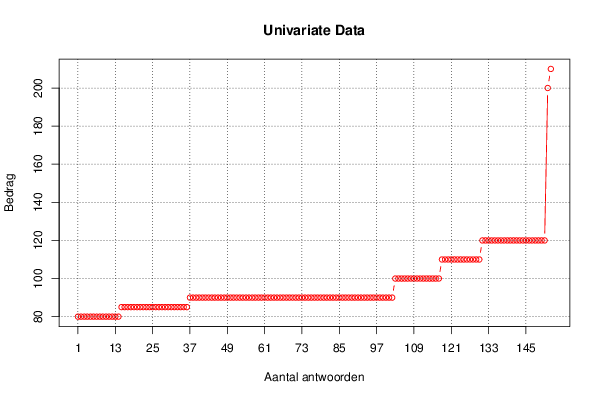
| Title produced by software | Univariate Data Series | ||||||||||||||||||||||||||||||||||||||||
| Date of computation | Thu, 26 Sep 2013 04:34:20 -0400 | ||||||||||||||||||||||||||||||||||||||||
| Cite this page as follows | Statistical Computations at FreeStatistics.org, Office for Research Development and Education, URL https://freestatistics.org/blog/index.php?v=date/2013/Sep/26/t1380184655ma8l4g0pbzf0cca.htm/, Retrieved Mon, 29 Apr 2024 15:47:34 +0000 | ||||||||||||||||||||||||||||||||||||||||
| Statistical Computations at FreeStatistics.org, Office for Research Development and Education, URL https://freestatistics.org/blog/index.php?pk=212029, Retrieved Mon, 29 Apr 2024 15:47:34 +0000 | |||||||||||||||||||||||||||||||||||||||||
| QR Codes: | |||||||||||||||||||||||||||||||||||||||||
|
| |||||||||||||||||||||||||||||||||||||||||
| Original text written by user: | |||||||||||||||||||||||||||||||||||||||||
| IsPrivate? | No (this computation is public) | ||||||||||||||||||||||||||||||||||||||||
| User-defined keywords | |||||||||||||||||||||||||||||||||||||||||
| Estimated Impact | 135 | ||||||||||||||||||||||||||||||||||||||||
Tree of Dependent Computations | |||||||||||||||||||||||||||||||||||||||||
| Family? (F = Feedback message, R = changed R code, M = changed R Module, P = changed Parameters, D = changed Data) | |||||||||||||||||||||||||||||||||||||||||
| - [Univariate Data Series] [Gem. wekelijkse u...] [2013-09-26 08:34:20] [a3fde7297e5409122ee2dd3b0c427a94] [Current] - R PD [Univariate Data Series] [Reserve positie IMF] [2013-09-26 09:30:56] [24038aabf47565f93cb94afd3d1da284] - RMPD [Histogram] [Reserve positie IMF] [2013-09-26 09:40:33] [24038aabf47565f93cb94afd3d1da284] - RMPD [Histogram] [Reserve positie i...] [2013-09-26 09:45:35] [24038aabf47565f93cb94afd3d1da284] - RMPD [Histogram] [Reserve positie IMF] [2013-09-26 09:49:05] [24038aabf47565f93cb94afd3d1da284] - RMPD [Histogram] [Reserve positie IMF] [2013-09-26 10:04:12] [24038aabf47565f93cb94afd3d1da284] - RMPD [] [tneq94s2] [1970-01-01 00:00:00] [74be16979710d4c4e7c6647856088456] - RMPD [] [lw4rjtyo] [1970-01-01 00:00:00] [74be16979710d4c4e7c6647856088456] - RMPD [] [wue1z5k5] [1970-01-01 00:00:00] [74be16979710d4c4e7c6647856088456] - RMPD [] [8l082gxm] [1970-01-01 00:00:00] [74be16979710d4c4e7c6647856088456] - RMPD [] [7o0bdjbm] [1970-01-01 00:00:00] [74be16979710d4c4e7c6647856088456] - RMPD [Kernel Density Estimation] [Reserve positie IMF] [2013-09-26 10:07:58] [24038aabf47565f93cb94afd3d1da284] - RMPD [Kernel Density Estimation] [Reserve positie IMF] [2013-09-26 10:12:38] [24038aabf47565f93cb94afd3d1da284] | |||||||||||||||||||||||||||||||||||||||||
| Feedback Forum | |||||||||||||||||||||||||||||||||||||||||
Post a new message | |||||||||||||||||||||||||||||||||||||||||
Dataset | |||||||||||||||||||||||||||||||||||||||||
| Dataseries X: | |||||||||||||||||||||||||||||||||||||||||
80 80 80 80 80 80 80 80 80 80 80 80 80 80 85 85 85 85 85 85 85 85 85 85 85 85 85 85 85 85 85 85 85 85 85 85 90 90 90 90 90 90 90 90 90 90 90 90 90 90 90 90 90 90 90 90 90 90 90 90 90 90 90 90 90 90 90 90 90 90 90 90 90 90 90 90 90 90 90 90 90 90 90 90 90 90 90 90 90 90 90 90 90 90 90 90 90 90 90 90 90 90 100 100 100 100 100 100 100 100 100 100 100 100 100 100 100 110 110 110 110 110 110 110 110 110 110 110 110 110 120 120 120 120 120 120 120 120 120 120 120 120 120 120 120 120 120 120 120 120 120 200 210 | |||||||||||||||||||||||||||||||||||||||||
Tables (Output of Computation) | |||||||||||||||||||||||||||||||||||||||||
| |||||||||||||||||||||||||||||||||||||||||
Figures (Output of Computation) | |||||||||||||||||||||||||||||||||||||||||
Input Parameters & R Code | |||||||||||||||||||||||||||||||||||||||||
| Parameters (Session): | |||||||||||||||||||||||||||||||||||||||||
| par1 = Gem. wekelijkse uitgaven supermarkt ; par2 = enqu�te ; par3 = Gem. wekelijkse uitgaven supermarkt in EUR ; par4 = 12 ; | |||||||||||||||||||||||||||||||||||||||||
| Parameters (R input): | |||||||||||||||||||||||||||||||||||||||||
| par1 = Gem. wekelijkse uitgaven supermarkt ; par2 = enqu�te ; par3 = Gem. wekelijkse uitgaven supermarkt in EUR ; par4 = 12 ; | |||||||||||||||||||||||||||||||||||||||||
| R code (references can be found in the software module): | |||||||||||||||||||||||||||||||||||||||||
par4 <- '12' | |||||||||||||||||||||||||||||||||||||||||