Free Statistics

of Irreproducible Research!

Author's title

Author*Unverified author*
R Software Modulerwasp_histogram.wasp
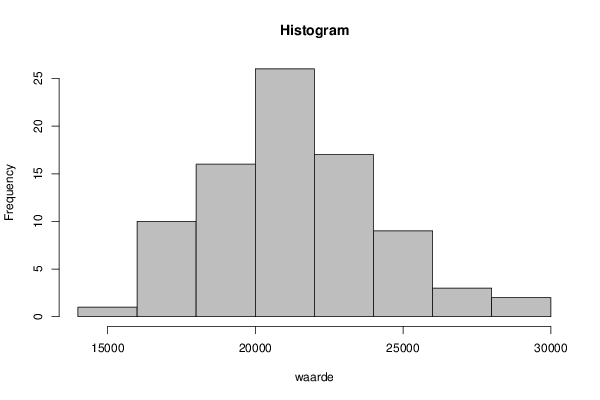
Title produced by softwareHistogram
Date of computationFri, 20 Sep 2013 09:28:39 -0400
Cite this page as followsStatistical Computations at FreeStatistics.org, Office for Research Development and Education, URL https://freestatistics.org/blog/index.php?v=date/2013/Sep/20/t1379684097rc62gi4pqj4dtfl.htm/, Retrieved Sat, 27 Apr 2024 10:53:47 +0000
Statistical Computations at FreeStatistics.org, Office for Research Development and Education, URL https://freestatistics.org/blog/index.php?pk=211564, Retrieved Sat, 27 Apr 2024 10:53:47 +0000
QR Codes:

Original text written by user:
IsPrivate?No (this computation is public)
User-defined keywords
Estimated Impact184
Family? (F = Feedback message, R = changed R code, M = changed R Module, P = changed Parameters, D = changed Data)
-       [Histogram] [] [2013-09-20 13:28:39] [154a417cb3d2e1b589b01477b4193420] [Current]
Feedback Forum

Post a new message
Dataseries X:
23869
23275
21862
20949
20001
19988
27180
28189
28302
25053
23030
21027
21461
20334
19191
18362
16961
17128
24027
25056
23872
22139
20397
19861
19960
19307
17812
17497
15379
16256
22775
23401
22783
21364
20607
20786
21312
20997
20819
20172
18527
19250
25378
26408
25884
23938
22973
23319
23048
22553
21598
20486
18811
19378
25887
26571
25628
23089
21714
20858
21166
20417
19503
18351
17283
17306
23465
24156
23408
21255
20063
19526
20463
19968
18804
17869
16843
17006
21358
24107
23446
21722
20683
19960


Summary of computational transaction
Raw Inputview raw input (R code)
Raw Outputview raw output of R engine
Computing time1 seconds
R Server'George Udny Yule' @ yule.wessa.net

\begin{tabular}{lllllllll}
\hline
Summary of computational transaction \tabularnewline
Raw Input & view raw input (R code)  \tabularnewline
Raw Output & view raw output of R engine  \tabularnewline
Computing time & 1 seconds \tabularnewline
R Server & 'George Udny Yule' @ yule.wessa.net \tabularnewline
\hline
\end{tabular}
%Source: https://freestatistics.org/blog/index.php?pk=211564&T=0

[TABLE]
[ROW][C]Summary of computational transaction[/C][/ROW]
[ROW][C]Raw Input[/C][C]view raw input (R code) [/C][/ROW]
[ROW][C]Raw Output[/C][C]view raw output of R engine [/C][/ROW]
[ROW][C]Computing time[/C][C]1 seconds[/C][/ROW]
[ROW][C]R Server[/C][C]'George Udny Yule' @ yule.wessa.net[/C][/ROW]
[/TABLE]
Source: https://freestatistics.org/blog/index.php?pk=211564&T=0

Globally Unique Identifier (entire table): ba.freestatistics.org/blog/index.php?pk=211564&T=0

As an alternative you can also use a QR Code:  

The GUIDs for individual cells are displayed in the table below:

Summary of computational transaction
Raw Inputview raw input (R code)
Raw Outputview raw output of R engine
Computing time1 seconds
R Server'George Udny Yule' @ yule.wessa.net


Frequency Table (Histogram)
BinsMidpointAbs. FrequencyRel. FrequencyCumul. Rel. Freq.Density
[14000,16000[1500010.0119050.0119056e-06
[16000,18000[17000100.1190480.1309526e-05
[18000,20000[19000160.1904760.3214299.5e-05
[20000,22000[21000260.3095240.6309520.000155
[22000,24000[23000170.2023810.8333330.000101
[24000,26000[2500090.1071430.9404765.4e-05
[26000,28000[2700030.0357140.976191.8e-05
[28000,30000]2900020.0238111.2e-05

\begin{tabular}{lllllllll}
\hline
Frequency Table (Histogram) \tabularnewline
Bins & Midpoint & Abs. Frequency & Rel. Frequency & Cumul. Rel. Freq. & Density \tabularnewline
[14000,16000[ & 15000 & 1 & 0.011905 & 0.011905 & 6e-06 \tabularnewline
[16000,18000[ & 17000 & 10 & 0.119048 & 0.130952 & 6e-05 \tabularnewline
[18000,20000[ & 19000 & 16 & 0.190476 & 0.321429 & 9.5e-05 \tabularnewline
[20000,22000[ & 21000 & 26 & 0.309524 & 0.630952 & 0.000155 \tabularnewline
[22000,24000[ & 23000 & 17 & 0.202381 & 0.833333 & 0.000101 \tabularnewline
[24000,26000[ & 25000 & 9 & 0.107143 & 0.940476 & 5.4e-05 \tabularnewline
[26000,28000[ & 27000 & 3 & 0.035714 & 0.97619 & 1.8e-05 \tabularnewline
[28000,30000] & 29000 & 2 & 0.02381 & 1 & 1.2e-05 \tabularnewline
\hline
\end{tabular}
%Source: https://freestatistics.org/blog/index.php?pk=211564&T=1

[TABLE]
[ROW][C]Frequency Table (Histogram)[/C][/ROW]
[ROW][C]Bins[/C][C]Midpoint[/C][C]Abs. Frequency[/C][C]Rel. Frequency[/C][C]Cumul. Rel. Freq.[/C][C]Density[/C][/ROW]
[ROW][C][14000,16000[[/C][C]15000[/C][C]1[/C][C]0.011905[/C][C]0.011905[/C][C]6e-06[/C][/ROW]
[ROW][C][16000,18000[[/C][C]17000[/C][C]10[/C][C]0.119048[/C][C]0.130952[/C][C]6e-05[/C][/ROW]
[ROW][C][18000,20000[[/C][C]19000[/C][C]16[/C][C]0.190476[/C][C]0.321429[/C][C]9.5e-05[/C][/ROW]
[ROW][C][20000,22000[[/C][C]21000[/C][C]26[/C][C]0.309524[/C][C]0.630952[/C][C]0.000155[/C][/ROW]
[ROW][C][22000,24000[[/C][C]23000[/C][C]17[/C][C]0.202381[/C][C]0.833333[/C][C]0.000101[/C][/ROW]
[ROW][C][24000,26000[[/C][C]25000[/C][C]9[/C][C]0.107143[/C][C]0.940476[/C][C]5.4e-05[/C][/ROW]
[ROW][C][26000,28000[[/C][C]27000[/C][C]3[/C][C]0.035714[/C][C]0.97619[/C][C]1.8e-05[/C][/ROW]
[ROW][C][28000,30000][/C][C]29000[/C][C]2[/C][C]0.02381[/C][C]1[/C][C]1.2e-05[/C][/ROW]
[/TABLE]
Source: https://freestatistics.org/blog/index.php?pk=211564&T=1

Globally Unique Identifier (entire table): ba.freestatistics.org/blog/index.php?pk=211564&T=1

As an alternative you can also use a QR Code:  

The GUIDs for individual cells are displayed in the table below:

Frequency Table (Histogram)
BinsMidpointAbs. FrequencyRel. FrequencyCumul. Rel. Freq.Density
[14000,16000[1500010.0119050.0119056e-06
[16000,18000[17000100.1190480.1309526e-05
[18000,20000[19000160.1904760.3214299.5e-05
[20000,22000[21000260.3095240.6309520.000155
[22000,24000[23000170.2023810.8333330.000101
[24000,26000[2500090.1071430.9404765.4e-05
[26000,28000[2700030.0357140.976191.8e-05
[28000,30000]2900020.0238111.2e-05


Parameters (Session):
par2 = grey ; par3 = FALSE ; par4 = Unknown ;
Parameters (R input):
par1 = ; par2 = grey ; par3 = FALSE ; par4 = Unknown ;
R code (references can be found in the software module):
par4 <- 'Unknown'
par3 <- 'FALSE'
par2 <- 'grey'
par1 <- ''
par1 <- as.numeric(par1)
if (par3 == 'TRUE') par3 <- TRUE
if (par3 == 'FALSE') par3 <- FALSE
if (par4 == 'Unknown') par1 <- as.numeric(par1)
if (par4 == 'Interval/Ratio') par1 <- as.numeric(par1)
if (par4 == '3-point Likert') par1 <- c(1:3 - 0.5, 3.5)
if (par4 == '4-point Likert') par1 <- c(1:4 - 0.5, 4.5)
if (par4 == '5-point Likert') par1 <- c(1:5 - 0.5, 5.5)
if (par4 == '6-point Likert') par1 <- c(1:6 - 0.5, 6.5)
if (par4 == '7-point Likert') par1 <- c(1:7 - 0.5, 7.5)
if (par4 == '8-point Likert') par1 <- c(1:8 - 0.5, 8.5)
if (par4 == '9-point Likert') par1 <- c(1:9 - 0.5, 9.5)
if (par4 == '10-point Likert') par1 <- c(1:10 - 0.5, 10.5)
bitmap(file='test1.png')
if(is.numeric(x[1])) {
if (is.na(par1)) {
myhist<-hist(x,col=par2,main=main,xlab=xlab,right=par3)
} else {
if (par1 < 0) par1 <- 3
if (par1 > 50) par1 <- 50
myhist<-hist(x,breaks=par1,col=par2,main=main,xlab=xlab,right=par3)
}
} else {
plot(mytab <- table(x),col=par2,main='Frequency Plot',xlab=xlab,ylab='Absolute Frequency')
}
dev.off()
if(is.numeric(x[1])) {
myhist
n <- length(x)
load(file='createtable')
a<-table.start()
a<-table.row.start(a)
a<-table.element(a,hyperlink('histogram.htm','Frequency Table (Histogram)',''),6,TRUE)
a<-table.row.end(a)
a<-table.row.start(a)
a<-table.element(a,'Bins',header=TRUE)
a<-table.element(a,'Midpoint',header=TRUE)
a<-table.element(a,'Abs. Frequency',header=TRUE)
a<-table.element(a,'Rel. Frequency',header=TRUE)
a<-table.element(a,'Cumul. Rel. Freq.',header=TRUE)
a<-table.element(a,'Density',header=TRUE)
a<-table.row.end(a)
crf <- 0
if (par3 == FALSE) mybracket <- '[' else mybracket <- ']'
mynumrows <- (length(myhist$breaks)-1)
for (i in 1:mynumrows) {
a<-table.row.start(a)
if (i == 1)
dum <- paste('[',myhist$breaks[i],sep='')
else
dum <- paste(mybracket,myhist$breaks[i],sep='')
dum <- paste(dum,myhist$breaks[i+1],sep=',')
if (i==mynumrows)
dum <- paste(dum,']',sep='')
else
dum <- paste(dum,mybracket,sep='')
a<-table.element(a,dum,header=TRUE)
a<-table.element(a,myhist$mids[i])
a<-table.element(a,myhist$counts[i])
rf <- myhist$counts[i]/n
crf <- crf + rf
a<-table.element(a,round(rf,6))
a<-table.element(a,round(crf,6))
a<-table.element(a,round(myhist$density[i],6))
a<-table.row.end(a)
}
a<-table.end(a)
table.save(a,file='mytable.tab')
} else {
mytab
reltab <- mytab / sum(mytab)
n <- length(mytab)
load(file='createtable')
a<-table.start()
a<-table.row.start(a)
a<-table.element(a,'Frequency Table (Categorical Data)',3,TRUE)
a<-table.row.end(a)
a<-table.row.start(a)
a<-table.element(a,'Category',header=TRUE)
a<-table.element(a,'Abs. Frequency',header=TRUE)
a<-table.element(a,'Rel. Frequency',header=TRUE)
a<-table.row.end(a)
for (i in 1:n) {
a<-table.row.start(a)
a<-table.element(a,labels(mytab)$x[i],header=TRUE)
a<-table.element(a,mytab[i])
a<-table.element(a,round(reltab[i],4))
a<-table.row.end(a)
}
a<-table.end(a)
table.save(a,file='mytable1.tab')
}