Free Statistics
of Irreproducible Research!
Description of Statistical Computation | |||||||||||||||||||||||||||||||||||||||||||||||||||||||||||||||||||||||||||||||||||||||||||||||||||||||||||||||||||||||||||||||||||||||||||||||||||||||||||||||||||||||||||||||||||||||||
|---|---|---|---|---|---|---|---|---|---|---|---|---|---|---|---|---|---|---|---|---|---|---|---|---|---|---|---|---|---|---|---|---|---|---|---|---|---|---|---|---|---|---|---|---|---|---|---|---|---|---|---|---|---|---|---|---|---|---|---|---|---|---|---|---|---|---|---|---|---|---|---|---|---|---|---|---|---|---|---|---|---|---|---|---|---|---|---|---|---|---|---|---|---|---|---|---|---|---|---|---|---|---|---|---|---|---|---|---|---|---|---|---|---|---|---|---|---|---|---|---|---|---|---|---|---|---|---|---|---|---|---|---|---|---|---|---|---|---|---|---|---|---|---|---|---|---|---|---|---|---|---|---|---|---|---|---|---|---|---|---|---|---|---|---|---|---|---|---|---|---|---|---|---|---|---|---|---|---|---|---|---|---|---|---|---|
| Author's title | |||||||||||||||||||||||||||||||||||||||||||||||||||||||||||||||||||||||||||||||||||||||||||||||||||||||||||||||||||||||||||||||||||||||||||||||||||||||||||||||||||||||||||||||||||||||||
| Author | *The author of this computation has been verified* | ||||||||||||||||||||||||||||||||||||||||||||||||||||||||||||||||||||||||||||||||||||||||||||||||||||||||||||||||||||||||||||||||||||||||||||||||||||||||||||||||||||||||||||||||||||||||
| R Software Module | rwasp_notchedbox1.wasp | ||||||||||||||||||||||||||||||||||||||||||||||||||||||||||||||||||||||||||||||||||||||||||||||||||||||||||||||||||||||||||||||||||||||||||||||||||||||||||||||||||||||||||||||||||||||||
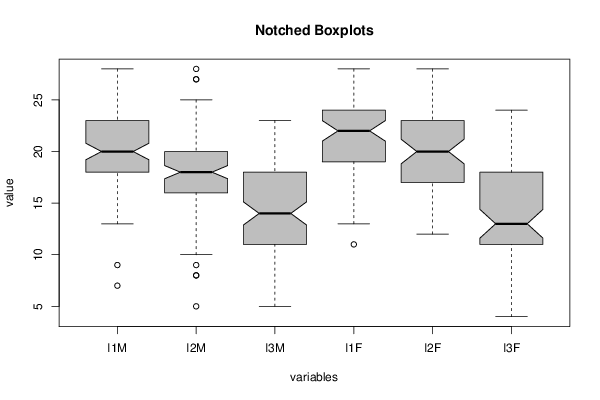
| Title produced by software | Notched Boxplots | ||||||||||||||||||||||||||||||||||||||||||||||||||||||||||||||||||||||||||||||||||||||||||||||||||||||||||||||||||||||||||||||||||||||||||||||||||||||||||||||||||||||||||||||||||||||||
| Date of computation | Wed, 23 Oct 2013 16:28:48 -0400 | ||||||||||||||||||||||||||||||||||||||||||||||||||||||||||||||||||||||||||||||||||||||||||||||||||||||||||||||||||||||||||||||||||||||||||||||||||||||||||||||||||||||||||||||||||||||||
| Cite this page as follows | Statistical Computations at FreeStatistics.org, Office for Research Development and Education, URL https://freestatistics.org/blog/index.php?v=date/2013/Oct/23/t1382560230n49t9vhhx3ksps8.htm/, Retrieved Sun, 28 Apr 2024 08:27:20 +0000 | ||||||||||||||||||||||||||||||||||||||||||||||||||||||||||||||||||||||||||||||||||||||||||||||||||||||||||||||||||||||||||||||||||||||||||||||||||||||||||||||||||||||||||||||||||||||||
| Statistical Computations at FreeStatistics.org, Office for Research Development and Education, URL https://freestatistics.org/blog/index.php?pk=219194, Retrieved Sun, 28 Apr 2024 08:27:20 +0000 | |||||||||||||||||||||||||||||||||||||||||||||||||||||||||||||||||||||||||||||||||||||||||||||||||||||||||||||||||||||||||||||||||||||||||||||||||||||||||||||||||||||||||||||||||||||||||
| QR Codes: | |||||||||||||||||||||||||||||||||||||||||||||||||||||||||||||||||||||||||||||||||||||||||||||||||||||||||||||||||||||||||||||||||||||||||||||||||||||||||||||||||||||||||||||||||||||||||
|
| |||||||||||||||||||||||||||||||||||||||||||||||||||||||||||||||||||||||||||||||||||||||||||||||||||||||||||||||||||||||||||||||||||||||||||||||||||||||||||||||||||||||||||||||||||||||||
| Original text written by user: | |||||||||||||||||||||||||||||||||||||||||||||||||||||||||||||||||||||||||||||||||||||||||||||||||||||||||||||||||||||||||||||||||||||||||||||||||||||||||||||||||||||||||||||||||||||||||
| IsPrivate? | No (this computation is public) | ||||||||||||||||||||||||||||||||||||||||||||||||||||||||||||||||||||||||||||||||||||||||||||||||||||||||||||||||||||||||||||||||||||||||||||||||||||||||||||||||||||||||||||||||||||||||
| User-defined keywords | |||||||||||||||||||||||||||||||||||||||||||||||||||||||||||||||||||||||||||||||||||||||||||||||||||||||||||||||||||||||||||||||||||||||||||||||||||||||||||||||||||||||||||||||||||||||||
| Estimated Impact | 70 | ||||||||||||||||||||||||||||||||||||||||||||||||||||||||||||||||||||||||||||||||||||||||||||||||||||||||||||||||||||||||||||||||||||||||||||||||||||||||||||||||||||||||||||||||||||||||
Tree of Dependent Computations | |||||||||||||||||||||||||||||||||||||||||||||||||||||||||||||||||||||||||||||||||||||||||||||||||||||||||||||||||||||||||||||||||||||||||||||||||||||||||||||||||||||||||||||||||||||||||
| Family? (F = Feedback message, R = changed R code, M = changed R Module, P = changed Parameters, D = changed Data) | |||||||||||||||||||||||||||||||||||||||||||||||||||||||||||||||||||||||||||||||||||||||||||||||||||||||||||||||||||||||||||||||||||||||||||||||||||||||||||||||||||||||||||||||||||||||||
| - [Notched Boxplots] [WS3: V3 - I] [2013-10-23 20:28:48] [0af71617a8b1f082fed242286206dd2f] [Current] | |||||||||||||||||||||||||||||||||||||||||||||||||||||||||||||||||||||||||||||||||||||||||||||||||||||||||||||||||||||||||||||||||||||||||||||||||||||||||||||||||||||||||||||||||||||||||
| Feedback Forum | |||||||||||||||||||||||||||||||||||||||||||||||||||||||||||||||||||||||||||||||||||||||||||||||||||||||||||||||||||||||||||||||||||||||||||||||||||||||||||||||||||||||||||||||||||||||||
Post a new message | |||||||||||||||||||||||||||||||||||||||||||||||||||||||||||||||||||||||||||||||||||||||||||||||||||||||||||||||||||||||||||||||||||||||||||||||||||||||||||||||||||||||||||||||||||||||||
Dataset | |||||||||||||||||||||||||||||||||||||||||||||||||||||||||||||||||||||||||||||||||||||||||||||||||||||||||||||||||||||||||||||||||||||||||||||||||||||||||||||||||||||||||||||||||||||||||
| Dataseries X: | |||||||||||||||||||||||||||||||||||||||||||||||||||||||||||||||||||||||||||||||||||||||||||||||||||||||||||||||||||||||||||||||||||||||||||||||||||||||||||||||||||||||||||||||||||||||||
26 21 21 NA NA NA 20 16 15 NA NA NA 19 19 18 NA NA NA NA NA NA 19 18 11 20 16 8 NA NA NA 25 23 19 NA NA NA NA NA NA 25 17 4 22 12 20 NA NA NA 26 19 16 NA NA NA 22 16 14 NA NA NA NA NA NA 17 19 10 NA NA NA 22 20 13 19 13 14 NA NA NA 24 20 8 NA NA NA 26 27 23 NA NA NA NA NA NA 21 17 11 13 8 9 NA NA NA NA NA NA 26 25 24 NA NA NA 20 26 5 22 13 15 NA NA NA NA NA NA 14 19 5 21 15 19 NA NA NA 7 5 6 NA NA NA NA NA NA 23 16 13 17 14 11 NA NA NA 25 24 17 NA NA NA 25 24 17 NA NA NA 19 9 5 NA NA NA NA NA NA 20 19 9 23 19 15 NA NA NA NA NA NA 22 25 17 22 19 17 NA NA NA 21 18 20 NA NA NA NA NA NA 15 15 12 NA NA NA 20 12 7 NA NA NA 22 21 16 18 12 7 NA NA NA NA NA NA 20 15 14 NA NA NA 28 28 24 22 25 15 NA NA NA 18 19 15 NA NA NA 23 20 10 NA NA NA 20 24 14 NA NA NA NA NA NA 25 26 18 NA NA NA 26 25 12 15 12 9 NA NA NA NA NA NA 17 12 9 NA NA NA 23 15 8 21 17 18 NA NA NA NA NA NA 13 14 10 18 16 17 NA NA NA 19 11 14 NA NA NA 22 20 16 NA NA NA 16 11 10 NA NA NA NA NA NA 24 22 19 18 20 10 NA NA NA 20 19 14 NA NA NA 24 17 10 NA NA NA NA NA NA 14 21 4 NA NA NA 22 23 19 24 18 9 NA NA NA 18 17 12 NA NA NA 21 27 16 NA NA NA NA NA NA 23 25 11 17 19 18 NA NA NA NA NA NA 22 22 11 NA NA NA 24 24 24 NA NA NA 21 20 17 22 19 18 NA NA NA 16 11 9 NA NA NA 21 22 19 NA NA NA NA NA NA 23 22 18 NA NA NA 22 16 12 24 20 23 NA NA NA 24 24 22 NA NA NA 16 16 14 NA NA NA 16 16 14 NA NA NA NA NA NA 21 22 16 NA NA NA 26 24 23 NA NA NA 15 16 7 NA NA NA 25 27 10 18 11 12 NA NA NA NA NA NA NA NA NA 20 20 12 NA NA NA NA NA NA 17 20 17 NA NA NA 25 27 21 24 20 16 NA NA NA 17 12 11 NA NA NA 19 8 14 NA NA NA 20 21 13 NA NA NA 15 18 9 NA NA NA NA NA NA 27 24 19 22 16 13 NA NA NA 23 18 19 NA NA NA 16 20 13 NA NA NA 19 20 13 NA NA NA NA NA NA 25 19 13 19 17 14 NA NA NA NA NA NA 19 16 12 NA NA NA 26 26 22 21 15 11 NA NA NA NA NA NA 20 22 5 24 17 18 NA NA NA 22 23 19 NA NA NA NA NA NA 20 21 14 18 19 15 NA NA NA NA NA NA 18 14 12 24 17 19 NA NA NA 24 12 15 NA NA NA 22 24 17 NA NA NA 23 18 8 NA NA NA 22 20 10 NA NA NA 20 16 12 NA NA NA 18 20 12 NA NA NA 25 22 20 NA NA NA NA NA NA 18 12 12 16 16 12 NA NA NA 20 17 14 NA NA NA NA NA NA 19 22 6 15 12 10 NA NA NA 19 14 18 NA NA NA 19 23 18 NA NA NA 16 15 7 NA NA NA 17 17 18 NA NA NA 28 28 9 NA NA NA NA NA NA 23 20 17 25 23 22 NA NA NA 20 13 11 NA NA NA NA NA NA 17 18 15 NA NA NA 23 23 17 16 19 15 NA NA NA NA NA NA 23 23 22 NA NA NA 11 12 9 NA NA NA 18 16 13 NA NA NA 24 23 20 23 13 14 NA NA NA 21 22 14 NA NA NA NA NA NA 16 18 12 NA NA NA 24 23 20 23 20 20 NA NA NA 18 10 8 NA NA NA 20 17 17 NA NA NA 9 18 9 NA NA NA NA NA NA 24 15 18 25 23 22 NA NA NA 20 17 10 NA NA NA NA NA NA 21 17 13 NA NA NA 25 22 15 NA NA NA 22 20 18 NA NA NA 21 20 18 21 19 12 NA NA NA 22 18 12 NA NA NA 27 22 20 NA NA NA NA NA NA 24 20 12 NA NA NA 24 22 16 NA NA NA 21 18 16 18 16 18 NA NA NA 16 16 16 NA NA NA 22 16 13 NA NA NA 20 16 17 NA NA NA NA NA NA 18 17 13 20 18 17 NA NA NA | |||||||||||||||||||||||||||||||||||||||||||||||||||||||||||||||||||||||||||||||||||||||||||||||||||||||||||||||||||||||||||||||||||||||||||||||||||||||||||||||||||||||||||||||||||||||||
Tables (Output of Computation) | |||||||||||||||||||||||||||||||||||||||||||||||||||||||||||||||||||||||||||||||||||||||||||||||||||||||||||||||||||||||||||||||||||||||||||||||||||||||||||||||||||||||||||||||||||||||||
| |||||||||||||||||||||||||||||||||||||||||||||||||||||||||||||||||||||||||||||||||||||||||||||||||||||||||||||||||||||||||||||||||||||||||||||||||||||||||||||||||||||||||||||||||||||||||
Figures (Output of Computation) | |||||||||||||||||||||||||||||||||||||||||||||||||||||||||||||||||||||||||||||||||||||||||||||||||||||||||||||||||||||||||||||||||||||||||||||||||||||||||||||||||||||||||||||||||||||||||
Input Parameters & R Code | |||||||||||||||||||||||||||||||||||||||||||||||||||||||||||||||||||||||||||||||||||||||||||||||||||||||||||||||||||||||||||||||||||||||||||||||||||||||||||||||||||||||||||||||||||||||||
| Parameters (Session): | |||||||||||||||||||||||||||||||||||||||||||||||||||||||||||||||||||||||||||||||||||||||||||||||||||||||||||||||||||||||||||||||||||||||||||||||||||||||||||||||||||||||||||||||||||||||||
| par1 = grey ; | |||||||||||||||||||||||||||||||||||||||||||||||||||||||||||||||||||||||||||||||||||||||||||||||||||||||||||||||||||||||||||||||||||||||||||||||||||||||||||||||||||||||||||||||||||||||||
| Parameters (R input): | |||||||||||||||||||||||||||||||||||||||||||||||||||||||||||||||||||||||||||||||||||||||||||||||||||||||||||||||||||||||||||||||||||||||||||||||||||||||||||||||||||||||||||||||||||||||||
| par1 = grey ; | |||||||||||||||||||||||||||||||||||||||||||||||||||||||||||||||||||||||||||||||||||||||||||||||||||||||||||||||||||||||||||||||||||||||||||||||||||||||||||||||||||||||||||||||||||||||||
| R code (references can be found in the software module): | |||||||||||||||||||||||||||||||||||||||||||||||||||||||||||||||||||||||||||||||||||||||||||||||||||||||||||||||||||||||||||||||||||||||||||||||||||||||||||||||||||||||||||||||||||||||||
z <- as.data.frame(t(y)) | |||||||||||||||||||||||||||||||||||||||||||||||||||||||||||||||||||||||||||||||||||||||||||||||||||||||||||||||||||||||||||||||||||||||||||||||||||||||||||||||||||||||||||||||||||||||||