| Correlations for all pairs of data series (method=pearson) | ||||
| V1 | V2 | V3 | V4 | |
| V1 | 1 | 0.416 | 0.44 | 0.35 |
| V2 | 0.416 | 1 | 0.439 | 0.391 |
| V3 | 0.44 | 0.439 | 1 | 0.456 |
| V4 | 0.35 | 0.391 | 0.456 | 1 |
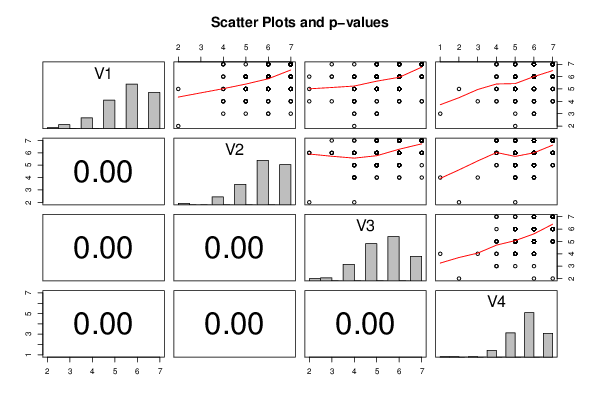
| Correlations for all pairs of data series with p-values | |||
| pair | Pearson r | Spearman rho | Kendall tau |
| V1;V2 | 0.4164 | 0.4201 | 0.373 |
| p-value | (0) | (0) | (0) |
| V1;V3 | 0.4398 | 0.476 | 0.412 |
| p-value | (0) | (0) | (0) |
| V1;V4 | 0.3495 | 0.3518 | 0.309 |
| p-value | (0) | (0) | (0) |
| V2;V3 | 0.4395 | 0.4572 | 0.3974 |
| p-value | (0) | (0) | (0) |
| V2;V4 | 0.3907 | 0.3322 | 0.2958 |
| p-value | (0) | (0) | (0) |
| V3;V4 | 0.4556 | 0.4657 | 0.411 |
| p-value | (0) | (0) | (0) |
| Meta Analysis of Correlation Tests | |||
| Number of significant by total number of Correlations | |||
| Type I error | Pearson r | Spearman rho | Kendall tau |
| 0.01 | 1 | 1 | 1 |
| 0.02 | 1 | 1 | 1 |
| 0.03 | 1 | 1 | 1 |
| 0.04 | 1 | 1 | 1 |
| 0.05 | 1 | 1 | 1 |
| 0.06 | 1 | 1 | 1 |
| 0.07 | 1 | 1 | 1 |
| 0.08 | 1 | 1 | 1 |
| 0.09 | 1 | 1 | 1 |
| 0.1 | 1 | 1 | 1 |