Free Statistics

of Irreproducible Research!

Author's title

Author*Unverified author*
R Software Modulerwasp_centraltendency.wasp
Title produced by softwareCentral Tendency
Date of computationTue, 08 Oct 2013 14:02:36 -0400
Cite this page as followsStatistical Computations at FreeStatistics.org, Office for Research Development and Education, URL https://freestatistics.org/blog/index.php?v=date/2013/Oct/08/t1381255376yg67ud2hrc336z5.htm/, Retrieved Mon, 29 Apr 2024 19:19:56 +0000
Statistical Computations at FreeStatistics.org, Office for Research Development and Education, URL https://freestatistics.org/blog/index.php?pk=214173, Retrieved Mon, 29 Apr 2024 19:19:56 +0000
QR Codes:

Original text written by user:
IsPrivate?No (this computation is public)
User-defined keywords
Estimated Impact83
Family? (F = Feedback message, R = changed R code, M = changed R Module, P = changed Parameters, D = changed Data)
-       [Central Tendency] [] [2013-10-08 18:02:36] [629d05b8910d8b56ad89862016f2bc6c] [Current]
Feedback Forum

Post a new message
Dataseries X:
120,6
119,9
119,48
117,45
118,37
117,07
114,98
112,59
111,7
112,04
110,79
109,82
109,11
109,84
109,31
108,29
107,42
106,71
105,11
104,43
105,55
106,12
105,78
105,33
104,63
104,62
105,57
107,5
107,52
107,76
106,74
106,21
105,77
105,27
104,35
103,52
102,28
100,93
101,04
99,95
99,55
99,56
99,01
98,64
98,98
100,8
100,32
100,72
280,8
280,4
280,4
280,3
281
280,9
279,7
283,1
290,6
291,6
291,7
291,8
291,7
291,5
291,7
293,4
293,1
293,1
292,6
292,1
292,2
292
292,1
293,4
292,2
292,1
291,6
290,9
290,9
290,8
290,5
290
290,2
290,1
291
291,8


Summary of computational transaction
Raw Inputview raw input (R code)
Raw Outputview raw output of R engine
Computing time2 seconds
R Server'Herman Ole Andreas Wold' @ wold.wessa.net

\begin{tabular}{lllllllll}
\hline
Summary of computational transaction \tabularnewline
Raw Input & view raw input (R code)  \tabularnewline
Raw Output & view raw output of R engine  \tabularnewline
Computing time & 2 seconds \tabularnewline
R Server & 'Herman Ole Andreas Wold' @ wold.wessa.net \tabularnewline
\hline
\end{tabular}
%Source: https://freestatistics.org/blog/index.php?pk=214173&T=0

[TABLE]
[ROW][C]Summary of computational transaction[/C][/ROW]
[ROW][C]Raw Input[/C][C]view raw input (R code) [/C][/ROW]
[ROW][C]Raw Output[/C][C]view raw output of R engine [/C][/ROW]
[ROW][C]Computing time[/C][C]2 seconds[/C][/ROW]
[ROW][C]R Server[/C][C]'Herman Ole Andreas Wold' @ wold.wessa.net[/C][/ROW]
[/TABLE]
Source: https://freestatistics.org/blog/index.php?pk=214173&T=0

Globally Unique Identifier (entire table): ba.freestatistics.org/blog/index.php?pk=214173&T=0

As an alternative you can also use a QR Code:  

The GUIDs for individual cells are displayed in the table below:

Summary of computational transaction
Raw Inputview raw input (R code)
Raw Outputview raw output of R engine
Computing time2 seconds
R Server'Herman Ole Andreas Wold' @ wold.wessa.net


Central Tendency - Ungrouped Data
MeasureValueS.E.Value/S.E.
Arithmetic Mean185.1467857142869.9142687673408618.6747797602772
Geometric Mean163.772131790063
Harmonic Mean146.306603236904
Quadratic Mean206.003952513515
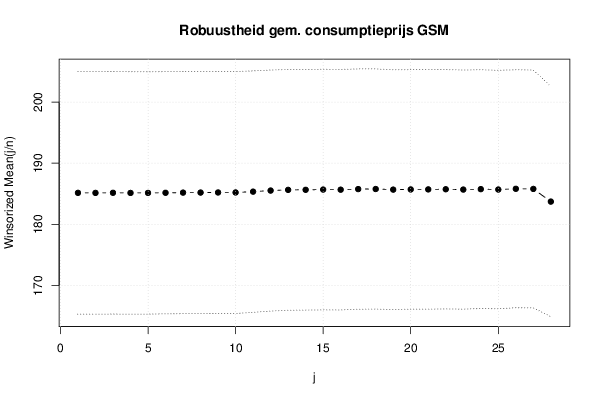
Winsorized Mean ( 1 / 28 )185.1508333333339.9138440732594918.6759880390634
Winsorized Mean ( 2 / 28 )185.1444047619059.9128308375431418.6772484869511
Winsorized Mean ( 3 / 28 )185.163690476199.9108177346393418.6829881684762
Winsorized Mean ( 4 / 28 )185.1403571428579.9076504345235418.6866057060036
Winsorized Mean ( 5 / 28 )185.1397619047629.9021329450300618.6969578102549
Winsorized Mean ( 6 / 28 )185.166190476199.899398699126518.7047916852292
Winsorized Mean ( 7 / 28 )185.191190476199.8948782444989418.7158634901998
Winsorized Mean ( 8 / 28 )185.198809523819.8940949017282618.7181153368015
Winsorized Mean ( 9 / 28 )185.2127380952389.8926642912822618.7222301941908
Winsorized Mean ( 10 / 28 )185.2139285714299.8897715521896518.7278267848787
Winsorized Mean ( 11 / 28 )185.3501190476199.8698074672431618.7795070636156
Winsorized Mean ( 12 / 28 )185.5272619047629.8519430990569818.8315401377542
Winsorized Mean ( 13 / 28 )185.6402380952389.8370965716962218.8714461367972
Winsorized Mean ( 14 / 28 )185.6535714285719.8357695339413818.8753478604715
Winsorized Mean ( 15 / 28 )185.68759.8323965191727818.8852737618867
Winsorized Mean ( 16 / 28 )185.6703571428579.8297335993770818.8886458891036
Winsorized Mean ( 17 / 28 )185.76759.8201024501104618.9170633344981
Winsorized Mean ( 18 / 28 )185.7803571428579.8139298537930318.9302715538622
Winsorized Mean ( 19 / 28 )185.6808333333339.7979261335109918.951034208991
Winsorized Mean ( 20 / 28 )185.7094047619059.7896716994842618.9699318284277
Winsorized Mean ( 21 / 28 )185.7144047619059.7891784705197618.9713983988734
Winsorized Mean ( 22 / 28 )185.7405952380959.7806249724800518.9906673408619
Winsorized Mean ( 23 / 28 )185.6885714285719.7732704663984618.999634980633
Winsorized Mean ( 24 / 28 )185.7571428571439.7600160765462619.0324627951715
Winsorized Mean ( 25 / 28 )185.6946428571439.7458435871149819.0537269757387
Winsorized Mean ( 26 / 28 )185.8184523809529.7266589060028619.1040370775492
Winsorized Mean ( 27 / 28 )185.7959523809529.7215625937043619.1117375000263
Winsorized Mean ( 28 / 28 )183.7226190476199.4044188432095819.5357759060545
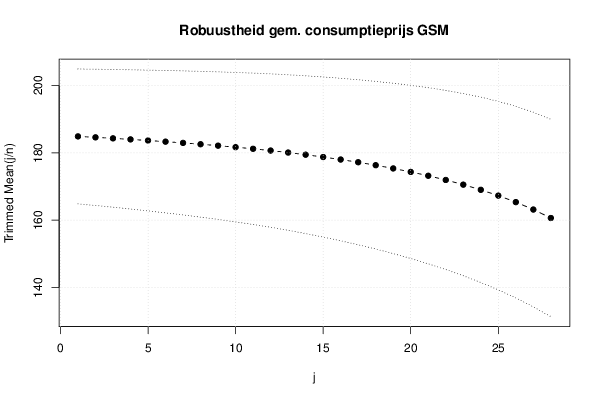
Trimmed Mean ( 1 / 28 )184.88158536585410.014209495703318.4619250720868
Trimmed Mean ( 2 / 28 )184.59887510.117405792403318.2456727334794
Trimmed Mean ( 3 / 28 )184.30512820512810.224116362929218.0265092515364
Trimmed Mean ( 4 / 28 )183.98881578947410.33470704898417.8030025347996
Trimmed Mean ( 5 / 28 )183.66202702702710.44956373563417.5760473521705
Trimmed Mean ( 6 / 28 )183.31722222222210.569335645848817.3442521237578
Trimmed Mean ( 7 / 28 )182.94742857142910.693473613218117.1083256188418
Trimmed Mean ( 8 / 28 )182.55147058823510.822476350113116.8678096105359
Trimmed Mean ( 9 / 28 )182.13030303030310.955835687719316.6240447759233
Trimmed Mean ( 10 / 28 )181.6807812511.093827647402516.3767445307787
Trimmed Mean ( 11 / 28 )181.20209677419411.236872140959616.125670426888
Trimmed Mean ( 12 / 28 )180.67416666666711.387692775081415.8657394641009
Trimmed Mean ( 13 / 28 )180.08844827586211.546271640500815.5971082166616
Trimmed Mean ( 14 / 28 )179.44785714285711.71256887244815.3209649477478
Trimmed Mean ( 15 / 28 )178.75833333333311.885101778580315.0405387066603
Trimmed Mean ( 16 / 28 )178.01211538461512.064313355400514.755262909756
Trimmed Mean ( 17 / 28 )177.20812.250329661536714.465569898612
Trimmed Mean ( 18 / 28 )176.32687512.444059144530614.169562596261
Trimmed Mean ( 19 / 28 )175.36782608695712.645209854412513.8683207401072
Trimmed Mean ( 20 / 28 )174.33159090909112.855359248596813.5610049892708
Trimmed Mean ( 21 / 28 )173.1938095238113.073075734877613.2481302056368
Trimmed Mean ( 22 / 28 )171.9417513.296628389333812.9312292534194
Trimmed Mean ( 23 / 28 )170.55526315789513.525947776873512.6094870371678
Trimmed Mean ( 24 / 28 )169.0213.759211904110712.2841337990807
Trimmed Mean ( 25 / 28 )167.29705882352913.993992825860511.9549195790904
Trimmed Mean ( 26 / 28 )165.365312514.226251603084711.6239552844787
Trimmed Mean ( 27 / 28 )163.16266666666714.448577362521411.2926458136909
Trimmed Mean ( 28 / 28 )160.64785714285714.646364983754110.9684455713789
Median116.025
Midrange196.02
Midmean - Weighted Average at Xnp174.331590909091
Midmean - Weighted Average at X(n+1)p175.931162790698
Midmean - Empirical Distribution Function174.331590909091
Midmean - Empirical Distribution Function - Averaging175.931162790698
Midmean - Empirical Distribution Function - Interpolation175.931162790698
Midmean - Closest Observation174.331590909091
Midmean - True Basic - Statistics Graphics Toolkit175.931162790698
Midmean - MS Excel (old versions)174.331590909091
Number of observations84

\begin{tabular}{lllllllll}
\hline
Central Tendency - Ungrouped Data \tabularnewline
Measure & Value & S.E. & Value/S.E. \tabularnewline
Arithmetic Mean & 185.146785714286 & 9.91426876734086 & 18.6747797602772 \tabularnewline
Geometric Mean & 163.772131790063 &  &  \tabularnewline
Harmonic Mean & 146.306603236904 &  &  \tabularnewline
Quadratic Mean & 206.003952513515 &  &  \tabularnewline
Winsorized Mean ( 1 / 28 ) & 185.150833333333 & 9.91384407325949 & 18.6759880390634 \tabularnewline
Winsorized Mean ( 2 / 28 ) & 185.144404761905 & 9.91283083754314 & 18.6772484869511 \tabularnewline
Winsorized Mean ( 3 / 28 ) & 185.16369047619 & 9.91081773463934 & 18.6829881684762 \tabularnewline
Winsorized Mean ( 4 / 28 ) & 185.140357142857 & 9.90765043452354 & 18.6866057060036 \tabularnewline
Winsorized Mean ( 5 / 28 ) & 185.139761904762 & 9.90213294503006 & 18.6969578102549 \tabularnewline
Winsorized Mean ( 6 / 28 ) & 185.16619047619 & 9.8993986991265 & 18.7047916852292 \tabularnewline
Winsorized Mean ( 7 / 28 ) & 185.19119047619 & 9.89487824449894 & 18.7158634901998 \tabularnewline
Winsorized Mean ( 8 / 28 ) & 185.19880952381 & 9.89409490172826 & 18.7181153368015 \tabularnewline
Winsorized Mean ( 9 / 28 ) & 185.212738095238 & 9.89266429128226 & 18.7222301941908 \tabularnewline
Winsorized Mean ( 10 / 28 ) & 185.213928571429 & 9.88977155218965 & 18.7278267848787 \tabularnewline
Winsorized Mean ( 11 / 28 ) & 185.350119047619 & 9.86980746724316 & 18.7795070636156 \tabularnewline
Winsorized Mean ( 12 / 28 ) & 185.527261904762 & 9.85194309905698 & 18.8315401377542 \tabularnewline
Winsorized Mean ( 13 / 28 ) & 185.640238095238 & 9.83709657169622 & 18.8714461367972 \tabularnewline
Winsorized Mean ( 14 / 28 ) & 185.653571428571 & 9.83576953394138 & 18.8753478604715 \tabularnewline
Winsorized Mean ( 15 / 28 ) & 185.6875 & 9.83239651917278 & 18.8852737618867 \tabularnewline
Winsorized Mean ( 16 / 28 ) & 185.670357142857 & 9.82973359937708 & 18.8886458891036 \tabularnewline
Winsorized Mean ( 17 / 28 ) & 185.7675 & 9.82010245011046 & 18.9170633344981 \tabularnewline
Winsorized Mean ( 18 / 28 ) & 185.780357142857 & 9.81392985379303 & 18.9302715538622 \tabularnewline
Winsorized Mean ( 19 / 28 ) & 185.680833333333 & 9.79792613351099 & 18.951034208991 \tabularnewline
Winsorized Mean ( 20 / 28 ) & 185.709404761905 & 9.78967169948426 & 18.9699318284277 \tabularnewline
Winsorized Mean ( 21 / 28 ) & 185.714404761905 & 9.78917847051976 & 18.9713983988734 \tabularnewline
Winsorized Mean ( 22 / 28 ) & 185.740595238095 & 9.78062497248005 & 18.9906673408619 \tabularnewline
Winsorized Mean ( 23 / 28 ) & 185.688571428571 & 9.77327046639846 & 18.999634980633 \tabularnewline
Winsorized Mean ( 24 / 28 ) & 185.757142857143 & 9.76001607654626 & 19.0324627951715 \tabularnewline
Winsorized Mean ( 25 / 28 ) & 185.694642857143 & 9.74584358711498 & 19.0537269757387 \tabularnewline
Winsorized Mean ( 26 / 28 ) & 185.818452380952 & 9.72665890600286 & 19.1040370775492 \tabularnewline
Winsorized Mean ( 27 / 28 ) & 185.795952380952 & 9.72156259370436 & 19.1117375000263 \tabularnewline
Winsorized Mean ( 28 / 28 ) & 183.722619047619 & 9.40441884320958 & 19.5357759060545 \tabularnewline
Trimmed Mean ( 1 / 28 ) & 184.881585365854 & 10.0142094957033 & 18.4619250720868 \tabularnewline
Trimmed Mean ( 2 / 28 ) & 184.598875 & 10.1174057924033 & 18.2456727334794 \tabularnewline
Trimmed Mean ( 3 / 28 ) & 184.305128205128 & 10.2241163629292 & 18.0265092515364 \tabularnewline
Trimmed Mean ( 4 / 28 ) & 183.988815789474 & 10.334707048984 & 17.8030025347996 \tabularnewline
Trimmed Mean ( 5 / 28 ) & 183.662027027027 & 10.449563735634 & 17.5760473521705 \tabularnewline
Trimmed Mean ( 6 / 28 ) & 183.317222222222 & 10.5693356458488 & 17.3442521237578 \tabularnewline
Trimmed Mean ( 7 / 28 ) & 182.947428571429 & 10.6934736132181 & 17.1083256188418 \tabularnewline
Trimmed Mean ( 8 / 28 ) & 182.551470588235 & 10.8224763501131 & 16.8678096105359 \tabularnewline
Trimmed Mean ( 9 / 28 ) & 182.130303030303 & 10.9558356877193 & 16.6240447759233 \tabularnewline
Trimmed Mean ( 10 / 28 ) & 181.68078125 & 11.0938276474025 & 16.3767445307787 \tabularnewline
Trimmed Mean ( 11 / 28 ) & 181.202096774194 & 11.2368721409596 & 16.125670426888 \tabularnewline
Trimmed Mean ( 12 / 28 ) & 180.674166666667 & 11.3876927750814 & 15.8657394641009 \tabularnewline
Trimmed Mean ( 13 / 28 ) & 180.088448275862 & 11.5462716405008 & 15.5971082166616 \tabularnewline
Trimmed Mean ( 14 / 28 ) & 179.447857142857 & 11.712568872448 & 15.3209649477478 \tabularnewline
Trimmed Mean ( 15 / 28 ) & 178.758333333333 & 11.8851017785803 & 15.0405387066603 \tabularnewline
Trimmed Mean ( 16 / 28 ) & 178.012115384615 & 12.0643133554005 & 14.755262909756 \tabularnewline
Trimmed Mean ( 17 / 28 ) & 177.208 & 12.2503296615367 & 14.465569898612 \tabularnewline
Trimmed Mean ( 18 / 28 ) & 176.326875 & 12.4440591445306 & 14.169562596261 \tabularnewline
Trimmed Mean ( 19 / 28 ) & 175.367826086957 & 12.6452098544125 & 13.8683207401072 \tabularnewline
Trimmed Mean ( 20 / 28 ) & 174.331590909091 & 12.8553592485968 & 13.5610049892708 \tabularnewline
Trimmed Mean ( 21 / 28 ) & 173.19380952381 & 13.0730757348776 & 13.2481302056368 \tabularnewline
Trimmed Mean ( 22 / 28 ) & 171.94175 & 13.2966283893338 & 12.9312292534194 \tabularnewline
Trimmed Mean ( 23 / 28 ) & 170.555263157895 & 13.5259477768735 & 12.6094870371678 \tabularnewline
Trimmed Mean ( 24 / 28 ) & 169.02 & 13.7592119041107 & 12.2841337990807 \tabularnewline
Trimmed Mean ( 25 / 28 ) & 167.297058823529 & 13.9939928258605 & 11.9549195790904 \tabularnewline
Trimmed Mean ( 26 / 28 ) & 165.3653125 & 14.2262516030847 & 11.6239552844787 \tabularnewline
Trimmed Mean ( 27 / 28 ) & 163.162666666667 & 14.4485773625214 & 11.2926458136909 \tabularnewline
Trimmed Mean ( 28 / 28 ) & 160.647857142857 & 14.6463649837541 & 10.9684455713789 \tabularnewline
Median & 116.025 &  &  \tabularnewline
Midrange & 196.02 &  &  \tabularnewline
Midmean - Weighted Average at Xnp & 174.331590909091 &  &  \tabularnewline
Midmean - Weighted Average at X(n+1)p & 175.931162790698 &  &  \tabularnewline
Midmean - Empirical Distribution Function & 174.331590909091 &  &  \tabularnewline
Midmean - Empirical Distribution Function - Averaging & 175.931162790698 &  &  \tabularnewline
Midmean - Empirical Distribution Function - Interpolation & 175.931162790698 &  &  \tabularnewline
Midmean - Closest Observation & 174.331590909091 &  &  \tabularnewline
Midmean - True Basic - Statistics Graphics Toolkit & 175.931162790698 &  &  \tabularnewline
Midmean - MS Excel (old versions) & 174.331590909091 &  &  \tabularnewline
Number of observations & 84 &  &  \tabularnewline
\hline
\end{tabular}
%Source: https://freestatistics.org/blog/index.php?pk=214173&T=1

[TABLE]
[ROW][C]Central Tendency - Ungrouped Data[/C][/ROW]
[ROW][C]Measure[/C][C]Value[/C][C]S.E.[/C][C]Value/S.E.[/C][/ROW]
[ROW][C]Arithmetic Mean[/C][C]185.146785714286[/C][C]9.91426876734086[/C][C]18.6747797602772[/C][/ROW]
[ROW][C]Geometric Mean[/C][C]163.772131790063[/C][C][/C][C][/C][/ROW]
[ROW][C]Harmonic Mean[/C][C]146.306603236904[/C][C][/C][C][/C][/ROW]
[ROW][C]Quadratic Mean[/C][C]206.003952513515[/C][C][/C][C][/C][/ROW]
[ROW][C]Winsorized Mean ( 1 / 28 )[/C][C]185.150833333333[/C][C]9.91384407325949[/C][C]18.6759880390634[/C][/ROW]
[ROW][C]Winsorized Mean ( 2 / 28 )[/C][C]185.144404761905[/C][C]9.91283083754314[/C][C]18.6772484869511[/C][/ROW]
[ROW][C]Winsorized Mean ( 3 / 28 )[/C][C]185.16369047619[/C][C]9.91081773463934[/C][C]18.6829881684762[/C][/ROW]
[ROW][C]Winsorized Mean ( 4 / 28 )[/C][C]185.140357142857[/C][C]9.90765043452354[/C][C]18.6866057060036[/C][/ROW]
[ROW][C]Winsorized Mean ( 5 / 28 )[/C][C]185.139761904762[/C][C]9.90213294503006[/C][C]18.6969578102549[/C][/ROW]
[ROW][C]Winsorized Mean ( 6 / 28 )[/C][C]185.16619047619[/C][C]9.8993986991265[/C][C]18.7047916852292[/C][/ROW]
[ROW][C]Winsorized Mean ( 7 / 28 )[/C][C]185.19119047619[/C][C]9.89487824449894[/C][C]18.7158634901998[/C][/ROW]
[ROW][C]Winsorized Mean ( 8 / 28 )[/C][C]185.19880952381[/C][C]9.89409490172826[/C][C]18.7181153368015[/C][/ROW]
[ROW][C]Winsorized Mean ( 9 / 28 )[/C][C]185.212738095238[/C][C]9.89266429128226[/C][C]18.7222301941908[/C][/ROW]
[ROW][C]Winsorized Mean ( 10 / 28 )[/C][C]185.213928571429[/C][C]9.88977155218965[/C][C]18.7278267848787[/C][/ROW]
[ROW][C]Winsorized Mean ( 11 / 28 )[/C][C]185.350119047619[/C][C]9.86980746724316[/C][C]18.7795070636156[/C][/ROW]
[ROW][C]Winsorized Mean ( 12 / 28 )[/C][C]185.527261904762[/C][C]9.85194309905698[/C][C]18.8315401377542[/C][/ROW]
[ROW][C]Winsorized Mean ( 13 / 28 )[/C][C]185.640238095238[/C][C]9.83709657169622[/C][C]18.8714461367972[/C][/ROW]
[ROW][C]Winsorized Mean ( 14 / 28 )[/C][C]185.653571428571[/C][C]9.83576953394138[/C][C]18.8753478604715[/C][/ROW]
[ROW][C]Winsorized Mean ( 15 / 28 )[/C][C]185.6875[/C][C]9.83239651917278[/C][C]18.8852737618867[/C][/ROW]
[ROW][C]Winsorized Mean ( 16 / 28 )[/C][C]185.670357142857[/C][C]9.82973359937708[/C][C]18.8886458891036[/C][/ROW]
[ROW][C]Winsorized Mean ( 17 / 28 )[/C][C]185.7675[/C][C]9.82010245011046[/C][C]18.9170633344981[/C][/ROW]
[ROW][C]Winsorized Mean ( 18 / 28 )[/C][C]185.780357142857[/C][C]9.81392985379303[/C][C]18.9302715538622[/C][/ROW]
[ROW][C]Winsorized Mean ( 19 / 28 )[/C][C]185.680833333333[/C][C]9.79792613351099[/C][C]18.951034208991[/C][/ROW]
[ROW][C]Winsorized Mean ( 20 / 28 )[/C][C]185.709404761905[/C][C]9.78967169948426[/C][C]18.9699318284277[/C][/ROW]
[ROW][C]Winsorized Mean ( 21 / 28 )[/C][C]185.714404761905[/C][C]9.78917847051976[/C][C]18.9713983988734[/C][/ROW]
[ROW][C]Winsorized Mean ( 22 / 28 )[/C][C]185.740595238095[/C][C]9.78062497248005[/C][C]18.9906673408619[/C][/ROW]
[ROW][C]Winsorized Mean ( 23 / 28 )[/C][C]185.688571428571[/C][C]9.77327046639846[/C][C]18.999634980633[/C][/ROW]
[ROW][C]Winsorized Mean ( 24 / 28 )[/C][C]185.757142857143[/C][C]9.76001607654626[/C][C]19.0324627951715[/C][/ROW]
[ROW][C]Winsorized Mean ( 25 / 28 )[/C][C]185.694642857143[/C][C]9.74584358711498[/C][C]19.0537269757387[/C][/ROW]
[ROW][C]Winsorized Mean ( 26 / 28 )[/C][C]185.818452380952[/C][C]9.72665890600286[/C][C]19.1040370775492[/C][/ROW]
[ROW][C]Winsorized Mean ( 27 / 28 )[/C][C]185.795952380952[/C][C]9.72156259370436[/C][C]19.1117375000263[/C][/ROW]
[ROW][C]Winsorized Mean ( 28 / 28 )[/C][C]183.722619047619[/C][C]9.40441884320958[/C][C]19.5357759060545[/C][/ROW]
[ROW][C]Trimmed Mean ( 1 / 28 )[/C][C]184.881585365854[/C][C]10.0142094957033[/C][C]18.4619250720868[/C][/ROW]
[ROW][C]Trimmed Mean ( 2 / 28 )[/C][C]184.598875[/C][C]10.1174057924033[/C][C]18.2456727334794[/C][/ROW]
[ROW][C]Trimmed Mean ( 3 / 28 )[/C][C]184.305128205128[/C][C]10.2241163629292[/C][C]18.0265092515364[/C][/ROW]
[ROW][C]Trimmed Mean ( 4 / 28 )[/C][C]183.988815789474[/C][C]10.334707048984[/C][C]17.8030025347996[/C][/ROW]
[ROW][C]Trimmed Mean ( 5 / 28 )[/C][C]183.662027027027[/C][C]10.449563735634[/C][C]17.5760473521705[/C][/ROW]
[ROW][C]Trimmed Mean ( 6 / 28 )[/C][C]183.317222222222[/C][C]10.5693356458488[/C][C]17.3442521237578[/C][/ROW]
[ROW][C]Trimmed Mean ( 7 / 28 )[/C][C]182.947428571429[/C][C]10.6934736132181[/C][C]17.1083256188418[/C][/ROW]
[ROW][C]Trimmed Mean ( 8 / 28 )[/C][C]182.551470588235[/C][C]10.8224763501131[/C][C]16.8678096105359[/C][/ROW]
[ROW][C]Trimmed Mean ( 9 / 28 )[/C][C]182.130303030303[/C][C]10.9558356877193[/C][C]16.6240447759233[/C][/ROW]
[ROW][C]Trimmed Mean ( 10 / 28 )[/C][C]181.68078125[/C][C]11.0938276474025[/C][C]16.3767445307787[/C][/ROW]
[ROW][C]Trimmed Mean ( 11 / 28 )[/C][C]181.202096774194[/C][C]11.2368721409596[/C][C]16.125670426888[/C][/ROW]
[ROW][C]Trimmed Mean ( 12 / 28 )[/C][C]180.674166666667[/C][C]11.3876927750814[/C][C]15.8657394641009[/C][/ROW]
[ROW][C]Trimmed Mean ( 13 / 28 )[/C][C]180.088448275862[/C][C]11.5462716405008[/C][C]15.5971082166616[/C][/ROW]
[ROW][C]Trimmed Mean ( 14 / 28 )[/C][C]179.447857142857[/C][C]11.712568872448[/C][C]15.3209649477478[/C][/ROW]
[ROW][C]Trimmed Mean ( 15 / 28 )[/C][C]178.758333333333[/C][C]11.8851017785803[/C][C]15.0405387066603[/C][/ROW]
[ROW][C]Trimmed Mean ( 16 / 28 )[/C][C]178.012115384615[/C][C]12.0643133554005[/C][C]14.755262909756[/C][/ROW]
[ROW][C]Trimmed Mean ( 17 / 28 )[/C][C]177.208[/C][C]12.2503296615367[/C][C]14.465569898612[/C][/ROW]
[ROW][C]Trimmed Mean ( 18 / 28 )[/C][C]176.326875[/C][C]12.4440591445306[/C][C]14.169562596261[/C][/ROW]
[ROW][C]Trimmed Mean ( 19 / 28 )[/C][C]175.367826086957[/C][C]12.6452098544125[/C][C]13.8683207401072[/C][/ROW]
[ROW][C]Trimmed Mean ( 20 / 28 )[/C][C]174.331590909091[/C][C]12.8553592485968[/C][C]13.5610049892708[/C][/ROW]
[ROW][C]Trimmed Mean ( 21 / 28 )[/C][C]173.19380952381[/C][C]13.0730757348776[/C][C]13.2481302056368[/C][/ROW]
[ROW][C]Trimmed Mean ( 22 / 28 )[/C][C]171.94175[/C][C]13.2966283893338[/C][C]12.9312292534194[/C][/ROW]
[ROW][C]Trimmed Mean ( 23 / 28 )[/C][C]170.555263157895[/C][C]13.5259477768735[/C][C]12.6094870371678[/C][/ROW]
[ROW][C]Trimmed Mean ( 24 / 28 )[/C][C]169.02[/C][C]13.7592119041107[/C][C]12.2841337990807[/C][/ROW]
[ROW][C]Trimmed Mean ( 25 / 28 )[/C][C]167.297058823529[/C][C]13.9939928258605[/C][C]11.9549195790904[/C][/ROW]
[ROW][C]Trimmed Mean ( 26 / 28 )[/C][C]165.3653125[/C][C]14.2262516030847[/C][C]11.6239552844787[/C][/ROW]
[ROW][C]Trimmed Mean ( 27 / 28 )[/C][C]163.162666666667[/C][C]14.4485773625214[/C][C]11.2926458136909[/C][/ROW]
[ROW][C]Trimmed Mean ( 28 / 28 )[/C][C]160.647857142857[/C][C]14.6463649837541[/C][C]10.9684455713789[/C][/ROW]
[ROW][C]Median[/C][C]116.025[/C][C][/C][C][/C][/ROW]
[ROW][C]Midrange[/C][C]196.02[/C][C][/C][C][/C][/ROW]
[ROW][C]Midmean - Weighted Average at Xnp[/C][C]174.331590909091[/C][C][/C][C][/C][/ROW]
[ROW][C]Midmean - Weighted Average at X(n+1)p[/C][C]175.931162790698[/C][C][/C][C][/C][/ROW]
[ROW][C]Midmean - Empirical Distribution Function[/C][C]174.331590909091[/C][C][/C][C][/C][/ROW]
[ROW][C]Midmean - Empirical Distribution Function - Averaging[/C][C]175.931162790698[/C][C][/C][C][/C][/ROW]
[ROW][C]Midmean - Empirical Distribution Function - Interpolation[/C][C]175.931162790698[/C][C][/C][C][/C][/ROW]
[ROW][C]Midmean - Closest Observation[/C][C]174.331590909091[/C][C][/C][C][/C][/ROW]
[ROW][C]Midmean - True Basic - Statistics Graphics Toolkit[/C][C]175.931162790698[/C][C][/C][C][/C][/ROW]
[ROW][C]Midmean - MS Excel (old versions)[/C][C]174.331590909091[/C][C][/C][C][/C][/ROW]
[ROW][C]Number of observations[/C][C]84[/C][C][/C][C][/C][/ROW]
[/TABLE]
Source: https://freestatistics.org/blog/index.php?pk=214173&T=1

Globally Unique Identifier (entire table): ba.freestatistics.org/blog/index.php?pk=214173&T=1

As an alternative you can also use a QR Code:  

The GUIDs for individual cells are displayed in the table below:

Central Tendency - Ungrouped Data
MeasureValueS.E.Value/S.E.
Arithmetic Mean185.1467857142869.9142687673408618.6747797602772
Geometric Mean163.772131790063
Harmonic Mean146.306603236904
Quadratic Mean206.003952513515
Winsorized Mean ( 1 / 28 )185.1508333333339.9138440732594918.6759880390634
Winsorized Mean ( 2 / 28 )185.1444047619059.9128308375431418.6772484869511
Winsorized Mean ( 3 / 28 )185.163690476199.9108177346393418.6829881684762
Winsorized Mean ( 4 / 28 )185.1403571428579.9076504345235418.6866057060036
Winsorized Mean ( 5 / 28 )185.1397619047629.9021329450300618.6969578102549
Winsorized Mean ( 6 / 28 )185.166190476199.899398699126518.7047916852292
Winsorized Mean ( 7 / 28 )185.191190476199.8948782444989418.7158634901998
Winsorized Mean ( 8 / 28 )185.198809523819.8940949017282618.7181153368015
Winsorized Mean ( 9 / 28 )185.2127380952389.8926642912822618.7222301941908
Winsorized Mean ( 10 / 28 )185.2139285714299.8897715521896518.7278267848787
Winsorized Mean ( 11 / 28 )185.3501190476199.8698074672431618.7795070636156
Winsorized Mean ( 12 / 28 )185.5272619047629.8519430990569818.8315401377542
Winsorized Mean ( 13 / 28 )185.6402380952389.8370965716962218.8714461367972
Winsorized Mean ( 14 / 28 )185.6535714285719.8357695339413818.8753478604715
Winsorized Mean ( 15 / 28 )185.68759.8323965191727818.8852737618867
Winsorized Mean ( 16 / 28 )185.6703571428579.8297335993770818.8886458891036
Winsorized Mean ( 17 / 28 )185.76759.8201024501104618.9170633344981
Winsorized Mean ( 18 / 28 )185.7803571428579.8139298537930318.9302715538622
Winsorized Mean ( 19 / 28 )185.6808333333339.7979261335109918.951034208991
Winsorized Mean ( 20 / 28 )185.7094047619059.7896716994842618.9699318284277
Winsorized Mean ( 21 / 28 )185.7144047619059.7891784705197618.9713983988734
Winsorized Mean ( 22 / 28 )185.7405952380959.7806249724800518.9906673408619
Winsorized Mean ( 23 / 28 )185.6885714285719.7732704663984618.999634980633
Winsorized Mean ( 24 / 28 )185.7571428571439.7600160765462619.0324627951715
Winsorized Mean ( 25 / 28 )185.6946428571439.7458435871149819.0537269757387
Winsorized Mean ( 26 / 28 )185.8184523809529.7266589060028619.1040370775492
Winsorized Mean ( 27 / 28 )185.7959523809529.7215625937043619.1117375000263
Winsorized Mean ( 28 / 28 )183.7226190476199.4044188432095819.5357759060545
Trimmed Mean ( 1 / 28 )184.88158536585410.014209495703318.4619250720868
Trimmed Mean ( 2 / 28 )184.59887510.117405792403318.2456727334794
Trimmed Mean ( 3 / 28 )184.30512820512810.224116362929218.0265092515364
Trimmed Mean ( 4 / 28 )183.98881578947410.33470704898417.8030025347996
Trimmed Mean ( 5 / 28 )183.66202702702710.44956373563417.5760473521705
Trimmed Mean ( 6 / 28 )183.31722222222210.569335645848817.3442521237578
Trimmed Mean ( 7 / 28 )182.94742857142910.693473613218117.1083256188418
Trimmed Mean ( 8 / 28 )182.55147058823510.822476350113116.8678096105359
Trimmed Mean ( 9 / 28 )182.13030303030310.955835687719316.6240447759233
Trimmed Mean ( 10 / 28 )181.6807812511.093827647402516.3767445307787
Trimmed Mean ( 11 / 28 )181.20209677419411.236872140959616.125670426888
Trimmed Mean ( 12 / 28 )180.67416666666711.387692775081415.8657394641009
Trimmed Mean ( 13 / 28 )180.08844827586211.546271640500815.5971082166616
Trimmed Mean ( 14 / 28 )179.44785714285711.71256887244815.3209649477478
Trimmed Mean ( 15 / 28 )178.75833333333311.885101778580315.0405387066603
Trimmed Mean ( 16 / 28 )178.01211538461512.064313355400514.755262909756
Trimmed Mean ( 17 / 28 )177.20812.250329661536714.465569898612
Trimmed Mean ( 18 / 28 )176.32687512.444059144530614.169562596261
Trimmed Mean ( 19 / 28 )175.36782608695712.645209854412513.8683207401072
Trimmed Mean ( 20 / 28 )174.33159090909112.855359248596813.5610049892708
Trimmed Mean ( 21 / 28 )173.1938095238113.073075734877613.2481302056368
Trimmed Mean ( 22 / 28 )171.9417513.296628389333812.9312292534194
Trimmed Mean ( 23 / 28 )170.55526315789513.525947776873512.6094870371678
Trimmed Mean ( 24 / 28 )169.0213.759211904110712.2841337990807
Trimmed Mean ( 25 / 28 )167.29705882352913.993992825860511.9549195790904
Trimmed Mean ( 26 / 28 )165.365312514.226251603084711.6239552844787
Trimmed Mean ( 27 / 28 )163.16266666666714.448577362521411.2926458136909
Trimmed Mean ( 28 / 28 )160.64785714285714.646364983754110.9684455713789
Median116.025
Midrange196.02
Midmean - Weighted Average at Xnp174.331590909091
Midmean - Weighted Average at X(n+1)p175.931162790698
Midmean - Empirical Distribution Function174.331590909091
Midmean - Empirical Distribution Function - Averaging175.931162790698
Midmean - Empirical Distribution Function - Interpolation175.931162790698
Midmean - Closest Observation174.331590909091
Midmean - True Basic - Statistics Graphics Toolkit175.931162790698
Midmean - MS Excel (old versions)174.331590909091
Number of observations84


Parameters (Session):
Parameters (R input):
R code (references can be found in the software module):
geomean <- function(x) {
return(exp(mean(log(x))))
}
harmean <- function(x) {
return(1/mean(1/x))
}
quamean <- function(x) {
return(sqrt(mean(x*x)))
}
winmean <- function(x) {
x <-sort(x[!is.na(x)])
n<-length(x)
denom <- 3
nodenom <- n/denom
if (nodenom>40) denom <- n/40
sqrtn = sqrt(n)
roundnodenom = floor(nodenom)
win <- array(NA,dim=c(roundnodenom,2))
for (j in 1:roundnodenom) {
win[j,1] <- (j*x[j+1]+sum(x[(j+1):(n-j)])+j*x[n-j])/n
win[j,2] <- sd(c(rep(x[j+1],j),x[(j+1):(n-j)],rep(x[n-j],j)))/sqrtn
}
return(win)
}
trimean <- function(x) {
x <-sort(x[!is.na(x)])
n<-length(x)
denom <- 3
nodenom <- n/denom
if (nodenom>40) denom <- n/40
sqrtn = sqrt(n)
roundnodenom = floor(nodenom)
tri <- array(NA,dim=c(roundnodenom,2))
for (j in 1:roundnodenom) {
tri[j,1] <- mean(x,trim=j/n)
tri[j,2] <- sd(x[(j+1):(n-j)]) / sqrt(n-j*2)
}
return(tri)
}
midrange <- function(x) {
return((max(x)+min(x))/2)
}
q1 <- function(data,n,p,i,f) {
np <- n*p;
i <<- floor(np)
f <<- np - i
qvalue <- (1-f)*data[i] + f*data[i+1]
}
q2 <- function(data,n,p,i,f) {
np <- (n+1)*p
i <<- floor(np)
f <<- np - i
qvalue <- (1-f)*data[i] + f*data[i+1]
}
q3 <- function(data,n,p,i,f) {
np <- n*p
i <<- floor(np)
f <<- np - i
if (f==0) {
qvalue <- data[i]
} else {
qvalue <- data[i+1]
}
}
q4 <- function(data,n,p,i,f) {
np <- n*p
i <<- floor(np)
f <<- np - i
if (f==0) {
qvalue <- (data[i]+data[i+1])/2
} else {
qvalue <- data[i+1]
}
}
q5 <- function(data,n,p,i,f) {
np <- (n-1)*p
i <<- floor(np)
f <<- np - i
if (f==0) {
qvalue <- data[i+1]
} else {
qvalue <- data[i+1] + f*(data[i+2]-data[i+1])
}
}
q6 <- function(data,n,p,i,f) {
np <- n*p+0.5
i <<- floor(np)
f <<- np - i
qvalue <- data[i]
}
q7 <- function(data,n,p,i,f) {
np <- (n+1)*p
i <<- floor(np)
f <<- np - i
if (f==0) {
qvalue <- data[i]
} else {
qvalue <- f*data[i] + (1-f)*data[i+1]
}
}
q8 <- function(data,n,p,i,f) {
np <- (n+1)*p
i <<- floor(np)
f <<- np - i
if (f==0) {
qvalue <- data[i]
} else {
if (f == 0.5) {
qvalue <- (data[i]+data[i+1])/2
} else {
if (f < 0.5) {
qvalue <- data[i]
} else {
qvalue <- data[i+1]
}
}
}
}
midmean <- function(x,def) {
x <-sort(x[!is.na(x)])
n<-length(x)
if (def==1) {
qvalue1 <- q1(x,n,0.25,i,f)
qvalue3 <- q1(x,n,0.75,i,f)
}
if (def==2) {
qvalue1 <- q2(x,n,0.25,i,f)
qvalue3 <- q2(x,n,0.75,i,f)
}
if (def==3) {
qvalue1 <- q3(x,n,0.25,i,f)
qvalue3 <- q3(x,n,0.75,i,f)
}
if (def==4) {
qvalue1 <- q4(x,n,0.25,i,f)
qvalue3 <- q4(x,n,0.75,i,f)
}
if (def==5) {
qvalue1 <- q5(x,n,0.25,i,f)
qvalue3 <- q5(x,n,0.75,i,f)
}
if (def==6) {
qvalue1 <- q6(x,n,0.25,i,f)
qvalue3 <- q6(x,n,0.75,i,f)
}
if (def==7) {
qvalue1 <- q7(x,n,0.25,i,f)
qvalue3 <- q7(x,n,0.75,i,f)
}
if (def==8) {
qvalue1 <- q8(x,n,0.25,i,f)
qvalue3 <- q8(x,n,0.75,i,f)
}
midm <- 0
myn <- 0
roundno4 <- round(n/4)
round3no4 <- round(3*n/4)
for (i in 1:n) {
if ((x[i]>=qvalue1) & (x[i]<=qvalue3)){
midm = midm + x[i]
myn = myn + 1
}
}
midm = midm / myn
return(midm)
}
(arm <- mean(x))
sqrtn <- sqrt(length(x))
(armse <- sd(x) / sqrtn)
(armose <- arm / armse)
(geo <- geomean(x))
(har <- harmean(x))
(qua <- quamean(x))
(win <- winmean(x))
(tri <- trimean(x))
(midr <- midrange(x))
midm <- array(NA,dim=8)
for (j in 1:8) midm[j] <- midmean(x,j)
midm
bitmap(file='test1.png')
lb <- win[,1] - 2*win[,2]
ub <- win[,1] + 2*win[,2]
if ((ylimmin == '') | (ylimmax == '')) plot(win[,1],type='b',main=main, xlab='j', pch=19, ylab='Winsorized Mean(j/n)', ylim=c(min(lb),max(ub))) else plot(win[,1],type='l',main=main, xlab='j', pch=19, ylab='Winsorized Mean(j/n)', ylim=c(ylimmin,ylimmax))
lines(ub,lty=3)
lines(lb,lty=3)
grid()
dev.off()
bitmap(file='test2.png')
lb <- tri[,1] - 2*tri[,2]
ub <- tri[,1] + 2*tri[,2]
if ((ylimmin == '') | (ylimmax == '')) plot(tri[,1],type='b',main=main, xlab='j', pch=19, ylab='Trimmed Mean(j/n)', ylim=c(min(lb),max(ub))) else plot(tri[,1],type='l',main=main, xlab='j', pch=19, ylab='Trimmed Mean(j/n)', ylim=c(ylimmin,ylimmax))
lines(ub,lty=3)
lines(lb,lty=3)
grid()
dev.off()
load(file='createtable')
a<-table.start()
a<-table.row.start(a)
a<-table.element(a,'Central Tendency - Ungrouped Data',4,TRUE)
a<-table.row.end(a)
a<-table.row.start(a)
a<-table.element(a,'Measure',header=TRUE)
a<-table.element(a,'Value',header=TRUE)
a<-table.element(a,'S.E.',header=TRUE)
a<-table.element(a,'Value/S.E.',header=TRUE)
a<-table.row.end(a)
a<-table.row.start(a)
a<-table.element(a,hyperlink('arithmetic_mean.htm', 'Arithmetic Mean', 'click to view the definition of the Arithmetic Mean'),header=TRUE)
a<-table.element(a,arm)
a<-table.element(a,hyperlink('arithmetic_mean_standard_error.htm', armse, 'click to view the definition of the Standard Error of the Arithmetic Mean'))
a<-table.element(a,armose)
a<-table.row.end(a)
a<-table.row.start(a)
a<-table.element(a,hyperlink('geometric_mean.htm', 'Geometric Mean', 'click to view the definition of the Geometric Mean'),header=TRUE)
a<-table.element(a,geo)
a<-table.element(a,'')
a<-table.row.end(a)
a<-table.row.start(a)
a<-table.element(a,hyperlink('harmonic_mean.htm', 'Harmonic Mean', 'click to view the definition of the Harmonic Mean'),header=TRUE)
a<-table.element(a,har)
a<-table.element(a,'')
a<-table.row.end(a)
a<-table.row.start(a)
a<-table.element(a,hyperlink('quadratic_mean.htm', 'Quadratic Mean', 'click to view the definition of the Quadratic Mean'),header=TRUE)
a<-table.element(a,qua)
a<-table.element(a,'')
a<-table.row.end(a)
for (j in 1:length(win[,1])) {
a<-table.row.start(a)
mylabel <- paste('Winsorized Mean (',j)
mylabel <- paste(mylabel,'/')
mylabel <- paste(mylabel,length(win[,1]))
mylabel <- paste(mylabel,')')
a<-table.element(a,hyperlink('winsorized_mean.htm', mylabel, 'click to view the definition of the Winsorized Mean'),header=TRUE)
a<-table.element(a,win[j,1])
a<-table.element(a,win[j,2])
a<-table.element(a,win[j,1]/win[j,2])
a<-table.row.end(a)
}
for (j in 1:length(tri[,1])) {
a<-table.row.start(a)
mylabel <- paste('Trimmed Mean (',j)
mylabel <- paste(mylabel,'/')
mylabel <- paste(mylabel,length(tri[,1]))
mylabel <- paste(mylabel,')')
a<-table.element(a,hyperlink('arithmetic_mean.htm', mylabel, 'click to view the definition of the Trimmed Mean'),header=TRUE)
a<-table.element(a,tri[j,1])
a<-table.element(a,tri[j,2])
a<-table.element(a,tri[j,1]/tri[j,2])
a<-table.row.end(a)
}
a<-table.row.start(a)
a<-table.element(a,hyperlink('median_1.htm', 'Median', 'click to view the definition of the Median'),header=TRUE)
a<-table.element(a,median(x))
a<-table.element(a,'')
a<-table.row.end(a)
a<-table.row.start(a)
a<-table.element(a,hyperlink('midrange.htm', 'Midrange', 'click to view the definition of the Midrange'),header=TRUE)
a<-table.element(a,midr)
a<-table.element(a,'')
a<-table.row.end(a)
a<-table.row.start(a)
mymid <- hyperlink('midmean.htm', 'Midmean', 'click to view the definition of the Midmean')
mylabel <- paste(mymid,hyperlink('method_1.htm','Weighted Average at Xnp',''),sep=' - ')
a<-table.element(a,mylabel,header=TRUE)
a<-table.element(a,midm[1])
a<-table.element(a,'')
a<-table.row.end(a)
a<-table.row.start(a)
mymid <- hyperlink('midmean.htm', 'Midmean', 'click to view the definition of the Midmean')
mylabel <- paste(mymid,hyperlink('method_2.htm','Weighted Average at X(n+1)p',''),sep=' - ')
a<-table.element(a,mylabel,header=TRUE)
a<-table.element(a,midm[2])
a<-table.element(a,'')
a<-table.row.end(a)
a<-table.row.start(a)
mymid <- hyperlink('midmean.htm', 'Midmean', 'click to view the definition of the Midmean')
mylabel <- paste(mymid,hyperlink('method_3.htm','Empirical Distribution Function',''),sep=' - ')
a<-table.element(a,mylabel,header=TRUE)
a<-table.element(a,midm[3])
a<-table.element(a,'')
a<-table.row.end(a)
a<-table.row.start(a)
mymid <- hyperlink('midmean.htm', 'Midmean', 'click to view the definition of the Midmean')
mylabel <- paste(mymid,hyperlink('method_4.htm','Empirical Distribution Function - Averaging',''),sep=' - ')
a<-table.element(a,mylabel,header=TRUE)
a<-table.element(a,midm[4])
a<-table.element(a,'')
a<-table.row.end(a)
a<-table.row.start(a)
mymid <- hyperlink('midmean.htm', 'Midmean', 'click to view the definition of the Midmean')
mylabel <- paste(mymid,hyperlink('method_5.htm','Empirical Distribution Function - Interpolation',''),sep=' - ')
a<-table.element(a,mylabel,header=TRUE)
a<-table.element(a,midm[5])
a<-table.element(a,'')
a<-table.row.end(a)
a<-table.row.start(a)
mymid <- hyperlink('midmean.htm', 'Midmean', 'click to view the definition of the Midmean')
mylabel <- paste(mymid,hyperlink('method_6.htm','Closest Observation',''),sep=' - ')
a<-table.element(a,mylabel,header=TRUE)
a<-table.element(a,midm[6])
a<-table.element(a,'')
a<-table.row.end(a)
a<-table.row.start(a)
mymid <- hyperlink('midmean.htm', 'Midmean', 'click to view the definition of the Midmean')
mylabel <- paste(mymid,hyperlink('method_7.htm','True Basic - Statistics Graphics Toolkit',''),sep=' - ')
a<-table.element(a,mylabel,header=TRUE)
a<-table.element(a,midm[7])
a<-table.element(a,'')
a<-table.row.end(a)
a<-table.row.start(a)
mymid <- hyperlink('midmean.htm', 'Midmean', 'click to view the definition of the Midmean')
mylabel <- paste(mymid,hyperlink('method_8.htm','MS Excel (old versions)',''),sep=' - ')
a<-table.element(a,mylabel,header=TRUE)
a<-table.element(a,midm[8])
a<-table.element(a,'')
a<-table.row.end(a)
a<-table.row.start(a)
a<-table.element(a,'Number of observations',header=TRUE)
a<-table.element(a,length(x))
a<-table.element(a,'')
a<-table.row.end(a)
a<-table.end(a)
table.save(a,file='mytable.tab')