Free Statistics

of Irreproducible Research!

Author's title

Author*Unverified author*
R Software Modulerwasp_autocorrelation.wasp
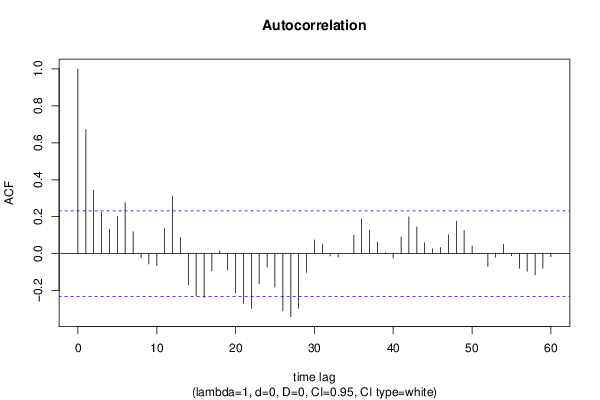
Title produced by software(Partial) Autocorrelation Function
Date of computationThu, 21 Nov 2013 16:40:14 -0500
Cite this page as followsStatistical Computations at FreeStatistics.org, Office for Research Development and Education, URL https://freestatistics.org/blog/index.php?v=date/2013/Nov/21/t1385070225eh2cyizsikmx04e.htm/, Retrieved Fri, 03 May 2024 08:00:35 +0000
Statistical Computations at FreeStatistics.org, Office for Research Development and Education, URL https://freestatistics.org/blog/index.php?pk=227422, Retrieved Fri, 03 May 2024 08:00:35 +0000
QR Codes:

Original text written by user:
IsPrivate?No (this computation is public)
User-defined keywords
Estimated Impact48
Family? (F = Feedback message, R = changed R code, M = changed R Module, P = changed Parameters, D = changed Data)
-       [(Partial) Autocorrelation Function] [] [2013-11-21 21:40:14] [98a545f74f3e64fcb7a2edd9d5a425e5] [Current]
Feedback Forum

Post a new message
Dataseries X:
104.78
105.56
107.95
107.11
107.47
107.06
99.71
99.6
107.19
107.26
113.24
113.52
110.48
111.41
115.5
118.32
118.42
117.5
110.23
109.19
118.41
118.3
116.1
114.11
113.41
114.33
116.61
123.64
123.77
123.39
116.03
114.95
123.4
123.53
114.45
114.26
114.35
112.77
115.31
114.93
116.38
115.07
105
103.43
114.52
115.04
117.16
115
116.22
112.92
116.56
114.32
113.22
111.56
103.87
102.85
112.27
112.76
118.55
122.73
115.44
116.97
119.84
116.37
117.23
115.58
109.82
108.46
116.54
117.49
122.87
127.1


Summary of computational transaction
Raw Inputview raw input (R code)
Raw Outputview raw output of R engine
Computing time4 seconds
R Server'George Udny Yule' @ yule.wessa.net

\begin{tabular}{lllllllll}
\hline
Summary of computational transaction \tabularnewline
Raw Input & view raw input (R code)  \tabularnewline
Raw Output & view raw output of R engine  \tabularnewline
Computing time & 4 seconds \tabularnewline
R Server & 'George Udny Yule' @ yule.wessa.net \tabularnewline
\hline
\end{tabular}
%Source: https://freestatistics.org/blog/index.php?pk=227422&T=0

[TABLE]
[ROW][C]Summary of computational transaction[/C][/ROW]
[ROW][C]Raw Input[/C][C]view raw input (R code) [/C][/ROW]
[ROW][C]Raw Output[/C][C]view raw output of R engine [/C][/ROW]
[ROW][C]Computing time[/C][C]4 seconds[/C][/ROW]
[ROW][C]R Server[/C][C]'George Udny Yule' @ yule.wessa.net[/C][/ROW]
[/TABLE]
Source: https://freestatistics.org/blog/index.php?pk=227422&T=0

Globally Unique Identifier (entire table): ba.freestatistics.org/blog/index.php?pk=227422&T=0

As an alternative you can also use a QR Code:  

The GUIDs for individual cells are displayed in the table below:

Summary of computational transaction
Raw Inputview raw input (R code)
Raw Outputview raw output of R engine
Computing time4 seconds
R Server'George Udny Yule' @ yule.wessa.net


Autocorrelation Function
Time lag kACF(k)T-STATP-value
10.6722835.70450
20.3437792.91710.002355
30.2234411.8960.030989
40.1322421.12210.132772
50.2021811.71560.045272
60.275272.33570.011147
70.1179431.00080.160143
8-0.022638-0.19210.424105
9-0.055356-0.46970.319991
10-0.064379-0.54630.293283
110.1359151.15330.126306
120.3114592.64280.005041
130.0864250.73330.232865
14-0.168415-1.4290.078657
15-0.229797-1.94990.027542
16-0.2365-2.00680.024265
17-0.094509-0.80190.212613
180.0144530.12260.451369
19-0.088733-0.75290.226975
20-0.212515-1.80330.037766
21-0.268563-2.27880.012822
22-0.296169-2.51310.007104
23-0.162633-1.380.08593
24-0.072601-0.6160.269905
25-0.180561-1.53210.064938
26-0.30913-2.62310.005315
27-0.341138-2.89470.00251
28-0.295831-2.51020.007157
29-0.102527-0.870.193603
300.0739730.62770.266098
310.0519010.44040.330486
32-0.012101-0.10270.45925
33-0.017937-0.15220.439726
34-0.000233-0.0020.499214
350.1006370.85390.197987
360.1875371.59130.057961
370.1274441.08140.141564
380.0630070.53460.297275
390.0052620.04470.482255
40-0.024093-0.20440.419294
410.0897490.76150.224409
420.1993131.69120.047559
430.1450471.23080.111209
440.0590970.50150.308789
450.0258420.21930.413528
460.0327050.27750.39109
470.1019640.86520.194903
480.1752891.48740.070641
490.1256611.06630.144933
500.0415990.3530.362569
51-0.000483-0.00410.498371
52-0.069036-0.58580.279924
53-0.018993-0.16120.436208
540.0506520.42980.334315
55-0.011448-0.09710.461442
56-0.078303-0.66440.254271
57-0.095702-0.81210.209717
58-0.114909-0.9750.166403
59-0.078433-0.66550.25392
60-0.017318-0.14690.441791

\begin{tabular}{lllllllll}
\hline
Autocorrelation Function \tabularnewline
Time lag k & ACF(k) & T-STAT & P-value \tabularnewline
1 & 0.672283 & 5.7045 & 0 \tabularnewline
2 & 0.343779 & 2.9171 & 0.002355 \tabularnewline
3 & 0.223441 & 1.896 & 0.030989 \tabularnewline
4 & 0.132242 & 1.1221 & 0.132772 \tabularnewline
5 & 0.202181 & 1.7156 & 0.045272 \tabularnewline
6 & 0.27527 & 2.3357 & 0.011147 \tabularnewline
7 & 0.117943 & 1.0008 & 0.160143 \tabularnewline
8 & -0.022638 & -0.1921 & 0.424105 \tabularnewline
9 & -0.055356 & -0.4697 & 0.319991 \tabularnewline
10 & -0.064379 & -0.5463 & 0.293283 \tabularnewline
11 & 0.135915 & 1.1533 & 0.126306 \tabularnewline
12 & 0.311459 & 2.6428 & 0.005041 \tabularnewline
13 & 0.086425 & 0.7333 & 0.232865 \tabularnewline
14 & -0.168415 & -1.429 & 0.078657 \tabularnewline
15 & -0.229797 & -1.9499 & 0.027542 \tabularnewline
16 & -0.2365 & -2.0068 & 0.024265 \tabularnewline
17 & -0.094509 & -0.8019 & 0.212613 \tabularnewline
18 & 0.014453 & 0.1226 & 0.451369 \tabularnewline
19 & -0.088733 & -0.7529 & 0.226975 \tabularnewline
20 & -0.212515 & -1.8033 & 0.037766 \tabularnewline
21 & -0.268563 & -2.2788 & 0.012822 \tabularnewline
22 & -0.296169 & -2.5131 & 0.007104 \tabularnewline
23 & -0.162633 & -1.38 & 0.08593 \tabularnewline
24 & -0.072601 & -0.616 & 0.269905 \tabularnewline
25 & -0.180561 & -1.5321 & 0.064938 \tabularnewline
26 & -0.30913 & -2.6231 & 0.005315 \tabularnewline
27 & -0.341138 & -2.8947 & 0.00251 \tabularnewline
28 & -0.295831 & -2.5102 & 0.007157 \tabularnewline
29 & -0.102527 & -0.87 & 0.193603 \tabularnewline
30 & 0.073973 & 0.6277 & 0.266098 \tabularnewline
31 & 0.051901 & 0.4404 & 0.330486 \tabularnewline
32 & -0.012101 & -0.1027 & 0.45925 \tabularnewline
33 & -0.017937 & -0.1522 & 0.439726 \tabularnewline
34 & -0.000233 & -0.002 & 0.499214 \tabularnewline
35 & 0.100637 & 0.8539 & 0.197987 \tabularnewline
36 & 0.187537 & 1.5913 & 0.057961 \tabularnewline
37 & 0.127444 & 1.0814 & 0.141564 \tabularnewline
38 & 0.063007 & 0.5346 & 0.297275 \tabularnewline
39 & 0.005262 & 0.0447 & 0.482255 \tabularnewline
40 & -0.024093 & -0.2044 & 0.419294 \tabularnewline
41 & 0.089749 & 0.7615 & 0.224409 \tabularnewline
42 & 0.199313 & 1.6912 & 0.047559 \tabularnewline
43 & 0.145047 & 1.2308 & 0.111209 \tabularnewline
44 & 0.059097 & 0.5015 & 0.308789 \tabularnewline
45 & 0.025842 & 0.2193 & 0.413528 \tabularnewline
46 & 0.032705 & 0.2775 & 0.39109 \tabularnewline
47 & 0.101964 & 0.8652 & 0.194903 \tabularnewline
48 & 0.175289 & 1.4874 & 0.070641 \tabularnewline
49 & 0.125661 & 1.0663 & 0.144933 \tabularnewline
50 & 0.041599 & 0.353 & 0.362569 \tabularnewline
51 & -0.000483 & -0.0041 & 0.498371 \tabularnewline
52 & -0.069036 & -0.5858 & 0.279924 \tabularnewline
53 & -0.018993 & -0.1612 & 0.436208 \tabularnewline
54 & 0.050652 & 0.4298 & 0.334315 \tabularnewline
55 & -0.011448 & -0.0971 & 0.461442 \tabularnewline
56 & -0.078303 & -0.6644 & 0.254271 \tabularnewline
57 & -0.095702 & -0.8121 & 0.209717 \tabularnewline
58 & -0.114909 & -0.975 & 0.166403 \tabularnewline
59 & -0.078433 & -0.6655 & 0.25392 \tabularnewline
60 & -0.017318 & -0.1469 & 0.441791 \tabularnewline
\hline
\end{tabular}
%Source: https://freestatistics.org/blog/index.php?pk=227422&T=1

[TABLE]
[ROW][C]Autocorrelation Function[/C][/ROW]
[ROW][C]Time lag k[/C][C]ACF(k)[/C][C]T-STAT[/C][C]P-value[/C][/ROW]
[ROW][C]1[/C][C]0.672283[/C][C]5.7045[/C][C]0[/C][/ROW]
[ROW][C]2[/C][C]0.343779[/C][C]2.9171[/C][C]0.002355[/C][/ROW]
[ROW][C]3[/C][C]0.223441[/C][C]1.896[/C][C]0.030989[/C][/ROW]
[ROW][C]4[/C][C]0.132242[/C][C]1.1221[/C][C]0.132772[/C][/ROW]
[ROW][C]5[/C][C]0.202181[/C][C]1.7156[/C][C]0.045272[/C][/ROW]
[ROW][C]6[/C][C]0.27527[/C][C]2.3357[/C][C]0.011147[/C][/ROW]
[ROW][C]7[/C][C]0.117943[/C][C]1.0008[/C][C]0.160143[/C][/ROW]
[ROW][C]8[/C][C]-0.022638[/C][C]-0.1921[/C][C]0.424105[/C][/ROW]
[ROW][C]9[/C][C]-0.055356[/C][C]-0.4697[/C][C]0.319991[/C][/ROW]
[ROW][C]10[/C][C]-0.064379[/C][C]-0.5463[/C][C]0.293283[/C][/ROW]
[ROW][C]11[/C][C]0.135915[/C][C]1.1533[/C][C]0.126306[/C][/ROW]
[ROW][C]12[/C][C]0.311459[/C][C]2.6428[/C][C]0.005041[/C][/ROW]
[ROW][C]13[/C][C]0.086425[/C][C]0.7333[/C][C]0.232865[/C][/ROW]
[ROW][C]14[/C][C]-0.168415[/C][C]-1.429[/C][C]0.078657[/C][/ROW]
[ROW][C]15[/C][C]-0.229797[/C][C]-1.9499[/C][C]0.027542[/C][/ROW]
[ROW][C]16[/C][C]-0.2365[/C][C]-2.0068[/C][C]0.024265[/C][/ROW]
[ROW][C]17[/C][C]-0.094509[/C][C]-0.8019[/C][C]0.212613[/C][/ROW]
[ROW][C]18[/C][C]0.014453[/C][C]0.1226[/C][C]0.451369[/C][/ROW]
[ROW][C]19[/C][C]-0.088733[/C][C]-0.7529[/C][C]0.226975[/C][/ROW]
[ROW][C]20[/C][C]-0.212515[/C][C]-1.8033[/C][C]0.037766[/C][/ROW]
[ROW][C]21[/C][C]-0.268563[/C][C]-2.2788[/C][C]0.012822[/C][/ROW]
[ROW][C]22[/C][C]-0.296169[/C][C]-2.5131[/C][C]0.007104[/C][/ROW]
[ROW][C]23[/C][C]-0.162633[/C][C]-1.38[/C][C]0.08593[/C][/ROW]
[ROW][C]24[/C][C]-0.072601[/C][C]-0.616[/C][C]0.269905[/C][/ROW]
[ROW][C]25[/C][C]-0.180561[/C][C]-1.5321[/C][C]0.064938[/C][/ROW]
[ROW][C]26[/C][C]-0.30913[/C][C]-2.6231[/C][C]0.005315[/C][/ROW]
[ROW][C]27[/C][C]-0.341138[/C][C]-2.8947[/C][C]0.00251[/C][/ROW]
[ROW][C]28[/C][C]-0.295831[/C][C]-2.5102[/C][C]0.007157[/C][/ROW]
[ROW][C]29[/C][C]-0.102527[/C][C]-0.87[/C][C]0.193603[/C][/ROW]
[ROW][C]30[/C][C]0.073973[/C][C]0.6277[/C][C]0.266098[/C][/ROW]
[ROW][C]31[/C][C]0.051901[/C][C]0.4404[/C][C]0.330486[/C][/ROW]
[ROW][C]32[/C][C]-0.012101[/C][C]-0.1027[/C][C]0.45925[/C][/ROW]
[ROW][C]33[/C][C]-0.017937[/C][C]-0.1522[/C][C]0.439726[/C][/ROW]
[ROW][C]34[/C][C]-0.000233[/C][C]-0.002[/C][C]0.499214[/C][/ROW]
[ROW][C]35[/C][C]0.100637[/C][C]0.8539[/C][C]0.197987[/C][/ROW]
[ROW][C]36[/C][C]0.187537[/C][C]1.5913[/C][C]0.057961[/C][/ROW]
[ROW][C]37[/C][C]0.127444[/C][C]1.0814[/C][C]0.141564[/C][/ROW]
[ROW][C]38[/C][C]0.063007[/C][C]0.5346[/C][C]0.297275[/C][/ROW]
[ROW][C]39[/C][C]0.005262[/C][C]0.0447[/C][C]0.482255[/C][/ROW]
[ROW][C]40[/C][C]-0.024093[/C][C]-0.2044[/C][C]0.419294[/C][/ROW]
[ROW][C]41[/C][C]0.089749[/C][C]0.7615[/C][C]0.224409[/C][/ROW]
[ROW][C]42[/C][C]0.199313[/C][C]1.6912[/C][C]0.047559[/C][/ROW]
[ROW][C]43[/C][C]0.145047[/C][C]1.2308[/C][C]0.111209[/C][/ROW]
[ROW][C]44[/C][C]0.059097[/C][C]0.5015[/C][C]0.308789[/C][/ROW]
[ROW][C]45[/C][C]0.025842[/C][C]0.2193[/C][C]0.413528[/C][/ROW]
[ROW][C]46[/C][C]0.032705[/C][C]0.2775[/C][C]0.39109[/C][/ROW]
[ROW][C]47[/C][C]0.101964[/C][C]0.8652[/C][C]0.194903[/C][/ROW]
[ROW][C]48[/C][C]0.175289[/C][C]1.4874[/C][C]0.070641[/C][/ROW]
[ROW][C]49[/C][C]0.125661[/C][C]1.0663[/C][C]0.144933[/C][/ROW]
[ROW][C]50[/C][C]0.041599[/C][C]0.353[/C][C]0.362569[/C][/ROW]
[ROW][C]51[/C][C]-0.000483[/C][C]-0.0041[/C][C]0.498371[/C][/ROW]
[ROW][C]52[/C][C]-0.069036[/C][C]-0.5858[/C][C]0.279924[/C][/ROW]
[ROW][C]53[/C][C]-0.018993[/C][C]-0.1612[/C][C]0.436208[/C][/ROW]
[ROW][C]54[/C][C]0.050652[/C][C]0.4298[/C][C]0.334315[/C][/ROW]
[ROW][C]55[/C][C]-0.011448[/C][C]-0.0971[/C][C]0.461442[/C][/ROW]
[ROW][C]56[/C][C]-0.078303[/C][C]-0.6644[/C][C]0.254271[/C][/ROW]
[ROW][C]57[/C][C]-0.095702[/C][C]-0.8121[/C][C]0.209717[/C][/ROW]
[ROW][C]58[/C][C]-0.114909[/C][C]-0.975[/C][C]0.166403[/C][/ROW]
[ROW][C]59[/C][C]-0.078433[/C][C]-0.6655[/C][C]0.25392[/C][/ROW]
[ROW][C]60[/C][C]-0.017318[/C][C]-0.1469[/C][C]0.441791[/C][/ROW]
[/TABLE]
Source: https://freestatistics.org/blog/index.php?pk=227422&T=1

Globally Unique Identifier (entire table): ba.freestatistics.org/blog/index.php?pk=227422&T=1

As an alternative you can also use a QR Code:  

The GUIDs for individual cells are displayed in the table below:

Autocorrelation Function
Time lag kACF(k)T-STATP-value
10.6722835.70450
20.3437792.91710.002355
30.2234411.8960.030989
40.1322421.12210.132772
50.2021811.71560.045272
60.275272.33570.011147
70.1179431.00080.160143
8-0.022638-0.19210.424105
9-0.055356-0.46970.319991
10-0.064379-0.54630.293283
110.1359151.15330.126306
120.3114592.64280.005041
130.0864250.73330.232865
14-0.168415-1.4290.078657
15-0.229797-1.94990.027542
16-0.2365-2.00680.024265
17-0.094509-0.80190.212613
180.0144530.12260.451369
19-0.088733-0.75290.226975
20-0.212515-1.80330.037766
21-0.268563-2.27880.012822
22-0.296169-2.51310.007104
23-0.162633-1.380.08593
24-0.072601-0.6160.269905
25-0.180561-1.53210.064938
26-0.30913-2.62310.005315
27-0.341138-2.89470.00251
28-0.295831-2.51020.007157
29-0.102527-0.870.193603
300.0739730.62770.266098
310.0519010.44040.330486
32-0.012101-0.10270.45925
33-0.017937-0.15220.439726
34-0.000233-0.0020.499214
350.1006370.85390.197987
360.1875371.59130.057961
370.1274441.08140.141564
380.0630070.53460.297275
390.0052620.04470.482255
40-0.024093-0.20440.419294
410.0897490.76150.224409
420.1993131.69120.047559
430.1450471.23080.111209
440.0590970.50150.308789
450.0258420.21930.413528
460.0327050.27750.39109
470.1019640.86520.194903
480.1752891.48740.070641
490.1256611.06630.144933
500.0415990.3530.362569
51-0.000483-0.00410.498371
52-0.069036-0.58580.279924
53-0.018993-0.16120.436208
540.0506520.42980.334315
55-0.011448-0.09710.461442
56-0.078303-0.66440.254271
57-0.095702-0.81210.209717
58-0.114909-0.9750.166403
59-0.078433-0.66550.25392
60-0.017318-0.14690.441791


Partial Autocorrelation Function
Time lag kPACF(k)T-STATP-value
10.6722835.70450
2-0.197406-1.6750.049132
30.150781.27940.10243
4-0.089476-0.75920.225097
50.294272.4970.007407
6-0.002845-0.02410.490405
7-0.228872-1.9420.028022
8-0.011661-0.0990.460726
90.0051120.04340.48276
100.0089960.07630.469684
110.3213382.72660.004015
120.0536280.4550.325223
13-0.432668-3.67130.00023
14-0.161976-1.37440.086789
150.0906840.76950.222063
160.0203610.17280.431658
170.0285620.24240.404595
18-0.072287-0.61340.270781
19-0.010267-0.08710.465408
20-0.103765-0.88050.190765
21-0.053387-0.4530.325953
22-0.081785-0.6940.244968
23-0.089304-0.75780.225531
24-0.169686-1.43980.077124
250.1485011.26010.105857
26-0.000293-0.00250.499012
27-0.078737-0.66810.253102
28-0.071568-0.60730.27279
290.1251091.06160.145985
300.1197631.01620.156463
31-0.033853-0.28720.387373
32-0.006151-0.05220.479261
330.1316591.11720.13382
34-0.017761-0.15070.440313
35-0.031529-0.26750.394914
360.075630.64170.26154
37-0.024509-0.2080.417922
380.0239120.20290.419893
39-0.033987-0.28840.386938
40-0.032906-0.27920.39044
41-0.01586-0.13460.44666
42-0.065619-0.55680.289698
430.0261360.22180.412561
44-0.002041-0.01730.493114
45-0.024684-0.20940.417345
460.0269320.22850.409942
470.0179070.15190.439826
480.0136680.1160.453998
49-0.100598-0.85360.198077
50-0.10799-0.91630.181278
510.1532111.30.098868
52-0.091015-0.77230.221235
53-0.021956-0.18630.426365
54-0.023365-0.19830.421702
550.0320080.27160.393355
560.0490990.41660.339098
570.0418840.35540.361665
58-0.03814-0.32360.373578
59-0.081915-0.69510.244624
600.005370.04560.481892

\begin{tabular}{lllllllll}
\hline
Partial Autocorrelation Function \tabularnewline
Time lag k & PACF(k) & T-STAT & P-value \tabularnewline
1 & 0.672283 & 5.7045 & 0 \tabularnewline
2 & -0.197406 & -1.675 & 0.049132 \tabularnewline
3 & 0.15078 & 1.2794 & 0.10243 \tabularnewline
4 & -0.089476 & -0.7592 & 0.225097 \tabularnewline
5 & 0.29427 & 2.497 & 0.007407 \tabularnewline
6 & -0.002845 & -0.0241 & 0.490405 \tabularnewline
7 & -0.228872 & -1.942 & 0.028022 \tabularnewline
8 & -0.011661 & -0.099 & 0.460726 \tabularnewline
9 & 0.005112 & 0.0434 & 0.48276 \tabularnewline
10 & 0.008996 & 0.0763 & 0.469684 \tabularnewline
11 & 0.321338 & 2.7266 & 0.004015 \tabularnewline
12 & 0.053628 & 0.455 & 0.325223 \tabularnewline
13 & -0.432668 & -3.6713 & 0.00023 \tabularnewline
14 & -0.161976 & -1.3744 & 0.086789 \tabularnewline
15 & 0.090684 & 0.7695 & 0.222063 \tabularnewline
16 & 0.020361 & 0.1728 & 0.431658 \tabularnewline
17 & 0.028562 & 0.2424 & 0.404595 \tabularnewline
18 & -0.072287 & -0.6134 & 0.270781 \tabularnewline
19 & -0.010267 & -0.0871 & 0.465408 \tabularnewline
20 & -0.103765 & -0.8805 & 0.190765 \tabularnewline
21 & -0.053387 & -0.453 & 0.325953 \tabularnewline
22 & -0.081785 & -0.694 & 0.244968 \tabularnewline
23 & -0.089304 & -0.7578 & 0.225531 \tabularnewline
24 & -0.169686 & -1.4398 & 0.077124 \tabularnewline
25 & 0.148501 & 1.2601 & 0.105857 \tabularnewline
26 & -0.000293 & -0.0025 & 0.499012 \tabularnewline
27 & -0.078737 & -0.6681 & 0.253102 \tabularnewline
28 & -0.071568 & -0.6073 & 0.27279 \tabularnewline
29 & 0.125109 & 1.0616 & 0.145985 \tabularnewline
30 & 0.119763 & 1.0162 & 0.156463 \tabularnewline
31 & -0.033853 & -0.2872 & 0.387373 \tabularnewline
32 & -0.006151 & -0.0522 & 0.479261 \tabularnewline
33 & 0.131659 & 1.1172 & 0.13382 \tabularnewline
34 & -0.017761 & -0.1507 & 0.440313 \tabularnewline
35 & -0.031529 & -0.2675 & 0.394914 \tabularnewline
36 & 0.07563 & 0.6417 & 0.26154 \tabularnewline
37 & -0.024509 & -0.208 & 0.417922 \tabularnewline
38 & 0.023912 & 0.2029 & 0.419893 \tabularnewline
39 & -0.033987 & -0.2884 & 0.386938 \tabularnewline
40 & -0.032906 & -0.2792 & 0.39044 \tabularnewline
41 & -0.01586 & -0.1346 & 0.44666 \tabularnewline
42 & -0.065619 & -0.5568 & 0.289698 \tabularnewline
43 & 0.026136 & 0.2218 & 0.412561 \tabularnewline
44 & -0.002041 & -0.0173 & 0.493114 \tabularnewline
45 & -0.024684 & -0.2094 & 0.417345 \tabularnewline
46 & 0.026932 & 0.2285 & 0.409942 \tabularnewline
47 & 0.017907 & 0.1519 & 0.439826 \tabularnewline
48 & 0.013668 & 0.116 & 0.453998 \tabularnewline
49 & -0.100598 & -0.8536 & 0.198077 \tabularnewline
50 & -0.10799 & -0.9163 & 0.181278 \tabularnewline
51 & 0.153211 & 1.3 & 0.098868 \tabularnewline
52 & -0.091015 & -0.7723 & 0.221235 \tabularnewline
53 & -0.021956 & -0.1863 & 0.426365 \tabularnewline
54 & -0.023365 & -0.1983 & 0.421702 \tabularnewline
55 & 0.032008 & 0.2716 & 0.393355 \tabularnewline
56 & 0.049099 & 0.4166 & 0.339098 \tabularnewline
57 & 0.041884 & 0.3554 & 0.361665 \tabularnewline
58 & -0.03814 & -0.3236 & 0.373578 \tabularnewline
59 & -0.081915 & -0.6951 & 0.244624 \tabularnewline
60 & 0.00537 & 0.0456 & 0.481892 \tabularnewline
\hline
\end{tabular}
%Source: https://freestatistics.org/blog/index.php?pk=227422&T=2

[TABLE]
[ROW][C]Partial Autocorrelation Function[/C][/ROW]
[ROW][C]Time lag k[/C][C]PACF(k)[/C][C]T-STAT[/C][C]P-value[/C][/ROW]
[ROW][C]1[/C][C]0.672283[/C][C]5.7045[/C][C]0[/C][/ROW]
[ROW][C]2[/C][C]-0.197406[/C][C]-1.675[/C][C]0.049132[/C][/ROW]
[ROW][C]3[/C][C]0.15078[/C][C]1.2794[/C][C]0.10243[/C][/ROW]
[ROW][C]4[/C][C]-0.089476[/C][C]-0.7592[/C][C]0.225097[/C][/ROW]
[ROW][C]5[/C][C]0.29427[/C][C]2.497[/C][C]0.007407[/C][/ROW]
[ROW][C]6[/C][C]-0.002845[/C][C]-0.0241[/C][C]0.490405[/C][/ROW]
[ROW][C]7[/C][C]-0.228872[/C][C]-1.942[/C][C]0.028022[/C][/ROW]
[ROW][C]8[/C][C]-0.011661[/C][C]-0.099[/C][C]0.460726[/C][/ROW]
[ROW][C]9[/C][C]0.005112[/C][C]0.0434[/C][C]0.48276[/C][/ROW]
[ROW][C]10[/C][C]0.008996[/C][C]0.0763[/C][C]0.469684[/C][/ROW]
[ROW][C]11[/C][C]0.321338[/C][C]2.7266[/C][C]0.004015[/C][/ROW]
[ROW][C]12[/C][C]0.053628[/C][C]0.455[/C][C]0.325223[/C][/ROW]
[ROW][C]13[/C][C]-0.432668[/C][C]-3.6713[/C][C]0.00023[/C][/ROW]
[ROW][C]14[/C][C]-0.161976[/C][C]-1.3744[/C][C]0.086789[/C][/ROW]
[ROW][C]15[/C][C]0.090684[/C][C]0.7695[/C][C]0.222063[/C][/ROW]
[ROW][C]16[/C][C]0.020361[/C][C]0.1728[/C][C]0.431658[/C][/ROW]
[ROW][C]17[/C][C]0.028562[/C][C]0.2424[/C][C]0.404595[/C][/ROW]
[ROW][C]18[/C][C]-0.072287[/C][C]-0.6134[/C][C]0.270781[/C][/ROW]
[ROW][C]19[/C][C]-0.010267[/C][C]-0.0871[/C][C]0.465408[/C][/ROW]
[ROW][C]20[/C][C]-0.103765[/C][C]-0.8805[/C][C]0.190765[/C][/ROW]
[ROW][C]21[/C][C]-0.053387[/C][C]-0.453[/C][C]0.325953[/C][/ROW]
[ROW][C]22[/C][C]-0.081785[/C][C]-0.694[/C][C]0.244968[/C][/ROW]
[ROW][C]23[/C][C]-0.089304[/C][C]-0.7578[/C][C]0.225531[/C][/ROW]
[ROW][C]24[/C][C]-0.169686[/C][C]-1.4398[/C][C]0.077124[/C][/ROW]
[ROW][C]25[/C][C]0.148501[/C][C]1.2601[/C][C]0.105857[/C][/ROW]
[ROW][C]26[/C][C]-0.000293[/C][C]-0.0025[/C][C]0.499012[/C][/ROW]
[ROW][C]27[/C][C]-0.078737[/C][C]-0.6681[/C][C]0.253102[/C][/ROW]
[ROW][C]28[/C][C]-0.071568[/C][C]-0.6073[/C][C]0.27279[/C][/ROW]
[ROW][C]29[/C][C]0.125109[/C][C]1.0616[/C][C]0.145985[/C][/ROW]
[ROW][C]30[/C][C]0.119763[/C][C]1.0162[/C][C]0.156463[/C][/ROW]
[ROW][C]31[/C][C]-0.033853[/C][C]-0.2872[/C][C]0.387373[/C][/ROW]
[ROW][C]32[/C][C]-0.006151[/C][C]-0.0522[/C][C]0.479261[/C][/ROW]
[ROW][C]33[/C][C]0.131659[/C][C]1.1172[/C][C]0.13382[/C][/ROW]
[ROW][C]34[/C][C]-0.017761[/C][C]-0.1507[/C][C]0.440313[/C][/ROW]
[ROW][C]35[/C][C]-0.031529[/C][C]-0.2675[/C][C]0.394914[/C][/ROW]
[ROW][C]36[/C][C]0.07563[/C][C]0.6417[/C][C]0.26154[/C][/ROW]
[ROW][C]37[/C][C]-0.024509[/C][C]-0.208[/C][C]0.417922[/C][/ROW]
[ROW][C]38[/C][C]0.023912[/C][C]0.2029[/C][C]0.419893[/C][/ROW]
[ROW][C]39[/C][C]-0.033987[/C][C]-0.2884[/C][C]0.386938[/C][/ROW]
[ROW][C]40[/C][C]-0.032906[/C][C]-0.2792[/C][C]0.39044[/C][/ROW]
[ROW][C]41[/C][C]-0.01586[/C][C]-0.1346[/C][C]0.44666[/C][/ROW]
[ROW][C]42[/C][C]-0.065619[/C][C]-0.5568[/C][C]0.289698[/C][/ROW]
[ROW][C]43[/C][C]0.026136[/C][C]0.2218[/C][C]0.412561[/C][/ROW]
[ROW][C]44[/C][C]-0.002041[/C][C]-0.0173[/C][C]0.493114[/C][/ROW]
[ROW][C]45[/C][C]-0.024684[/C][C]-0.2094[/C][C]0.417345[/C][/ROW]
[ROW][C]46[/C][C]0.026932[/C][C]0.2285[/C][C]0.409942[/C][/ROW]
[ROW][C]47[/C][C]0.017907[/C][C]0.1519[/C][C]0.439826[/C][/ROW]
[ROW][C]48[/C][C]0.013668[/C][C]0.116[/C][C]0.453998[/C][/ROW]
[ROW][C]49[/C][C]-0.100598[/C][C]-0.8536[/C][C]0.198077[/C][/ROW]
[ROW][C]50[/C][C]-0.10799[/C][C]-0.9163[/C][C]0.181278[/C][/ROW]
[ROW][C]51[/C][C]0.153211[/C][C]1.3[/C][C]0.098868[/C][/ROW]
[ROW][C]52[/C][C]-0.091015[/C][C]-0.7723[/C][C]0.221235[/C][/ROW]
[ROW][C]53[/C][C]-0.021956[/C][C]-0.1863[/C][C]0.426365[/C][/ROW]
[ROW][C]54[/C][C]-0.023365[/C][C]-0.1983[/C][C]0.421702[/C][/ROW]
[ROW][C]55[/C][C]0.032008[/C][C]0.2716[/C][C]0.393355[/C][/ROW]
[ROW][C]56[/C][C]0.049099[/C][C]0.4166[/C][C]0.339098[/C][/ROW]
[ROW][C]57[/C][C]0.041884[/C][C]0.3554[/C][C]0.361665[/C][/ROW]
[ROW][C]58[/C][C]-0.03814[/C][C]-0.3236[/C][C]0.373578[/C][/ROW]
[ROW][C]59[/C][C]-0.081915[/C][C]-0.6951[/C][C]0.244624[/C][/ROW]
[ROW][C]60[/C][C]0.00537[/C][C]0.0456[/C][C]0.481892[/C][/ROW]
[/TABLE]
Source: https://freestatistics.org/blog/index.php?pk=227422&T=2

Globally Unique Identifier (entire table): ba.freestatistics.org/blog/index.php?pk=227422&T=2

As an alternative you can also use a QR Code:  

The GUIDs for individual cells are displayed in the table below:

Partial Autocorrelation Function
Time lag kPACF(k)T-STATP-value
10.6722835.70450
2-0.197406-1.6750.049132
30.150781.27940.10243
4-0.089476-0.75920.225097
50.294272.4970.007407
6-0.002845-0.02410.490405
7-0.228872-1.9420.028022
8-0.011661-0.0990.460726
90.0051120.04340.48276
100.0089960.07630.469684
110.3213382.72660.004015
120.0536280.4550.325223
13-0.432668-3.67130.00023
14-0.161976-1.37440.086789
150.0906840.76950.222063
160.0203610.17280.431658
170.0285620.24240.404595
18-0.072287-0.61340.270781
19-0.010267-0.08710.465408
20-0.103765-0.88050.190765
21-0.053387-0.4530.325953
22-0.081785-0.6940.244968
23-0.089304-0.75780.225531
24-0.169686-1.43980.077124
250.1485011.26010.105857
26-0.000293-0.00250.499012
27-0.078737-0.66810.253102
28-0.071568-0.60730.27279
290.1251091.06160.145985
300.1197631.01620.156463
31-0.033853-0.28720.387373
32-0.006151-0.05220.479261
330.1316591.11720.13382
34-0.017761-0.15070.440313
35-0.031529-0.26750.394914
360.075630.64170.26154
37-0.024509-0.2080.417922
380.0239120.20290.419893
39-0.033987-0.28840.386938
40-0.032906-0.27920.39044
41-0.01586-0.13460.44666
42-0.065619-0.55680.289698
430.0261360.22180.412561
44-0.002041-0.01730.493114
45-0.024684-0.20940.417345
460.0269320.22850.409942
470.0179070.15190.439826
480.0136680.1160.453998
49-0.100598-0.85360.198077
50-0.10799-0.91630.181278
510.1532111.30.098868
52-0.091015-0.77230.221235
53-0.021956-0.18630.426365
54-0.023365-0.19830.421702
550.0320080.27160.393355
560.0490990.41660.339098
570.0418840.35540.361665
58-0.03814-0.32360.373578
59-0.081915-0.69510.244624
600.005370.04560.481892


Parameters (Session):
par1 = 60 ; par2 = 1 ; par3 = 0 ; par4 = 0 ; par5 = 12 ; par6 = White Noise ; par7 = 0.95 ;
Parameters (R input):
par1 = 60 ; par2 = 1 ; par3 = 0 ; par4 = 0 ; par5 = 12 ; par6 = White Noise ; par7 = 0.95 ; par8 = ;
R code (references can be found in the software module):
if (par1 == 'Default') {
par1 = 10*log10(length(x))
} else {
par1 <- as.numeric(par1)
}
par2 <- as.numeric(par2)
par3 <- as.numeric(par3)
par4 <- as.numeric(par4)
par5 <- as.numeric(par5)
if (par6 == 'White Noise') par6 <- 'white' else par6 <- 'ma'
par7 <- as.numeric(par7)
if (par8 != '') par8 <- as.numeric(par8)
ox <- x
if (par8 == '') {
if (par2 == 0) {
x <- log(x)
} else {
x <- (x ^ par2 - 1) / par2
}
} else {
x <- log(x,base=par8)
}
if (par3 > 0) x <- diff(x,lag=1,difference=par3)
if (par4 > 0) x <- diff(x,lag=par5,difference=par4)
bitmap(file='picts.png')
op <- par(mfrow=c(2,1))
plot(ox,type='l',main='Original Time Series',xlab='time',ylab='value')
if (par8=='') {
mytitle <- paste('Working Time Series (lambda=',par2,', d=',par3,', D=',par4,')',sep='')
mysub <- paste('(lambda=',par2,', d=',par3,', D=',par4,', CI=', par7, ', CI type=',par6,')',sep='')
} else {
mytitle <- paste('Working Time Series (base=',par8,', d=',par3,', D=',par4,')',sep='')
mysub <- paste('(base=',par8,', d=',par3,', D=',par4,', CI=', par7, ', CI type=',par6,')',sep='')
}
plot(x,type='l', main=mytitle,xlab='time',ylab='value')
par(op)
dev.off()
bitmap(file='pic1.png')
racf <- acf(x, par1, main='Autocorrelation', xlab='time lag', ylab='ACF', ci.type=par6, ci=par7, sub=mysub)
dev.off()
bitmap(file='pic2.png')
rpacf <- pacf(x,par1,main='Partial Autocorrelation',xlab='lags',ylab='PACF',sub=mysub)
dev.off()
(myacf <- c(racf$acf))
(mypacf <- c(rpacf$acf))
lengthx <- length(x)
sqrtn <- sqrt(lengthx)
load(file='createtable')
a<-table.start()
a<-table.row.start(a)
a<-table.element(a,'Autocorrelation Function',4,TRUE)
a<-table.row.end(a)
a<-table.row.start(a)
a<-table.element(a,'Time lag k',header=TRUE)
a<-table.element(a,hyperlink('basics.htm','ACF(k)','click here for more information about the Autocorrelation Function'),header=TRUE)
a<-table.element(a,'T-STAT',header=TRUE)
a<-table.element(a,'P-value',header=TRUE)
a<-table.row.end(a)
for (i in 2:(par1+1)) {
a<-table.row.start(a)
a<-table.element(a,i-1,header=TRUE)
a<-table.element(a,round(myacf[i],6))
mytstat <- myacf[i]*sqrtn
a<-table.element(a,round(mytstat,4))
a<-table.element(a,round(1-pt(abs(mytstat),lengthx),6))
a<-table.row.end(a)
}
a<-table.end(a)
table.save(a,file='mytable.tab')
a<-table.start()
a<-table.row.start(a)
a<-table.element(a,'Partial Autocorrelation Function',4,TRUE)
a<-table.row.end(a)
a<-table.row.start(a)
a<-table.element(a,'Time lag k',header=TRUE)
a<-table.element(a,hyperlink('basics.htm','PACF(k)','click here for more information about the Partial Autocorrelation Function'),header=TRUE)
a<-table.element(a,'T-STAT',header=TRUE)
a<-table.element(a,'P-value',header=TRUE)
a<-table.row.end(a)
for (i in 1:par1) {
a<-table.row.start(a)
a<-table.element(a,i,header=TRUE)
a<-table.element(a,round(mypacf[i],6))
mytstat <- mypacf[i]*sqrtn
a<-table.element(a,round(mytstat,4))
a<-table.element(a,round(1-pt(abs(mytstat),lengthx),6))
a<-table.row.end(a)
}
a<-table.end(a)
table.save(a,file='mytable1.tab')