Free Statistics

of Irreproducible Research!

Author's title

Author*Unverified author*
R Software Modulerwasp_autocorrelation.wasp
Title produced by software(Partial) Autocorrelation Function
Date of computationThu, 21 Nov 2013 12:21:46 -0500
Cite this page as followsStatistical Computations at FreeStatistics.org, Office for Research Development and Education, URL https://freestatistics.org/blog/index.php?v=date/2013/Nov/21/t1385054539f9wrjvtwx3oknym.htm/, Retrieved Fri, 03 May 2024 13:15:21 +0000
Statistical Computations at FreeStatistics.org, Office for Research Development and Education, URL https://freestatistics.org/blog/index.php?pk=227314, Retrieved Fri, 03 May 2024 13:15:21 +0000
QR Codes:

Original text written by user:
IsPrivate?No (this computation is public)
User-defined keywords
Estimated Impact72
Family? (F = Feedback message, R = changed R code, M = changed R Module, P = changed Parameters, D = changed Data)
-       [(Partial) Autocorrelation Function] [] [2013-11-21 17:21:46] [f3e37d24265d1c1b6ba14664c97da4c0] [Current]
Feedback Forum

Post a new message
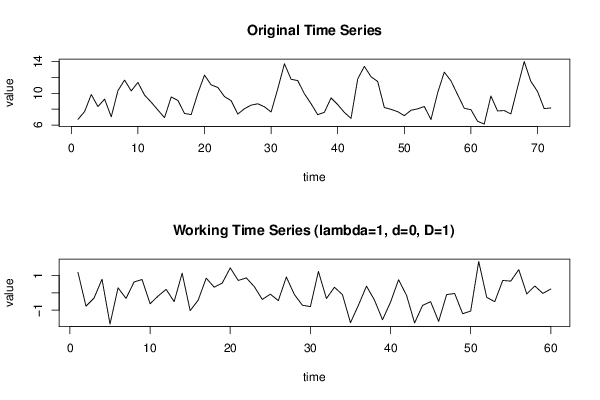
Dataseries X:
6.715
7.703
9.856
8.326
9.269
7.035
10.342
11.682
10.304
11.385
9.777
8.882
7.897
6.930
9.545
9.110
7.459
7.320
10.017
12.307
11.072
10.749
9.589
9.080
7.384
8.062
8.511
8.684
8.306
7.643
10.577
13.747
11.783
11.611
9.946
8.693
7.303
7.609
9.423
8.584
7.586
6.843
11.811
13.414
12.103
11.501
8.213
7.982
7.687
7.180
7.862
8.043
8.340
6.692
10.065
12.684
11.587
9.843
8.110
7.940
6.475
6.121
9.669
7.778
7.826
7.403
10.741
14.023
11.519
10.236
8.075
8.157


Summary of computational transaction
Raw Inputview raw input (R code)
Raw Outputview raw output of R engine
Computing time3 seconds
R Server'Sir Ronald Aylmer Fisher' @ fisher.wessa.net

\begin{tabular}{lllllllll}
\hline
Summary of computational transaction \tabularnewline
Raw Input & view raw input (R code)  \tabularnewline
Raw Output & view raw output of R engine  \tabularnewline
Computing time & 3 seconds \tabularnewline
R Server & 'Sir Ronald Aylmer Fisher' @ fisher.wessa.net \tabularnewline
\hline
\end{tabular}
%Source: https://freestatistics.org/blog/index.php?pk=227314&T=0

[TABLE]
[ROW][C]Summary of computational transaction[/C][/ROW]
[ROW][C]Raw Input[/C][C]view raw input (R code) [/C][/ROW]
[ROW][C]Raw Output[/C][C]view raw output of R engine [/C][/ROW]
[ROW][C]Computing time[/C][C]3 seconds[/C][/ROW]
[ROW][C]R Server[/C][C]'Sir Ronald Aylmer Fisher' @ fisher.wessa.net[/C][/ROW]
[/TABLE]
Source: https://freestatistics.org/blog/index.php?pk=227314&T=0

Globally Unique Identifier (entire table): ba.freestatistics.org/blog/index.php?pk=227314&T=0

As an alternative you can also use a QR Code:  

The GUIDs for individual cells are displayed in the table below:

Summary of computational transaction
Raw Inputview raw input (R code)
Raw Outputview raw output of R engine
Computing time3 seconds
R Server'Sir Ronald Aylmer Fisher' @ fisher.wessa.net


Autocorrelation Function
Time lag kACF(k)T-STATP-value
10.0362880.28110.389806
2-0.055034-0.42630.335711
30.2706112.09610.020148
40.1103940.85510.197947
50.0816080.63210.26485
60.0390650.30260.381621
70.0100910.07820.468977
8-0.017158-0.13290.447357
9-0.074735-0.57890.282414
100.1793411.38920.084958
110.0916660.710.240214
12-0.338898-2.62510.005487
130.0297270.23030.409334
140.1315281.01880.156192
15-0.194734-1.50840.068349
16-0.222447-1.72310.045014
17-0.076362-0.59150.278204
18-0.127827-0.99010.16304
19-0.029018-0.22480.411459
200.0326550.25290.400588
21-0.143632-1.11260.135165
22-0.158881-1.23070.111622
23-0.033895-0.26260.396898
240.0200310.15520.438609
25-0.074572-0.57760.282837
26-0.245168-1.89910.031184
27-0.031286-0.24230.404673
28-0.035083-0.27180.393373
29-0.068338-0.52930.299261
300.0393680.30490.380731
31-0.002697-0.02090.491701
32-0.045064-0.34910.364131
330.1321141.02340.155125
340.1051260.81430.209345
35-0.024782-0.1920.424211
360.0051520.03990.484151
370.110390.85510.197955
380.0238460.18470.427039
390.0103660.08030.468135
400.0242190.18760.42591
410.0149960.11620.453956
420.0019440.01510.494016
430.0073820.05720.477295
440.0357610.2770.391365
45-0.029009-0.22470.411486
46-0.073851-0.5720.284714
470.0989470.76640.223209
480.0058780.04550.481918

\begin{tabular}{lllllllll}
\hline
Autocorrelation Function \tabularnewline
Time lag k & ACF(k) & T-STAT & P-value \tabularnewline
1 & 0.036288 & 0.2811 & 0.389806 \tabularnewline
2 & -0.055034 & -0.4263 & 0.335711 \tabularnewline
3 & 0.270611 & 2.0961 & 0.020148 \tabularnewline
4 & 0.110394 & 0.8551 & 0.197947 \tabularnewline
5 & 0.081608 & 0.6321 & 0.26485 \tabularnewline
6 & 0.039065 & 0.3026 & 0.381621 \tabularnewline
7 & 0.010091 & 0.0782 & 0.468977 \tabularnewline
8 & -0.017158 & -0.1329 & 0.447357 \tabularnewline
9 & -0.074735 & -0.5789 & 0.282414 \tabularnewline
10 & 0.179341 & 1.3892 & 0.084958 \tabularnewline
11 & 0.091666 & 0.71 & 0.240214 \tabularnewline
12 & -0.338898 & -2.6251 & 0.005487 \tabularnewline
13 & 0.029727 & 0.2303 & 0.409334 \tabularnewline
14 & 0.131528 & 1.0188 & 0.156192 \tabularnewline
15 & -0.194734 & -1.5084 & 0.068349 \tabularnewline
16 & -0.222447 & -1.7231 & 0.045014 \tabularnewline
17 & -0.076362 & -0.5915 & 0.278204 \tabularnewline
18 & -0.127827 & -0.9901 & 0.16304 \tabularnewline
19 & -0.029018 & -0.2248 & 0.411459 \tabularnewline
20 & 0.032655 & 0.2529 & 0.400588 \tabularnewline
21 & -0.143632 & -1.1126 & 0.135165 \tabularnewline
22 & -0.158881 & -1.2307 & 0.111622 \tabularnewline
23 & -0.033895 & -0.2626 & 0.396898 \tabularnewline
24 & 0.020031 & 0.1552 & 0.438609 \tabularnewline
25 & -0.074572 & -0.5776 & 0.282837 \tabularnewline
26 & -0.245168 & -1.8991 & 0.031184 \tabularnewline
27 & -0.031286 & -0.2423 & 0.404673 \tabularnewline
28 & -0.035083 & -0.2718 & 0.393373 \tabularnewline
29 & -0.068338 & -0.5293 & 0.299261 \tabularnewline
30 & 0.039368 & 0.3049 & 0.380731 \tabularnewline
31 & -0.002697 & -0.0209 & 0.491701 \tabularnewline
32 & -0.045064 & -0.3491 & 0.364131 \tabularnewline
33 & 0.132114 & 1.0234 & 0.155125 \tabularnewline
34 & 0.105126 & 0.8143 & 0.209345 \tabularnewline
35 & -0.024782 & -0.192 & 0.424211 \tabularnewline
36 & 0.005152 & 0.0399 & 0.484151 \tabularnewline
37 & 0.11039 & 0.8551 & 0.197955 \tabularnewline
38 & 0.023846 & 0.1847 & 0.427039 \tabularnewline
39 & 0.010366 & 0.0803 & 0.468135 \tabularnewline
40 & 0.024219 & 0.1876 & 0.42591 \tabularnewline
41 & 0.014996 & 0.1162 & 0.453956 \tabularnewline
42 & 0.001944 & 0.0151 & 0.494016 \tabularnewline
43 & 0.007382 & 0.0572 & 0.477295 \tabularnewline
44 & 0.035761 & 0.277 & 0.391365 \tabularnewline
45 & -0.029009 & -0.2247 & 0.411486 \tabularnewline
46 & -0.073851 & -0.572 & 0.284714 \tabularnewline
47 & 0.098947 & 0.7664 & 0.223209 \tabularnewline
48 & 0.005878 & 0.0455 & 0.481918 \tabularnewline
\hline
\end{tabular}
%Source: https://freestatistics.org/blog/index.php?pk=227314&T=1

[TABLE]
[ROW][C]Autocorrelation Function[/C][/ROW]
[ROW][C]Time lag k[/C][C]ACF(k)[/C][C]T-STAT[/C][C]P-value[/C][/ROW]
[ROW][C]1[/C][C]0.036288[/C][C]0.2811[/C][C]0.389806[/C][/ROW]
[ROW][C]2[/C][C]-0.055034[/C][C]-0.4263[/C][C]0.335711[/C][/ROW]
[ROW][C]3[/C][C]0.270611[/C][C]2.0961[/C][C]0.020148[/C][/ROW]
[ROW][C]4[/C][C]0.110394[/C][C]0.8551[/C][C]0.197947[/C][/ROW]
[ROW][C]5[/C][C]0.081608[/C][C]0.6321[/C][C]0.26485[/C][/ROW]
[ROW][C]6[/C][C]0.039065[/C][C]0.3026[/C][C]0.381621[/C][/ROW]
[ROW][C]7[/C][C]0.010091[/C][C]0.0782[/C][C]0.468977[/C][/ROW]
[ROW][C]8[/C][C]-0.017158[/C][C]-0.1329[/C][C]0.447357[/C][/ROW]
[ROW][C]9[/C][C]-0.074735[/C][C]-0.5789[/C][C]0.282414[/C][/ROW]
[ROW][C]10[/C][C]0.179341[/C][C]1.3892[/C][C]0.084958[/C][/ROW]
[ROW][C]11[/C][C]0.091666[/C][C]0.71[/C][C]0.240214[/C][/ROW]
[ROW][C]12[/C][C]-0.338898[/C][C]-2.6251[/C][C]0.005487[/C][/ROW]
[ROW][C]13[/C][C]0.029727[/C][C]0.2303[/C][C]0.409334[/C][/ROW]
[ROW][C]14[/C][C]0.131528[/C][C]1.0188[/C][C]0.156192[/C][/ROW]
[ROW][C]15[/C][C]-0.194734[/C][C]-1.5084[/C][C]0.068349[/C][/ROW]
[ROW][C]16[/C][C]-0.222447[/C][C]-1.7231[/C][C]0.045014[/C][/ROW]
[ROW][C]17[/C][C]-0.076362[/C][C]-0.5915[/C][C]0.278204[/C][/ROW]
[ROW][C]18[/C][C]-0.127827[/C][C]-0.9901[/C][C]0.16304[/C][/ROW]
[ROW][C]19[/C][C]-0.029018[/C][C]-0.2248[/C][C]0.411459[/C][/ROW]
[ROW][C]20[/C][C]0.032655[/C][C]0.2529[/C][C]0.400588[/C][/ROW]
[ROW][C]21[/C][C]-0.143632[/C][C]-1.1126[/C][C]0.135165[/C][/ROW]
[ROW][C]22[/C][C]-0.158881[/C][C]-1.2307[/C][C]0.111622[/C][/ROW]
[ROW][C]23[/C][C]-0.033895[/C][C]-0.2626[/C][C]0.396898[/C][/ROW]
[ROW][C]24[/C][C]0.020031[/C][C]0.1552[/C][C]0.438609[/C][/ROW]
[ROW][C]25[/C][C]-0.074572[/C][C]-0.5776[/C][C]0.282837[/C][/ROW]
[ROW][C]26[/C][C]-0.245168[/C][C]-1.8991[/C][C]0.031184[/C][/ROW]
[ROW][C]27[/C][C]-0.031286[/C][C]-0.2423[/C][C]0.404673[/C][/ROW]
[ROW][C]28[/C][C]-0.035083[/C][C]-0.2718[/C][C]0.393373[/C][/ROW]
[ROW][C]29[/C][C]-0.068338[/C][C]-0.5293[/C][C]0.299261[/C][/ROW]
[ROW][C]30[/C][C]0.039368[/C][C]0.3049[/C][C]0.380731[/C][/ROW]
[ROW][C]31[/C][C]-0.002697[/C][C]-0.0209[/C][C]0.491701[/C][/ROW]
[ROW][C]32[/C][C]-0.045064[/C][C]-0.3491[/C][C]0.364131[/C][/ROW]
[ROW][C]33[/C][C]0.132114[/C][C]1.0234[/C][C]0.155125[/C][/ROW]
[ROW][C]34[/C][C]0.105126[/C][C]0.8143[/C][C]0.209345[/C][/ROW]
[ROW][C]35[/C][C]-0.024782[/C][C]-0.192[/C][C]0.424211[/C][/ROW]
[ROW][C]36[/C][C]0.005152[/C][C]0.0399[/C][C]0.484151[/C][/ROW]
[ROW][C]37[/C][C]0.11039[/C][C]0.8551[/C][C]0.197955[/C][/ROW]
[ROW][C]38[/C][C]0.023846[/C][C]0.1847[/C][C]0.427039[/C][/ROW]
[ROW][C]39[/C][C]0.010366[/C][C]0.0803[/C][C]0.468135[/C][/ROW]
[ROW][C]40[/C][C]0.024219[/C][C]0.1876[/C][C]0.42591[/C][/ROW]
[ROW][C]41[/C][C]0.014996[/C][C]0.1162[/C][C]0.453956[/C][/ROW]
[ROW][C]42[/C][C]0.001944[/C][C]0.0151[/C][C]0.494016[/C][/ROW]
[ROW][C]43[/C][C]0.007382[/C][C]0.0572[/C][C]0.477295[/C][/ROW]
[ROW][C]44[/C][C]0.035761[/C][C]0.277[/C][C]0.391365[/C][/ROW]
[ROW][C]45[/C][C]-0.029009[/C][C]-0.2247[/C][C]0.411486[/C][/ROW]
[ROW][C]46[/C][C]-0.073851[/C][C]-0.572[/C][C]0.284714[/C][/ROW]
[ROW][C]47[/C][C]0.098947[/C][C]0.7664[/C][C]0.223209[/C][/ROW]
[ROW][C]48[/C][C]0.005878[/C][C]0.0455[/C][C]0.481918[/C][/ROW]
[/TABLE]
Source: https://freestatistics.org/blog/index.php?pk=227314&T=1

Globally Unique Identifier (entire table): ba.freestatistics.org/blog/index.php?pk=227314&T=1

As an alternative you can also use a QR Code:  

The GUIDs for individual cells are displayed in the table below:

Autocorrelation Function
Time lag kACF(k)T-STATP-value
10.0362880.28110.389806
2-0.055034-0.42630.335711
30.2706112.09610.020148
40.1103940.85510.197947
50.0816080.63210.26485
60.0390650.30260.381621
70.0100910.07820.468977
8-0.017158-0.13290.447357
9-0.074735-0.57890.282414
100.1793411.38920.084958
110.0916660.710.240214
12-0.338898-2.62510.005487
130.0297270.23030.409334
140.1315281.01880.156192
15-0.194734-1.50840.068349
16-0.222447-1.72310.045014
17-0.076362-0.59150.278204
18-0.127827-0.99010.16304
19-0.029018-0.22480.411459
200.0326550.25290.400588
21-0.143632-1.11260.135165
22-0.158881-1.23070.111622
23-0.033895-0.26260.396898
240.0200310.15520.438609
25-0.074572-0.57760.282837
26-0.245168-1.89910.031184
27-0.031286-0.24230.404673
28-0.035083-0.27180.393373
29-0.068338-0.52930.299261
300.0393680.30490.380731
31-0.002697-0.02090.491701
32-0.045064-0.34910.364131
330.1321141.02340.155125
340.1051260.81430.209345
35-0.024782-0.1920.424211
360.0051520.03990.484151
370.110390.85510.197955
380.0238460.18470.427039
390.0103660.08030.468135
400.0242190.18760.42591
410.0149960.11620.453956
420.0019440.01510.494016
430.0073820.05720.477295
440.0357610.2770.391365
45-0.029009-0.22470.411486
46-0.073851-0.5720.284714
470.0989470.76640.223209
480.0058780.04550.481918


Partial Autocorrelation Function
Time lag kPACF(k)T-STATP-value
10.0362880.28110.389806
2-0.056425-0.43710.331817
30.2760092.1380.018301
40.0892740.69150.245956
50.1168170.90490.184579
6-0.030082-0.2330.408273
7-0.033372-0.25850.398454
8-0.0882-0.68320.248557
9-0.109342-0.8470.200191
100.1924211.49050.070667
110.1160020.89850.186243
12-0.296639-2.29780.012539
13-0.020892-0.16180.435992
140.0370870.28730.387446
15-0.107644-0.83380.203849
16-0.226812-1.75690.04202
17-0.067521-0.5230.301445
18-0.072786-0.56380.287496
190.1261280.9770.16625
200.1251260.96920.168162
21-0.142682-1.10520.136741
22-0.083844-0.64950.259263
23-0.014417-0.11170.455729
24-0.13307-1.03080.153396
25-0.02643-0.20470.419239
26-0.078973-0.61170.271518
27-0.00295-0.02280.490923
28-0.111621-0.86460.195348
290.0298640.23130.408925
30-0.004555-0.03530.485985
310.069570.53890.295979
320.0114940.0890.464677
33-0.003271-0.02530.489936
34-0.005536-0.04290.482969
350.0294690.22830.410107
360.0124410.09640.461774
370.0615660.47690.317586
38-0.151586-1.17420.122482
39-0.039129-0.30310.381433
40-0.079043-0.61230.271337
41-0.009781-0.07580.469931
42-0.083334-0.64550.260532
43-0.072691-0.56310.287745
44-0.108695-0.84190.20158
450.0226340.17530.430707
46-0.015237-0.1180.45322
470.0833430.64560.260509
48-0.009235-0.07150.471605

\begin{tabular}{lllllllll}
\hline
Partial Autocorrelation Function \tabularnewline
Time lag k & PACF(k) & T-STAT & P-value \tabularnewline
1 & 0.036288 & 0.2811 & 0.389806 \tabularnewline
2 & -0.056425 & -0.4371 & 0.331817 \tabularnewline
3 & 0.276009 & 2.138 & 0.018301 \tabularnewline
4 & 0.089274 & 0.6915 & 0.245956 \tabularnewline
5 & 0.116817 & 0.9049 & 0.184579 \tabularnewline
6 & -0.030082 & -0.233 & 0.408273 \tabularnewline
7 & -0.033372 & -0.2585 & 0.398454 \tabularnewline
8 & -0.0882 & -0.6832 & 0.248557 \tabularnewline
9 & -0.109342 & -0.847 & 0.200191 \tabularnewline
10 & 0.192421 & 1.4905 & 0.070667 \tabularnewline
11 & 0.116002 & 0.8985 & 0.186243 \tabularnewline
12 & -0.296639 & -2.2978 & 0.012539 \tabularnewline
13 & -0.020892 & -0.1618 & 0.435992 \tabularnewline
14 & 0.037087 & 0.2873 & 0.387446 \tabularnewline
15 & -0.107644 & -0.8338 & 0.203849 \tabularnewline
16 & -0.226812 & -1.7569 & 0.04202 \tabularnewline
17 & -0.067521 & -0.523 & 0.301445 \tabularnewline
18 & -0.072786 & -0.5638 & 0.287496 \tabularnewline
19 & 0.126128 & 0.977 & 0.16625 \tabularnewline
20 & 0.125126 & 0.9692 & 0.168162 \tabularnewline
21 & -0.142682 & -1.1052 & 0.136741 \tabularnewline
22 & -0.083844 & -0.6495 & 0.259263 \tabularnewline
23 & -0.014417 & -0.1117 & 0.455729 \tabularnewline
24 & -0.13307 & -1.0308 & 0.153396 \tabularnewline
25 & -0.02643 & -0.2047 & 0.419239 \tabularnewline
26 & -0.078973 & -0.6117 & 0.271518 \tabularnewline
27 & -0.00295 & -0.0228 & 0.490923 \tabularnewline
28 & -0.111621 & -0.8646 & 0.195348 \tabularnewline
29 & 0.029864 & 0.2313 & 0.408925 \tabularnewline
30 & -0.004555 & -0.0353 & 0.485985 \tabularnewline
31 & 0.06957 & 0.5389 & 0.295979 \tabularnewline
32 & 0.011494 & 0.089 & 0.464677 \tabularnewline
33 & -0.003271 & -0.0253 & 0.489936 \tabularnewline
34 & -0.005536 & -0.0429 & 0.482969 \tabularnewline
35 & 0.029469 & 0.2283 & 0.410107 \tabularnewline
36 & 0.012441 & 0.0964 & 0.461774 \tabularnewline
37 & 0.061566 & 0.4769 & 0.317586 \tabularnewline
38 & -0.151586 & -1.1742 & 0.122482 \tabularnewline
39 & -0.039129 & -0.3031 & 0.381433 \tabularnewline
40 & -0.079043 & -0.6123 & 0.271337 \tabularnewline
41 & -0.009781 & -0.0758 & 0.469931 \tabularnewline
42 & -0.083334 & -0.6455 & 0.260532 \tabularnewline
43 & -0.072691 & -0.5631 & 0.287745 \tabularnewline
44 & -0.108695 & -0.8419 & 0.20158 \tabularnewline
45 & 0.022634 & 0.1753 & 0.430707 \tabularnewline
46 & -0.015237 & -0.118 & 0.45322 \tabularnewline
47 & 0.083343 & 0.6456 & 0.260509 \tabularnewline
48 & -0.009235 & -0.0715 & 0.471605 \tabularnewline
\hline
\end{tabular}
%Source: https://freestatistics.org/blog/index.php?pk=227314&T=2

[TABLE]
[ROW][C]Partial Autocorrelation Function[/C][/ROW]
[ROW][C]Time lag k[/C][C]PACF(k)[/C][C]T-STAT[/C][C]P-value[/C][/ROW]
[ROW][C]1[/C][C]0.036288[/C][C]0.2811[/C][C]0.389806[/C][/ROW]
[ROW][C]2[/C][C]-0.056425[/C][C]-0.4371[/C][C]0.331817[/C][/ROW]
[ROW][C]3[/C][C]0.276009[/C][C]2.138[/C][C]0.018301[/C][/ROW]
[ROW][C]4[/C][C]0.089274[/C][C]0.6915[/C][C]0.245956[/C][/ROW]
[ROW][C]5[/C][C]0.116817[/C][C]0.9049[/C][C]0.184579[/C][/ROW]
[ROW][C]6[/C][C]-0.030082[/C][C]-0.233[/C][C]0.408273[/C][/ROW]
[ROW][C]7[/C][C]-0.033372[/C][C]-0.2585[/C][C]0.398454[/C][/ROW]
[ROW][C]8[/C][C]-0.0882[/C][C]-0.6832[/C][C]0.248557[/C][/ROW]
[ROW][C]9[/C][C]-0.109342[/C][C]-0.847[/C][C]0.200191[/C][/ROW]
[ROW][C]10[/C][C]0.192421[/C][C]1.4905[/C][C]0.070667[/C][/ROW]
[ROW][C]11[/C][C]0.116002[/C][C]0.8985[/C][C]0.186243[/C][/ROW]
[ROW][C]12[/C][C]-0.296639[/C][C]-2.2978[/C][C]0.012539[/C][/ROW]
[ROW][C]13[/C][C]-0.020892[/C][C]-0.1618[/C][C]0.435992[/C][/ROW]
[ROW][C]14[/C][C]0.037087[/C][C]0.2873[/C][C]0.387446[/C][/ROW]
[ROW][C]15[/C][C]-0.107644[/C][C]-0.8338[/C][C]0.203849[/C][/ROW]
[ROW][C]16[/C][C]-0.226812[/C][C]-1.7569[/C][C]0.04202[/C][/ROW]
[ROW][C]17[/C][C]-0.067521[/C][C]-0.523[/C][C]0.301445[/C][/ROW]
[ROW][C]18[/C][C]-0.072786[/C][C]-0.5638[/C][C]0.287496[/C][/ROW]
[ROW][C]19[/C][C]0.126128[/C][C]0.977[/C][C]0.16625[/C][/ROW]
[ROW][C]20[/C][C]0.125126[/C][C]0.9692[/C][C]0.168162[/C][/ROW]
[ROW][C]21[/C][C]-0.142682[/C][C]-1.1052[/C][C]0.136741[/C][/ROW]
[ROW][C]22[/C][C]-0.083844[/C][C]-0.6495[/C][C]0.259263[/C][/ROW]
[ROW][C]23[/C][C]-0.014417[/C][C]-0.1117[/C][C]0.455729[/C][/ROW]
[ROW][C]24[/C][C]-0.13307[/C][C]-1.0308[/C][C]0.153396[/C][/ROW]
[ROW][C]25[/C][C]-0.02643[/C][C]-0.2047[/C][C]0.419239[/C][/ROW]
[ROW][C]26[/C][C]-0.078973[/C][C]-0.6117[/C][C]0.271518[/C][/ROW]
[ROW][C]27[/C][C]-0.00295[/C][C]-0.0228[/C][C]0.490923[/C][/ROW]
[ROW][C]28[/C][C]-0.111621[/C][C]-0.8646[/C][C]0.195348[/C][/ROW]
[ROW][C]29[/C][C]0.029864[/C][C]0.2313[/C][C]0.408925[/C][/ROW]
[ROW][C]30[/C][C]-0.004555[/C][C]-0.0353[/C][C]0.485985[/C][/ROW]
[ROW][C]31[/C][C]0.06957[/C][C]0.5389[/C][C]0.295979[/C][/ROW]
[ROW][C]32[/C][C]0.011494[/C][C]0.089[/C][C]0.464677[/C][/ROW]
[ROW][C]33[/C][C]-0.003271[/C][C]-0.0253[/C][C]0.489936[/C][/ROW]
[ROW][C]34[/C][C]-0.005536[/C][C]-0.0429[/C][C]0.482969[/C][/ROW]
[ROW][C]35[/C][C]0.029469[/C][C]0.2283[/C][C]0.410107[/C][/ROW]
[ROW][C]36[/C][C]0.012441[/C][C]0.0964[/C][C]0.461774[/C][/ROW]
[ROW][C]37[/C][C]0.061566[/C][C]0.4769[/C][C]0.317586[/C][/ROW]
[ROW][C]38[/C][C]-0.151586[/C][C]-1.1742[/C][C]0.122482[/C][/ROW]
[ROW][C]39[/C][C]-0.039129[/C][C]-0.3031[/C][C]0.381433[/C][/ROW]
[ROW][C]40[/C][C]-0.079043[/C][C]-0.6123[/C][C]0.271337[/C][/ROW]
[ROW][C]41[/C][C]-0.009781[/C][C]-0.0758[/C][C]0.469931[/C][/ROW]
[ROW][C]42[/C][C]-0.083334[/C][C]-0.6455[/C][C]0.260532[/C][/ROW]
[ROW][C]43[/C][C]-0.072691[/C][C]-0.5631[/C][C]0.287745[/C][/ROW]
[ROW][C]44[/C][C]-0.108695[/C][C]-0.8419[/C][C]0.20158[/C][/ROW]
[ROW][C]45[/C][C]0.022634[/C][C]0.1753[/C][C]0.430707[/C][/ROW]
[ROW][C]46[/C][C]-0.015237[/C][C]-0.118[/C][C]0.45322[/C][/ROW]
[ROW][C]47[/C][C]0.083343[/C][C]0.6456[/C][C]0.260509[/C][/ROW]
[ROW][C]48[/C][C]-0.009235[/C][C]-0.0715[/C][C]0.471605[/C][/ROW]
[/TABLE]
Source: https://freestatistics.org/blog/index.php?pk=227314&T=2

Globally Unique Identifier (entire table): ba.freestatistics.org/blog/index.php?pk=227314&T=2

As an alternative you can also use a QR Code:  

The GUIDs for individual cells are displayed in the table below:

Partial Autocorrelation Function
Time lag kPACF(k)T-STATP-value
10.0362880.28110.389806
2-0.056425-0.43710.331817
30.2760092.1380.018301
40.0892740.69150.245956
50.1168170.90490.184579
6-0.030082-0.2330.408273
7-0.033372-0.25850.398454
8-0.0882-0.68320.248557
9-0.109342-0.8470.200191
100.1924211.49050.070667
110.1160020.89850.186243
12-0.296639-2.29780.012539
13-0.020892-0.16180.435992
140.0370870.28730.387446
15-0.107644-0.83380.203849
16-0.226812-1.75690.04202
17-0.067521-0.5230.301445
18-0.072786-0.56380.287496
190.1261280.9770.16625
200.1251260.96920.168162
21-0.142682-1.10520.136741
22-0.083844-0.64950.259263
23-0.014417-0.11170.455729
24-0.13307-1.03080.153396
25-0.02643-0.20470.419239
26-0.078973-0.61170.271518
27-0.00295-0.02280.490923
28-0.111621-0.86460.195348
290.0298640.23130.408925
30-0.004555-0.03530.485985
310.069570.53890.295979
320.0114940.0890.464677
33-0.003271-0.02530.489936
34-0.005536-0.04290.482969
350.0294690.22830.410107
360.0124410.09640.461774
370.0615660.47690.317586
38-0.151586-1.17420.122482
39-0.039129-0.30310.381433
40-0.079043-0.61230.271337
41-0.009781-0.07580.469931
42-0.083334-0.64550.260532
43-0.072691-0.56310.287745
44-0.108695-0.84190.20158
450.0226340.17530.430707
46-0.015237-0.1180.45322
470.0833430.64560.260509
48-0.009235-0.07150.471605


Parameters (Session):
par1 = 48 ; par2 = 1 ; par3 = 0 ; par4 = 1 ; par5 = 12 ; par6 = White Noise ; par7 = 0.95 ;
Parameters (R input):
par1 = 48 ; par2 = 1 ; par3 = 0 ; par4 = 1 ; par5 = 12 ; par6 = White Noise ; par7 = 0.95 ; par8 = ;
R code (references can be found in the software module):
par8 <- ''
par7 <- '0.95'
par6 <- 'White Noise'
par5 <- '12'
par4 <- '0'
par3 <- '0'
par2 <- '1'
par1 <- '48'
if (par1 == 'Default') {
par1 = 10*log10(length(x))
} else {
par1 <- as.numeric(par1)
}
par2 <- as.numeric(par2)
par3 <- as.numeric(par3)
par4 <- as.numeric(par4)
par5 <- as.numeric(par5)
if (par6 == 'White Noise') par6 <- 'white' else par6 <- 'ma'
par7 <- as.numeric(par7)
if (par8 != '') par8 <- as.numeric(par8)
ox <- x
if (par8 == '') {
if (par2 == 0) {
x <- log(x)
} else {
x <- (x ^ par2 - 1) / par2
}
} else {
x <- log(x,base=par8)
}
if (par3 > 0) x <- diff(x,lag=1,difference=par3)
if (par4 > 0) x <- diff(x,lag=par5,difference=par4)
bitmap(file='picts.png')
op <- par(mfrow=c(2,1))
plot(ox,type='l',main='Original Time Series',xlab='time',ylab='value')
if (par8=='') {
mytitle <- paste('Working Time Series (lambda=',par2,', d=',par3,', D=',par4,')',sep='')
mysub <- paste('(lambda=',par2,', d=',par3,', D=',par4,', CI=', par7, ', CI type=',par6,')',sep='')
} else {
mytitle <- paste('Working Time Series (base=',par8,', d=',par3,', D=',par4,')',sep='')
mysub <- paste('(base=',par8,', d=',par3,', D=',par4,', CI=', par7, ', CI type=',par6,')',sep='')
}
plot(x,type='l', main=mytitle,xlab='time',ylab='value')
par(op)
dev.off()
bitmap(file='pic1.png')
racf <- acf(x, par1, main='Autocorrelation', xlab='time lag', ylab='ACF', ci.type=par6, ci=par7, sub=mysub)
dev.off()
bitmap(file='pic2.png')
rpacf <- pacf(x,par1,main='Partial Autocorrelation',xlab='lags',ylab='PACF',sub=mysub)
dev.off()
(myacf <- c(racf$acf))
(mypacf <- c(rpacf$acf))
lengthx <- length(x)
sqrtn <- sqrt(lengthx)
load(file='createtable')
a<-table.start()
a<-table.row.start(a)
a<-table.element(a,'Autocorrelation Function',4,TRUE)
a<-table.row.end(a)
a<-table.row.start(a)
a<-table.element(a,'Time lag k',header=TRUE)
a<-table.element(a,hyperlink('basics.htm','ACF(k)','click here for more information about the Autocorrelation Function'),header=TRUE)
a<-table.element(a,'T-STAT',header=TRUE)
a<-table.element(a,'P-value',header=TRUE)
a<-table.row.end(a)
for (i in 2:(par1+1)) {
a<-table.row.start(a)
a<-table.element(a,i-1,header=TRUE)
a<-table.element(a,round(myacf[i],6))
mytstat <- myacf[i]*sqrtn
a<-table.element(a,round(mytstat,4))
a<-table.element(a,round(1-pt(abs(mytstat),lengthx),6))
a<-table.row.end(a)
}
a<-table.end(a)
table.save(a,file='mytable.tab')
a<-table.start()
a<-table.row.start(a)
a<-table.element(a,'Partial Autocorrelation Function',4,TRUE)
a<-table.row.end(a)
a<-table.row.start(a)
a<-table.element(a,'Time lag k',header=TRUE)
a<-table.element(a,hyperlink('basics.htm','PACF(k)','click here for more information about the Partial Autocorrelation Function'),header=TRUE)
a<-table.element(a,'T-STAT',header=TRUE)
a<-table.element(a,'P-value',header=TRUE)
a<-table.row.end(a)
for (i in 1:par1) {
a<-table.row.start(a)
a<-table.element(a,i,header=TRUE)
a<-table.element(a,round(mypacf[i],6))
mytstat <- mypacf[i]*sqrtn
a<-table.element(a,round(mytstat,4))
a<-table.element(a,round(1-pt(abs(mytstat),lengthx),6))
a<-table.row.end(a)
}
a<-table.end(a)
table.save(a,file='mytable1.tab')