Free Statistics

of Irreproducible Research!

Author's title

Author*Unverified author*
R Software Modulerwasp_autocorrelation.wasp
Title produced by software(Partial) Autocorrelation Function
Date of computationWed, 20 Nov 2013 13:26:21 -0500
Cite this page as followsStatistical Computations at FreeStatistics.org, Office for Research Development and Education, URL https://freestatistics.org/blog/index.php?v=date/2013/Nov/20/t1384972058c22y8qxlip6ysat.htm/, Retrieved Wed, 01 May 2024 13:37:17 +0000
Statistical Computations at FreeStatistics.org, Office for Research Development and Education, URL https://freestatistics.org/blog/index.php?pk=226702, Retrieved Wed, 01 May 2024 13:37:17 +0000
QR Codes:

Original text written by user:
IsPrivate?No (this computation is public)
User-defined keywords
Estimated Impact68
Family? (F = Feedback message, R = changed R code, M = changed R Module, P = changed Parameters, D = changed Data)
-       [(Partial) Autocorrelation Function] [] [2013-11-20 18:26:21] [3e2b14d12dd0cca2f2b67dfbdf2cdaf9] [Current]
Feedback Forum

Post a new message
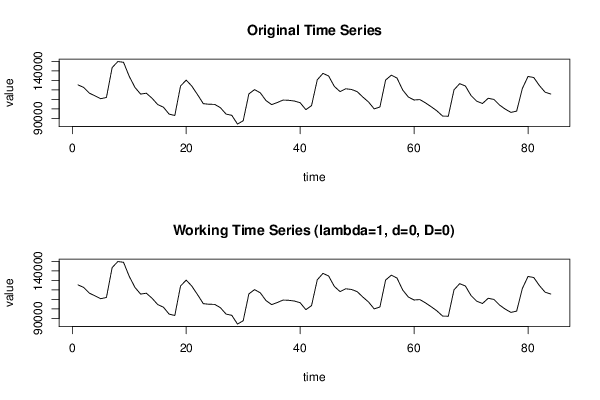
Dataseries X:
125326
122716
116615
113719
110737
112093
143565
149946
149147
134339
122683
115614
116566
111272
104609
101802
94542
93051
124129
130374
123946
114971
105531
104919
104782
101281
94545
93248
84031
87486
115867
120327
117008
108811
104519
106758
109337
109078
108293
106534
99197
103493
130676
137448
134704
123725
118277
121225
120528
118240
112514
107304
100001
102082
130455
135574
132540
119920
112454
109415
109843
106365
102304
97968
92462
92286
120092
126656
124144
114045
108120
105698
111203
110030
104009
99772
96301
97680
121563
134210
133111
124527
117589
115699


Summary of computational transaction
Raw Inputview raw input (R code)
Raw Outputview raw output of R engine
Computing time3 seconds
R Server'Sir Ronald Aylmer Fisher' @ fisher.wessa.net

\begin{tabular}{lllllllll}
\hline
Summary of computational transaction \tabularnewline
Raw Input & view raw input (R code)  \tabularnewline
Raw Output & view raw output of R engine  \tabularnewline
Computing time & 3 seconds \tabularnewline
R Server & 'Sir Ronald Aylmer Fisher' @ fisher.wessa.net \tabularnewline
\hline
\end{tabular}
%Source: https://freestatistics.org/blog/index.php?pk=226702&T=0

[TABLE]
[ROW][C]Summary of computational transaction[/C][/ROW]
[ROW][C]Raw Input[/C][C]view raw input (R code) [/C][/ROW]
[ROW][C]Raw Output[/C][C]view raw output of R engine [/C][/ROW]
[ROW][C]Computing time[/C][C]3 seconds[/C][/ROW]
[ROW][C]R Server[/C][C]'Sir Ronald Aylmer Fisher' @ fisher.wessa.net[/C][/ROW]
[/TABLE]
Source: https://freestatistics.org/blog/index.php?pk=226702&T=0

Globally Unique Identifier (entire table): ba.freestatistics.org/blog/index.php?pk=226702&T=0

As an alternative you can also use a QR Code:  

The GUIDs for individual cells are displayed in the table below:

Summary of computational transaction
Raw Inputview raw input (R code)
Raw Outputview raw output of R engine
Computing time3 seconds
R Server'Sir Ronald Aylmer Fisher' @ fisher.wessa.net


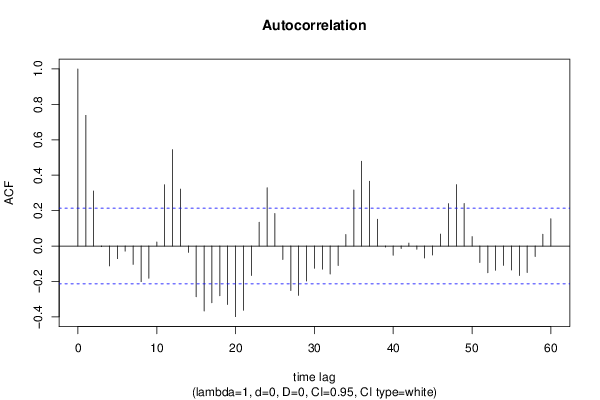
Autocorrelation Function
Time lag kACF(k)T-STATP-value
10.737816.76210
20.3103232.84420.002796
3-0.003512-0.03220.487197
4-0.11222-1.02850.153331
5-0.071198-0.65250.257918
6-0.028837-0.26430.396101
7-0.103952-0.95270.171728
8-0.201123-1.84330.034404
9-0.182135-1.66930.049391
100.0226420.20750.418055
110.3462233.17320.001053
120.5442424.98812e-06
130.3214272.94590.002083
14-0.036125-0.33110.370701
15-0.286341-2.62440.005155
16-0.366993-3.36350.00058
17-0.320408-2.93660.00214
18-0.280667-2.57240.00593
19-0.330297-3.02720.001638
20-0.39898-3.65670.000222
21-0.362653-3.32380.000659
22-0.166445-1.52550.065446
230.1345821.23350.110421
240.3286343.0120.001714
250.1837541.68410.047934
26-0.076159-0.6980.243549
27-0.25097-2.30020.011959
28-0.278714-2.55450.00622
29-0.197817-1.8130.0367
30-0.125699-1.15210.126284
31-0.130509-1.19610.117505
32-0.158351-1.45130.075208
33-0.10983-1.00660.158507
340.0648110.5940.277054
350.3162.89620.002407
360.4786774.38711.7e-05
370.366063.3550.000597
380.1508831.38290.085186
39-0.006162-0.05650.477548
40-0.051849-0.47520.317938
41-0.014244-0.13050.448223
420.0164120.15040.440397
43-0.01876-0.17190.43195
44-0.0682-0.62510.266811
45-0.050629-0.4640.321916
460.0673040.61690.2695
470.2395782.19580.015433
480.3467813.17830.001037
490.2404812.2040.015128
500.0530590.48630.314013
51-0.093468-0.85670.197037
52-0.151474-1.38830.084361
53-0.136747-1.25330.106786
54-0.109416-1.00280.159416
55-0.135258-1.23970.109277
56-0.166144-1.52270.06579
57-0.149458-1.36980.087199
58-0.059351-0.5440.293956
590.066410.60870.272198
600.153761.40920.081228

\begin{tabular}{lllllllll}
\hline
Autocorrelation Function \tabularnewline
Time lag k & ACF(k) & T-STAT & P-value \tabularnewline
1 & 0.73781 & 6.7621 & 0 \tabularnewline
2 & 0.310323 & 2.8442 & 0.002796 \tabularnewline
3 & -0.003512 & -0.0322 & 0.487197 \tabularnewline
4 & -0.11222 & -1.0285 & 0.153331 \tabularnewline
5 & -0.071198 & -0.6525 & 0.257918 \tabularnewline
6 & -0.028837 & -0.2643 & 0.396101 \tabularnewline
7 & -0.103952 & -0.9527 & 0.171728 \tabularnewline
8 & -0.201123 & -1.8433 & 0.034404 \tabularnewline
9 & -0.182135 & -1.6693 & 0.049391 \tabularnewline
10 & 0.022642 & 0.2075 & 0.418055 \tabularnewline
11 & 0.346223 & 3.1732 & 0.001053 \tabularnewline
12 & 0.544242 & 4.9881 & 2e-06 \tabularnewline
13 & 0.321427 & 2.9459 & 0.002083 \tabularnewline
14 & -0.036125 & -0.3311 & 0.370701 \tabularnewline
15 & -0.286341 & -2.6244 & 0.005155 \tabularnewline
16 & -0.366993 & -3.3635 & 0.00058 \tabularnewline
17 & -0.320408 & -2.9366 & 0.00214 \tabularnewline
18 & -0.280667 & -2.5724 & 0.00593 \tabularnewline
19 & -0.330297 & -3.0272 & 0.001638 \tabularnewline
20 & -0.39898 & -3.6567 & 0.000222 \tabularnewline
21 & -0.362653 & -3.3238 & 0.000659 \tabularnewline
22 & -0.166445 & -1.5255 & 0.065446 \tabularnewline
23 & 0.134582 & 1.2335 & 0.110421 \tabularnewline
24 & 0.328634 & 3.012 & 0.001714 \tabularnewline
25 & 0.183754 & 1.6841 & 0.047934 \tabularnewline
26 & -0.076159 & -0.698 & 0.243549 \tabularnewline
27 & -0.25097 & -2.3002 & 0.011959 \tabularnewline
28 & -0.278714 & -2.5545 & 0.00622 \tabularnewline
29 & -0.197817 & -1.813 & 0.0367 \tabularnewline
30 & -0.125699 & -1.1521 & 0.126284 \tabularnewline
31 & -0.130509 & -1.1961 & 0.117505 \tabularnewline
32 & -0.158351 & -1.4513 & 0.075208 \tabularnewline
33 & -0.10983 & -1.0066 & 0.158507 \tabularnewline
34 & 0.064811 & 0.594 & 0.277054 \tabularnewline
35 & 0.316 & 2.8962 & 0.002407 \tabularnewline
36 & 0.478677 & 4.3871 & 1.7e-05 \tabularnewline
37 & 0.36606 & 3.355 & 0.000597 \tabularnewline
38 & 0.150883 & 1.3829 & 0.085186 \tabularnewline
39 & -0.006162 & -0.0565 & 0.477548 \tabularnewline
40 & -0.051849 & -0.4752 & 0.317938 \tabularnewline
41 & -0.014244 & -0.1305 & 0.448223 \tabularnewline
42 & 0.016412 & 0.1504 & 0.440397 \tabularnewline
43 & -0.01876 & -0.1719 & 0.43195 \tabularnewline
44 & -0.0682 & -0.6251 & 0.266811 \tabularnewline
45 & -0.050629 & -0.464 & 0.321916 \tabularnewline
46 & 0.067304 & 0.6169 & 0.2695 \tabularnewline
47 & 0.239578 & 2.1958 & 0.015433 \tabularnewline
48 & 0.346781 & 3.1783 & 0.001037 \tabularnewline
49 & 0.240481 & 2.204 & 0.015128 \tabularnewline
50 & 0.053059 & 0.4863 & 0.314013 \tabularnewline
51 & -0.093468 & -0.8567 & 0.197037 \tabularnewline
52 & -0.151474 & -1.3883 & 0.084361 \tabularnewline
53 & -0.136747 & -1.2533 & 0.106786 \tabularnewline
54 & -0.109416 & -1.0028 & 0.159416 \tabularnewline
55 & -0.135258 & -1.2397 & 0.109277 \tabularnewline
56 & -0.166144 & -1.5227 & 0.06579 \tabularnewline
57 & -0.149458 & -1.3698 & 0.087199 \tabularnewline
58 & -0.059351 & -0.544 & 0.293956 \tabularnewline
59 & 0.06641 & 0.6087 & 0.272198 \tabularnewline
60 & 0.15376 & 1.4092 & 0.081228 \tabularnewline
\hline
\end{tabular}
%Source: https://freestatistics.org/blog/index.php?pk=226702&T=1

[TABLE]
[ROW][C]Autocorrelation Function[/C][/ROW]
[ROW][C]Time lag k[/C][C]ACF(k)[/C][C]T-STAT[/C][C]P-value[/C][/ROW]
[ROW][C]1[/C][C]0.73781[/C][C]6.7621[/C][C]0[/C][/ROW]
[ROW][C]2[/C][C]0.310323[/C][C]2.8442[/C][C]0.002796[/C][/ROW]
[ROW][C]3[/C][C]-0.003512[/C][C]-0.0322[/C][C]0.487197[/C][/ROW]
[ROW][C]4[/C][C]-0.11222[/C][C]-1.0285[/C][C]0.153331[/C][/ROW]
[ROW][C]5[/C][C]-0.071198[/C][C]-0.6525[/C][C]0.257918[/C][/ROW]
[ROW][C]6[/C][C]-0.028837[/C][C]-0.2643[/C][C]0.396101[/C][/ROW]
[ROW][C]7[/C][C]-0.103952[/C][C]-0.9527[/C][C]0.171728[/C][/ROW]
[ROW][C]8[/C][C]-0.201123[/C][C]-1.8433[/C][C]0.034404[/C][/ROW]
[ROW][C]9[/C][C]-0.182135[/C][C]-1.6693[/C][C]0.049391[/C][/ROW]
[ROW][C]10[/C][C]0.022642[/C][C]0.2075[/C][C]0.418055[/C][/ROW]
[ROW][C]11[/C][C]0.346223[/C][C]3.1732[/C][C]0.001053[/C][/ROW]
[ROW][C]12[/C][C]0.544242[/C][C]4.9881[/C][C]2e-06[/C][/ROW]
[ROW][C]13[/C][C]0.321427[/C][C]2.9459[/C][C]0.002083[/C][/ROW]
[ROW][C]14[/C][C]-0.036125[/C][C]-0.3311[/C][C]0.370701[/C][/ROW]
[ROW][C]15[/C][C]-0.286341[/C][C]-2.6244[/C][C]0.005155[/C][/ROW]
[ROW][C]16[/C][C]-0.366993[/C][C]-3.3635[/C][C]0.00058[/C][/ROW]
[ROW][C]17[/C][C]-0.320408[/C][C]-2.9366[/C][C]0.00214[/C][/ROW]
[ROW][C]18[/C][C]-0.280667[/C][C]-2.5724[/C][C]0.00593[/C][/ROW]
[ROW][C]19[/C][C]-0.330297[/C][C]-3.0272[/C][C]0.001638[/C][/ROW]
[ROW][C]20[/C][C]-0.39898[/C][C]-3.6567[/C][C]0.000222[/C][/ROW]
[ROW][C]21[/C][C]-0.362653[/C][C]-3.3238[/C][C]0.000659[/C][/ROW]
[ROW][C]22[/C][C]-0.166445[/C][C]-1.5255[/C][C]0.065446[/C][/ROW]
[ROW][C]23[/C][C]0.134582[/C][C]1.2335[/C][C]0.110421[/C][/ROW]
[ROW][C]24[/C][C]0.328634[/C][C]3.012[/C][C]0.001714[/C][/ROW]
[ROW][C]25[/C][C]0.183754[/C][C]1.6841[/C][C]0.047934[/C][/ROW]
[ROW][C]26[/C][C]-0.076159[/C][C]-0.698[/C][C]0.243549[/C][/ROW]
[ROW][C]27[/C][C]-0.25097[/C][C]-2.3002[/C][C]0.011959[/C][/ROW]
[ROW][C]28[/C][C]-0.278714[/C][C]-2.5545[/C][C]0.00622[/C][/ROW]
[ROW][C]29[/C][C]-0.197817[/C][C]-1.813[/C][C]0.0367[/C][/ROW]
[ROW][C]30[/C][C]-0.125699[/C][C]-1.1521[/C][C]0.126284[/C][/ROW]
[ROW][C]31[/C][C]-0.130509[/C][C]-1.1961[/C][C]0.117505[/C][/ROW]
[ROW][C]32[/C][C]-0.158351[/C][C]-1.4513[/C][C]0.075208[/C][/ROW]
[ROW][C]33[/C][C]-0.10983[/C][C]-1.0066[/C][C]0.158507[/C][/ROW]
[ROW][C]34[/C][C]0.064811[/C][C]0.594[/C][C]0.277054[/C][/ROW]
[ROW][C]35[/C][C]0.316[/C][C]2.8962[/C][C]0.002407[/C][/ROW]
[ROW][C]36[/C][C]0.478677[/C][C]4.3871[/C][C]1.7e-05[/C][/ROW]
[ROW][C]37[/C][C]0.36606[/C][C]3.355[/C][C]0.000597[/C][/ROW]
[ROW][C]38[/C][C]0.150883[/C][C]1.3829[/C][C]0.085186[/C][/ROW]
[ROW][C]39[/C][C]-0.006162[/C][C]-0.0565[/C][C]0.477548[/C][/ROW]
[ROW][C]40[/C][C]-0.051849[/C][C]-0.4752[/C][C]0.317938[/C][/ROW]
[ROW][C]41[/C][C]-0.014244[/C][C]-0.1305[/C][C]0.448223[/C][/ROW]
[ROW][C]42[/C][C]0.016412[/C][C]0.1504[/C][C]0.440397[/C][/ROW]
[ROW][C]43[/C][C]-0.01876[/C][C]-0.1719[/C][C]0.43195[/C][/ROW]
[ROW][C]44[/C][C]-0.0682[/C][C]-0.6251[/C][C]0.266811[/C][/ROW]
[ROW][C]45[/C][C]-0.050629[/C][C]-0.464[/C][C]0.321916[/C][/ROW]
[ROW][C]46[/C][C]0.067304[/C][C]0.6169[/C][C]0.2695[/C][/ROW]
[ROW][C]47[/C][C]0.239578[/C][C]2.1958[/C][C]0.015433[/C][/ROW]
[ROW][C]48[/C][C]0.346781[/C][C]3.1783[/C][C]0.001037[/C][/ROW]
[ROW][C]49[/C][C]0.240481[/C][C]2.204[/C][C]0.015128[/C][/ROW]
[ROW][C]50[/C][C]0.053059[/C][C]0.4863[/C][C]0.314013[/C][/ROW]
[ROW][C]51[/C][C]-0.093468[/C][C]-0.8567[/C][C]0.197037[/C][/ROW]
[ROW][C]52[/C][C]-0.151474[/C][C]-1.3883[/C][C]0.084361[/C][/ROW]
[ROW][C]53[/C][C]-0.136747[/C][C]-1.2533[/C][C]0.106786[/C][/ROW]
[ROW][C]54[/C][C]-0.109416[/C][C]-1.0028[/C][C]0.159416[/C][/ROW]
[ROW][C]55[/C][C]-0.135258[/C][C]-1.2397[/C][C]0.109277[/C][/ROW]
[ROW][C]56[/C][C]-0.166144[/C][C]-1.5227[/C][C]0.06579[/C][/ROW]
[ROW][C]57[/C][C]-0.149458[/C][C]-1.3698[/C][C]0.087199[/C][/ROW]
[ROW][C]58[/C][C]-0.059351[/C][C]-0.544[/C][C]0.293956[/C][/ROW]
[ROW][C]59[/C][C]0.06641[/C][C]0.6087[/C][C]0.272198[/C][/ROW]
[ROW][C]60[/C][C]0.15376[/C][C]1.4092[/C][C]0.081228[/C][/ROW]
[/TABLE]
Source: https://freestatistics.org/blog/index.php?pk=226702&T=1

Globally Unique Identifier (entire table): ba.freestatistics.org/blog/index.php?pk=226702&T=1

As an alternative you can also use a QR Code:  

The GUIDs for individual cells are displayed in the table below:

Autocorrelation Function
Time lag kACF(k)T-STATP-value
10.737816.76210
20.3103232.84420.002796
3-0.003512-0.03220.487197
4-0.11222-1.02850.153331
5-0.071198-0.65250.257918
6-0.028837-0.26430.396101
7-0.103952-0.95270.171728
8-0.201123-1.84330.034404
9-0.182135-1.66930.049391
100.0226420.20750.418055
110.3462233.17320.001053
120.5442424.98812e-06
130.3214272.94590.002083
14-0.036125-0.33110.370701
15-0.286341-2.62440.005155
16-0.366993-3.36350.00058
17-0.320408-2.93660.00214
18-0.280667-2.57240.00593
19-0.330297-3.02720.001638
20-0.39898-3.65670.000222
21-0.362653-3.32380.000659
22-0.166445-1.52550.065446
230.1345821.23350.110421
240.3286343.0120.001714
250.1837541.68410.047934
26-0.076159-0.6980.243549
27-0.25097-2.30020.011959
28-0.278714-2.55450.00622
29-0.197817-1.8130.0367
30-0.125699-1.15210.126284
31-0.130509-1.19610.117505
32-0.158351-1.45130.075208
33-0.10983-1.00660.158507
340.0648110.5940.277054
350.3162.89620.002407
360.4786774.38711.7e-05
370.366063.3550.000597
380.1508831.38290.085186
39-0.006162-0.05650.477548
40-0.051849-0.47520.317938
41-0.014244-0.13050.448223
420.0164120.15040.440397
43-0.01876-0.17190.43195
44-0.0682-0.62510.266811
45-0.050629-0.4640.321916
460.0673040.61690.2695
470.2395782.19580.015433
480.3467813.17830.001037
490.2404812.2040.015128
500.0530590.48630.314013
51-0.093468-0.85670.197037
52-0.151474-1.38830.084361
53-0.136747-1.25330.106786
54-0.109416-1.00280.159416
55-0.135258-1.23970.109277
56-0.166144-1.52270.06579
57-0.149458-1.36980.087199
58-0.059351-0.5440.293956
590.066410.60870.272198
600.153761.40920.081228


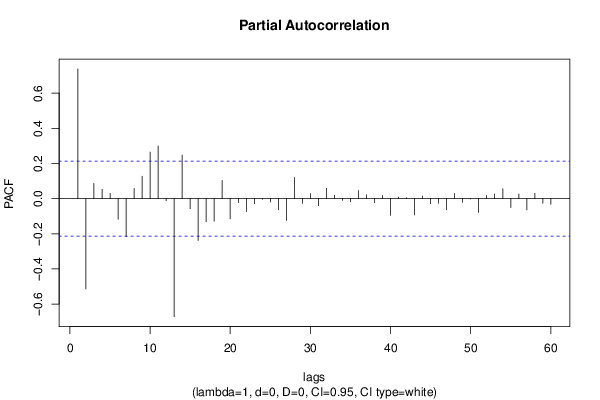
Partial Autocorrelation Function
Time lag kPACF(k)T-STATP-value
10.737816.76210
2-0.513656-4.70775e-06
30.0861660.78970.215957
40.0527010.4830.315173
50.0298850.27390.392417
6-0.117741-1.07910.141812
7-0.217237-1.9910.024865
80.0579370.5310.298411
90.1272561.16630.123393
100.2644672.42390.008751
110.2995042.7450.003699
12-0.012621-0.11570.454093
13-0.671631-6.15560
140.2473882.26730.012968
15-0.057096-0.52330.301074
16-0.2377-2.17860.016083
17-0.131528-1.20550.115703
18-0.128385-1.17670.121326
190.1033620.94730.173095
20-0.115119-1.05510.147207
21-0.02266-0.20770.417991
22-0.072956-0.66870.252776
23-0.028495-0.26120.397304
24-0.004044-0.03710.48526
25-0.019471-0.17850.4294
26-0.063677-0.58360.280525
27-0.124311-1.13930.128903
280.1206411.10570.136008
29-0.026921-0.24670.402856
300.028510.26130.39725
31-0.039981-0.36640.357481
320.0583110.53440.297227
330.0194170.1780.429591
34-0.009155-0.08390.466665
35-0.017793-0.16310.435426
360.045410.41620.339166
370.0214080.19620.422461
38-0.023368-0.21420.415467
390.0176850.16210.435813
40-0.095446-0.87480.192094
410.0085670.07850.468803
420.0045610.04180.483378
43-0.093083-0.85310.198009
440.0150660.13810.445254
45-0.028764-0.26360.396357
46-0.026167-0.23980.405525
47-0.063569-0.58260.280855
480.0293920.26940.39415
49-0.02108-0.19320.423635
50-0.002471-0.02260.490993
51-0.078841-0.72260.235969
520.0173680.15920.436953
530.0264560.24250.404502
540.0565170.5180.302913
55-0.051072-0.46810.320468
560.0259080.23740.406444
57-0.064303-0.58930.278605
580.0298480.27360.392546
59-0.026556-0.24340.404147
60-0.031876-0.29210.385447

\begin{tabular}{lllllllll}
\hline
Partial Autocorrelation Function \tabularnewline
Time lag k & PACF(k) & T-STAT & P-value \tabularnewline
1 & 0.73781 & 6.7621 & 0 \tabularnewline
2 & -0.513656 & -4.7077 & 5e-06 \tabularnewline
3 & 0.086166 & 0.7897 & 0.215957 \tabularnewline
4 & 0.052701 & 0.483 & 0.315173 \tabularnewline
5 & 0.029885 & 0.2739 & 0.392417 \tabularnewline
6 & -0.117741 & -1.0791 & 0.141812 \tabularnewline
7 & -0.217237 & -1.991 & 0.024865 \tabularnewline
8 & 0.057937 & 0.531 & 0.298411 \tabularnewline
9 & 0.127256 & 1.1663 & 0.123393 \tabularnewline
10 & 0.264467 & 2.4239 & 0.008751 \tabularnewline
11 & 0.299504 & 2.745 & 0.003699 \tabularnewline
12 & -0.012621 & -0.1157 & 0.454093 \tabularnewline
13 & -0.671631 & -6.1556 & 0 \tabularnewline
14 & 0.247388 & 2.2673 & 0.012968 \tabularnewline
15 & -0.057096 & -0.5233 & 0.301074 \tabularnewline
16 & -0.2377 & -2.1786 & 0.016083 \tabularnewline
17 & -0.131528 & -1.2055 & 0.115703 \tabularnewline
18 & -0.128385 & -1.1767 & 0.121326 \tabularnewline
19 & 0.103362 & 0.9473 & 0.173095 \tabularnewline
20 & -0.115119 & -1.0551 & 0.147207 \tabularnewline
21 & -0.02266 & -0.2077 & 0.417991 \tabularnewline
22 & -0.072956 & -0.6687 & 0.252776 \tabularnewline
23 & -0.028495 & -0.2612 & 0.397304 \tabularnewline
24 & -0.004044 & -0.0371 & 0.48526 \tabularnewline
25 & -0.019471 & -0.1785 & 0.4294 \tabularnewline
26 & -0.063677 & -0.5836 & 0.280525 \tabularnewline
27 & -0.124311 & -1.1393 & 0.128903 \tabularnewline
28 & 0.120641 & 1.1057 & 0.136008 \tabularnewline
29 & -0.026921 & -0.2467 & 0.402856 \tabularnewline
30 & 0.02851 & 0.2613 & 0.39725 \tabularnewline
31 & -0.039981 & -0.3664 & 0.357481 \tabularnewline
32 & 0.058311 & 0.5344 & 0.297227 \tabularnewline
33 & 0.019417 & 0.178 & 0.429591 \tabularnewline
34 & -0.009155 & -0.0839 & 0.466665 \tabularnewline
35 & -0.017793 & -0.1631 & 0.435426 \tabularnewline
36 & 0.04541 & 0.4162 & 0.339166 \tabularnewline
37 & 0.021408 & 0.1962 & 0.422461 \tabularnewline
38 & -0.023368 & -0.2142 & 0.415467 \tabularnewline
39 & 0.017685 & 0.1621 & 0.435813 \tabularnewline
40 & -0.095446 & -0.8748 & 0.192094 \tabularnewline
41 & 0.008567 & 0.0785 & 0.468803 \tabularnewline
42 & 0.004561 & 0.0418 & 0.483378 \tabularnewline
43 & -0.093083 & -0.8531 & 0.198009 \tabularnewline
44 & 0.015066 & 0.1381 & 0.445254 \tabularnewline
45 & -0.028764 & -0.2636 & 0.396357 \tabularnewline
46 & -0.026167 & -0.2398 & 0.405525 \tabularnewline
47 & -0.063569 & -0.5826 & 0.280855 \tabularnewline
48 & 0.029392 & 0.2694 & 0.39415 \tabularnewline
49 & -0.02108 & -0.1932 & 0.423635 \tabularnewline
50 & -0.002471 & -0.0226 & 0.490993 \tabularnewline
51 & -0.078841 & -0.7226 & 0.235969 \tabularnewline
52 & 0.017368 & 0.1592 & 0.436953 \tabularnewline
53 & 0.026456 & 0.2425 & 0.404502 \tabularnewline
54 & 0.056517 & 0.518 & 0.302913 \tabularnewline
55 & -0.051072 & -0.4681 & 0.320468 \tabularnewline
56 & 0.025908 & 0.2374 & 0.406444 \tabularnewline
57 & -0.064303 & -0.5893 & 0.278605 \tabularnewline
58 & 0.029848 & 0.2736 & 0.392546 \tabularnewline
59 & -0.026556 & -0.2434 & 0.404147 \tabularnewline
60 & -0.031876 & -0.2921 & 0.385447 \tabularnewline
\hline
\end{tabular}
%Source: https://freestatistics.org/blog/index.php?pk=226702&T=2

[TABLE]
[ROW][C]Partial Autocorrelation Function[/C][/ROW]
[ROW][C]Time lag k[/C][C]PACF(k)[/C][C]T-STAT[/C][C]P-value[/C][/ROW]
[ROW][C]1[/C][C]0.73781[/C][C]6.7621[/C][C]0[/C][/ROW]
[ROW][C]2[/C][C]-0.513656[/C][C]-4.7077[/C][C]5e-06[/C][/ROW]
[ROW][C]3[/C][C]0.086166[/C][C]0.7897[/C][C]0.215957[/C][/ROW]
[ROW][C]4[/C][C]0.052701[/C][C]0.483[/C][C]0.315173[/C][/ROW]
[ROW][C]5[/C][C]0.029885[/C][C]0.2739[/C][C]0.392417[/C][/ROW]
[ROW][C]6[/C][C]-0.117741[/C][C]-1.0791[/C][C]0.141812[/C][/ROW]
[ROW][C]7[/C][C]-0.217237[/C][C]-1.991[/C][C]0.024865[/C][/ROW]
[ROW][C]8[/C][C]0.057937[/C][C]0.531[/C][C]0.298411[/C][/ROW]
[ROW][C]9[/C][C]0.127256[/C][C]1.1663[/C][C]0.123393[/C][/ROW]
[ROW][C]10[/C][C]0.264467[/C][C]2.4239[/C][C]0.008751[/C][/ROW]
[ROW][C]11[/C][C]0.299504[/C][C]2.745[/C][C]0.003699[/C][/ROW]
[ROW][C]12[/C][C]-0.012621[/C][C]-0.1157[/C][C]0.454093[/C][/ROW]
[ROW][C]13[/C][C]-0.671631[/C][C]-6.1556[/C][C]0[/C][/ROW]
[ROW][C]14[/C][C]0.247388[/C][C]2.2673[/C][C]0.012968[/C][/ROW]
[ROW][C]15[/C][C]-0.057096[/C][C]-0.5233[/C][C]0.301074[/C][/ROW]
[ROW][C]16[/C][C]-0.2377[/C][C]-2.1786[/C][C]0.016083[/C][/ROW]
[ROW][C]17[/C][C]-0.131528[/C][C]-1.2055[/C][C]0.115703[/C][/ROW]
[ROW][C]18[/C][C]-0.128385[/C][C]-1.1767[/C][C]0.121326[/C][/ROW]
[ROW][C]19[/C][C]0.103362[/C][C]0.9473[/C][C]0.173095[/C][/ROW]
[ROW][C]20[/C][C]-0.115119[/C][C]-1.0551[/C][C]0.147207[/C][/ROW]
[ROW][C]21[/C][C]-0.02266[/C][C]-0.2077[/C][C]0.417991[/C][/ROW]
[ROW][C]22[/C][C]-0.072956[/C][C]-0.6687[/C][C]0.252776[/C][/ROW]
[ROW][C]23[/C][C]-0.028495[/C][C]-0.2612[/C][C]0.397304[/C][/ROW]
[ROW][C]24[/C][C]-0.004044[/C][C]-0.0371[/C][C]0.48526[/C][/ROW]
[ROW][C]25[/C][C]-0.019471[/C][C]-0.1785[/C][C]0.4294[/C][/ROW]
[ROW][C]26[/C][C]-0.063677[/C][C]-0.5836[/C][C]0.280525[/C][/ROW]
[ROW][C]27[/C][C]-0.124311[/C][C]-1.1393[/C][C]0.128903[/C][/ROW]
[ROW][C]28[/C][C]0.120641[/C][C]1.1057[/C][C]0.136008[/C][/ROW]
[ROW][C]29[/C][C]-0.026921[/C][C]-0.2467[/C][C]0.402856[/C][/ROW]
[ROW][C]30[/C][C]0.02851[/C][C]0.2613[/C][C]0.39725[/C][/ROW]
[ROW][C]31[/C][C]-0.039981[/C][C]-0.3664[/C][C]0.357481[/C][/ROW]
[ROW][C]32[/C][C]0.058311[/C][C]0.5344[/C][C]0.297227[/C][/ROW]
[ROW][C]33[/C][C]0.019417[/C][C]0.178[/C][C]0.429591[/C][/ROW]
[ROW][C]34[/C][C]-0.009155[/C][C]-0.0839[/C][C]0.466665[/C][/ROW]
[ROW][C]35[/C][C]-0.017793[/C][C]-0.1631[/C][C]0.435426[/C][/ROW]
[ROW][C]36[/C][C]0.04541[/C][C]0.4162[/C][C]0.339166[/C][/ROW]
[ROW][C]37[/C][C]0.021408[/C][C]0.1962[/C][C]0.422461[/C][/ROW]
[ROW][C]38[/C][C]-0.023368[/C][C]-0.2142[/C][C]0.415467[/C][/ROW]
[ROW][C]39[/C][C]0.017685[/C][C]0.1621[/C][C]0.435813[/C][/ROW]
[ROW][C]40[/C][C]-0.095446[/C][C]-0.8748[/C][C]0.192094[/C][/ROW]
[ROW][C]41[/C][C]0.008567[/C][C]0.0785[/C][C]0.468803[/C][/ROW]
[ROW][C]42[/C][C]0.004561[/C][C]0.0418[/C][C]0.483378[/C][/ROW]
[ROW][C]43[/C][C]-0.093083[/C][C]-0.8531[/C][C]0.198009[/C][/ROW]
[ROW][C]44[/C][C]0.015066[/C][C]0.1381[/C][C]0.445254[/C][/ROW]
[ROW][C]45[/C][C]-0.028764[/C][C]-0.2636[/C][C]0.396357[/C][/ROW]
[ROW][C]46[/C][C]-0.026167[/C][C]-0.2398[/C][C]0.405525[/C][/ROW]
[ROW][C]47[/C][C]-0.063569[/C][C]-0.5826[/C][C]0.280855[/C][/ROW]
[ROW][C]48[/C][C]0.029392[/C][C]0.2694[/C][C]0.39415[/C][/ROW]
[ROW][C]49[/C][C]-0.02108[/C][C]-0.1932[/C][C]0.423635[/C][/ROW]
[ROW][C]50[/C][C]-0.002471[/C][C]-0.0226[/C][C]0.490993[/C][/ROW]
[ROW][C]51[/C][C]-0.078841[/C][C]-0.7226[/C][C]0.235969[/C][/ROW]
[ROW][C]52[/C][C]0.017368[/C][C]0.1592[/C][C]0.436953[/C][/ROW]
[ROW][C]53[/C][C]0.026456[/C][C]0.2425[/C][C]0.404502[/C][/ROW]
[ROW][C]54[/C][C]0.056517[/C][C]0.518[/C][C]0.302913[/C][/ROW]
[ROW][C]55[/C][C]-0.051072[/C][C]-0.4681[/C][C]0.320468[/C][/ROW]
[ROW][C]56[/C][C]0.025908[/C][C]0.2374[/C][C]0.406444[/C][/ROW]
[ROW][C]57[/C][C]-0.064303[/C][C]-0.5893[/C][C]0.278605[/C][/ROW]
[ROW][C]58[/C][C]0.029848[/C][C]0.2736[/C][C]0.392546[/C][/ROW]
[ROW][C]59[/C][C]-0.026556[/C][C]-0.2434[/C][C]0.404147[/C][/ROW]
[ROW][C]60[/C][C]-0.031876[/C][C]-0.2921[/C][C]0.385447[/C][/ROW]
[/TABLE]
Source: https://freestatistics.org/blog/index.php?pk=226702&T=2

Globally Unique Identifier (entire table): ba.freestatistics.org/blog/index.php?pk=226702&T=2

As an alternative you can also use a QR Code:  

The GUIDs for individual cells are displayed in the table below:

Partial Autocorrelation Function
Time lag kPACF(k)T-STATP-value
10.737816.76210
2-0.513656-4.70775e-06
30.0861660.78970.215957
40.0527010.4830.315173
50.0298850.27390.392417
6-0.117741-1.07910.141812
7-0.217237-1.9910.024865
80.0579370.5310.298411
90.1272561.16630.123393
100.2644672.42390.008751
110.2995042.7450.003699
12-0.012621-0.11570.454093
13-0.671631-6.15560
140.2473882.26730.012968
15-0.057096-0.52330.301074
16-0.2377-2.17860.016083
17-0.131528-1.20550.115703
18-0.128385-1.17670.121326
190.1033620.94730.173095
20-0.115119-1.05510.147207
21-0.02266-0.20770.417991
22-0.072956-0.66870.252776
23-0.028495-0.26120.397304
24-0.004044-0.03710.48526
25-0.019471-0.17850.4294
26-0.063677-0.58360.280525
27-0.124311-1.13930.128903
280.1206411.10570.136008
29-0.026921-0.24670.402856
300.028510.26130.39725
31-0.039981-0.36640.357481
320.0583110.53440.297227
330.0194170.1780.429591
34-0.009155-0.08390.466665
35-0.017793-0.16310.435426
360.045410.41620.339166
370.0214080.19620.422461
38-0.023368-0.21420.415467
390.0176850.16210.435813
40-0.095446-0.87480.192094
410.0085670.07850.468803
420.0045610.04180.483378
43-0.093083-0.85310.198009
440.0150660.13810.445254
45-0.028764-0.26360.396357
46-0.026167-0.23980.405525
47-0.063569-0.58260.280855
480.0293920.26940.39415
49-0.02108-0.19320.423635
50-0.002471-0.02260.490993
51-0.078841-0.72260.235969
520.0173680.15920.436953
530.0264560.24250.404502
540.0565170.5180.302913
55-0.051072-0.46810.320468
560.0259080.23740.406444
57-0.064303-0.58930.278605
580.0298480.27360.392546
59-0.026556-0.24340.404147
60-0.031876-0.29210.385447


Parameters (Session):
par1 = 60 ; par2 = 1 ; par3 = 0 ; par4 = 0 ; par5 = 12 ; par6 = White Noise ; par7 = 0.95 ;
Parameters (R input):
par1 = 60 ; par2 = 1 ; par3 = 0 ; par4 = 0 ; par5 = 12 ; par6 = White Noise ; par7 = 0.95 ; par8 = ;
R code (references can be found in the software module):
if (par1 == 'Default') {
par1 = 10*log10(length(x))
} else {
par1 <- as.numeric(par1)
}
par2 <- as.numeric(par2)
par3 <- as.numeric(par3)
par4 <- as.numeric(par4)
par5 <- as.numeric(par5)
if (par6 == 'White Noise') par6 <- 'white' else par6 <- 'ma'
par7 <- as.numeric(par7)
if (par8 != '') par8 <- as.numeric(par8)
ox <- x
if (par8 == '') {
if (par2 == 0) {
x <- log(x)
} else {
x <- (x ^ par2 - 1) / par2
}
} else {
x <- log(x,base=par8)
}
if (par3 > 0) x <- diff(x,lag=1,difference=par3)
if (par4 > 0) x <- diff(x,lag=par5,difference=par4)
bitmap(file='picts.png')
op <- par(mfrow=c(2,1))
plot(ox,type='l',main='Original Time Series',xlab='time',ylab='value')
if (par8=='') {
mytitle <- paste('Working Time Series (lambda=',par2,', d=',par3,', D=',par4,')',sep='')
mysub <- paste('(lambda=',par2,', d=',par3,', D=',par4,', CI=', par7, ', CI type=',par6,')',sep='')
} else {
mytitle <- paste('Working Time Series (base=',par8,', d=',par3,', D=',par4,')',sep='')
mysub <- paste('(base=',par8,', d=',par3,', D=',par4,', CI=', par7, ', CI type=',par6,')',sep='')
}
plot(x,type='l', main=mytitle,xlab='time',ylab='value')
par(op)
dev.off()
bitmap(file='pic1.png')
racf <- acf(x, par1, main='Autocorrelation', xlab='time lag', ylab='ACF', ci.type=par6, ci=par7, sub=mysub)
dev.off()
bitmap(file='pic2.png')
rpacf <- pacf(x,par1,main='Partial Autocorrelation',xlab='lags',ylab='PACF',sub=mysub)
dev.off()
(myacf <- c(racf$acf))
(mypacf <- c(rpacf$acf))
lengthx <- length(x)
sqrtn <- sqrt(lengthx)
load(file='createtable')
a<-table.start()
a<-table.row.start(a)
a<-table.element(a,'Autocorrelation Function',4,TRUE)
a<-table.row.end(a)
a<-table.row.start(a)
a<-table.element(a,'Time lag k',header=TRUE)
a<-table.element(a,hyperlink('basics.htm','ACF(k)','click here for more information about the Autocorrelation Function'),header=TRUE)
a<-table.element(a,'T-STAT',header=TRUE)
a<-table.element(a,'P-value',header=TRUE)
a<-table.row.end(a)
for (i in 2:(par1+1)) {
a<-table.row.start(a)
a<-table.element(a,i-1,header=TRUE)
a<-table.element(a,round(myacf[i],6))
mytstat <- myacf[i]*sqrtn
a<-table.element(a,round(mytstat,4))
a<-table.element(a,round(1-pt(abs(mytstat),lengthx),6))
a<-table.row.end(a)
}
a<-table.end(a)
table.save(a,file='mytable.tab')
a<-table.start()
a<-table.row.start(a)
a<-table.element(a,'Partial Autocorrelation Function',4,TRUE)
a<-table.row.end(a)
a<-table.row.start(a)
a<-table.element(a,'Time lag k',header=TRUE)
a<-table.element(a,hyperlink('basics.htm','PACF(k)','click here for more information about the Partial Autocorrelation Function'),header=TRUE)
a<-table.element(a,'T-STAT',header=TRUE)
a<-table.element(a,'P-value',header=TRUE)
a<-table.row.end(a)
for (i in 1:par1) {
a<-table.row.start(a)
a<-table.element(a,i,header=TRUE)
a<-table.element(a,round(mypacf[i],6))
mytstat <- mypacf[i]*sqrtn
a<-table.element(a,round(mytstat,4))
a<-table.element(a,round(1-pt(abs(mytstat),lengthx),6))
a<-table.row.end(a)
}
a<-table.end(a)
table.save(a,file='mytable1.tab')