Free Statistics

of Irreproducible Research!

Author's title

Author*Unverified author*
R Software Modulerwasp_autocorrelation.wasp
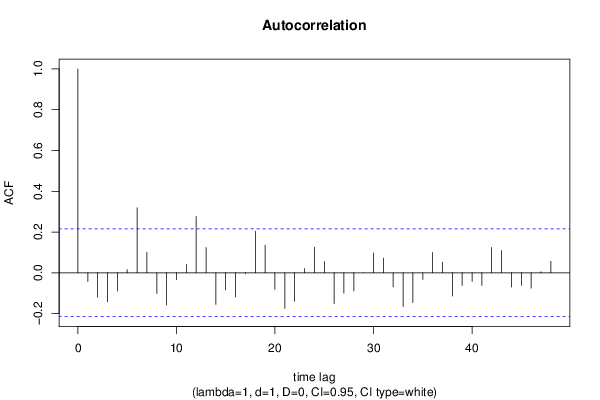
Title produced by software(Partial) Autocorrelation Function
Date of computationSat, 16 Nov 2013 13:57:32 -0500
Cite this page as followsStatistical Computations at FreeStatistics.org, Office for Research Development and Education, URL https://freestatistics.org/blog/index.php?v=date/2013/Nov/16/t1384628285c2tpilzgk3zu5fn.htm/, Retrieved Sun, 05 May 2024 07:12:50 +0000
Statistical Computations at FreeStatistics.org, Office for Research Development and Education, URL https://freestatistics.org/blog/index.php?pk=225641, Retrieved Sun, 05 May 2024 07:12:50 +0000
QR Codes:

Original text written by user:
IsPrivate?No (this computation is public)
User-defined keywords
Estimated Impact69
Family? (F = Feedback message, R = changed R code, M = changed R Module, P = changed Parameters, D = changed Data)
-       [(Partial) Autocorrelation Function] [] [2013-11-16 18:57:32] [6db2c0c963bf82ed406b79886f98dcae] [Current]
Feedback Forum

Post a new message
Dataseries X:
4309
4303
4177
4117
4065
3983
4091
4067
4024
3868
3800
3804
3862
3792
3674
3560
3489
3412
3674
3672
3463
3429
3400
3533
3578
3544
3435
3352
3213
3235
3460
3385
3283
3295
3331
3520
3668
3714
3691
3604
3581
3675
3833
3810
3663
3704
3810
4053
4152
4139
4055
3928
3821
3811
3999
3954
3724
3731
3697
3818
3897
3888
3754
3647
3564
3498
3704
3678
3599
3507
3484
2612
2926
2918
2833
2791
2762
2728
2831
2839
2775
2540
2625
2669


Summary of computational transaction
Raw Inputview raw input (R code)
Raw Outputview raw output of R engine
Computing time3 seconds
R Server'George Udny Yule' @ yule.wessa.net

\begin{tabular}{lllllllll}
\hline
Summary of computational transaction \tabularnewline
Raw Input & view raw input (R code)  \tabularnewline
Raw Output & view raw output of R engine  \tabularnewline
Computing time & 3 seconds \tabularnewline
R Server & 'George Udny Yule' @ yule.wessa.net \tabularnewline
\hline
\end{tabular}
%Source: https://freestatistics.org/blog/index.php?pk=225641&T=0

[TABLE]
[ROW][C]Summary of computational transaction[/C][/ROW]
[ROW][C]Raw Input[/C][C]view raw input (R code) [/C][/ROW]
[ROW][C]Raw Output[/C][C]view raw output of R engine [/C][/ROW]
[ROW][C]Computing time[/C][C]3 seconds[/C][/ROW]
[ROW][C]R Server[/C][C]'George Udny Yule' @ yule.wessa.net[/C][/ROW]
[/TABLE]
Source: https://freestatistics.org/blog/index.php?pk=225641&T=0

Globally Unique Identifier (entire table): ba.freestatistics.org/blog/index.php?pk=225641&T=0

As an alternative you can also use a QR Code:  

The GUIDs for individual cells are displayed in the table below:

Summary of computational transaction
Raw Inputview raw input (R code)
Raw Outputview raw output of R engine
Computing time3 seconds
R Server'George Udny Yule' @ yule.wessa.net


Autocorrelation Function
Time lag kACF(k)T-STATP-value
1-0.042723-0.38920.349053
2-0.119555-1.08920.13961
3-0.141813-1.2920.099975
4-0.089577-0.81610.208394
50.0155760.14190.443749
60.3193452.90940.002323
70.1002420.91330.181878
8-0.101626-0.92590.178603
9-0.157718-1.43690.077256
10-0.034335-0.31280.377606
110.0405730.36960.356298
120.2758822.51340.006945
130.1236681.12670.131564
14-0.154955-1.41170.080888
15-0.083978-0.76510.223198
16-0.118407-1.07870.141915
17-0.004443-0.04050.483904
180.2034581.85360.033675
190.135151.23130.110849
20-0.080836-0.73650.231766
21-0.1745-1.58980.057844
22-0.139624-1.2720.103456
230.020630.18790.425688
240.1253761.14220.128322
250.0557030.50750.306584
26-0.150694-1.37290.086743
27-0.099683-0.90820.183212
28-0.08955-0.81580.208465
298.3e-058e-040.499699
300.0974780.88810.188535
310.0719490.65550.256984
32-0.069681-0.63480.263644
33-0.165303-1.5060.067934
34-0.145738-1.32770.093953
35-0.032211-0.29350.384954
360.0992670.90440.184211
370.0523040.47650.317482
38-0.113511-1.03410.152039
39-0.062707-0.57130.284674
40-0.042001-0.38260.351481
41-0.06191-0.5640.287129
420.1240211.12990.13089
430.1094830.99740.160725
44-0.069589-0.6340.263917
45-0.06195-0.56440.287005
46-0.0753-0.6860.247307
470.0053920.04910.480469
480.0561310.51140.305223

\begin{tabular}{lllllllll}
\hline
Autocorrelation Function \tabularnewline
Time lag k & ACF(k) & T-STAT & P-value \tabularnewline
1 & -0.042723 & -0.3892 & 0.349053 \tabularnewline
2 & -0.119555 & -1.0892 & 0.13961 \tabularnewline
3 & -0.141813 & -1.292 & 0.099975 \tabularnewline
4 & -0.089577 & -0.8161 & 0.208394 \tabularnewline
5 & 0.015576 & 0.1419 & 0.443749 \tabularnewline
6 & 0.319345 & 2.9094 & 0.002323 \tabularnewline
7 & 0.100242 & 0.9133 & 0.181878 \tabularnewline
8 & -0.101626 & -0.9259 & 0.178603 \tabularnewline
9 & -0.157718 & -1.4369 & 0.077256 \tabularnewline
10 & -0.034335 & -0.3128 & 0.377606 \tabularnewline
11 & 0.040573 & 0.3696 & 0.356298 \tabularnewline
12 & 0.275882 & 2.5134 & 0.006945 \tabularnewline
13 & 0.123668 & 1.1267 & 0.131564 \tabularnewline
14 & -0.154955 & -1.4117 & 0.080888 \tabularnewline
15 & -0.083978 & -0.7651 & 0.223198 \tabularnewline
16 & -0.118407 & -1.0787 & 0.141915 \tabularnewline
17 & -0.004443 & -0.0405 & 0.483904 \tabularnewline
18 & 0.203458 & 1.8536 & 0.033675 \tabularnewline
19 & 0.13515 & 1.2313 & 0.110849 \tabularnewline
20 & -0.080836 & -0.7365 & 0.231766 \tabularnewline
21 & -0.1745 & -1.5898 & 0.057844 \tabularnewline
22 & -0.139624 & -1.272 & 0.103456 \tabularnewline
23 & 0.02063 & 0.1879 & 0.425688 \tabularnewline
24 & 0.125376 & 1.1422 & 0.128322 \tabularnewline
25 & 0.055703 & 0.5075 & 0.306584 \tabularnewline
26 & -0.150694 & -1.3729 & 0.086743 \tabularnewline
27 & -0.099683 & -0.9082 & 0.183212 \tabularnewline
28 & -0.08955 & -0.8158 & 0.208465 \tabularnewline
29 & 8.3e-05 & 8e-04 & 0.499699 \tabularnewline
30 & 0.097478 & 0.8881 & 0.188535 \tabularnewline
31 & 0.071949 & 0.6555 & 0.256984 \tabularnewline
32 & -0.069681 & -0.6348 & 0.263644 \tabularnewline
33 & -0.165303 & -1.506 & 0.067934 \tabularnewline
34 & -0.145738 & -1.3277 & 0.093953 \tabularnewline
35 & -0.032211 & -0.2935 & 0.384954 \tabularnewline
36 & 0.099267 & 0.9044 & 0.184211 \tabularnewline
37 & 0.052304 & 0.4765 & 0.317482 \tabularnewline
38 & -0.113511 & -1.0341 & 0.152039 \tabularnewline
39 & -0.062707 & -0.5713 & 0.284674 \tabularnewline
40 & -0.042001 & -0.3826 & 0.351481 \tabularnewline
41 & -0.06191 & -0.564 & 0.287129 \tabularnewline
42 & 0.124021 & 1.1299 & 0.13089 \tabularnewline
43 & 0.109483 & 0.9974 & 0.160725 \tabularnewline
44 & -0.069589 & -0.634 & 0.263917 \tabularnewline
45 & -0.06195 & -0.5644 & 0.287005 \tabularnewline
46 & -0.0753 & -0.686 & 0.247307 \tabularnewline
47 & 0.005392 & 0.0491 & 0.480469 \tabularnewline
48 & 0.056131 & 0.5114 & 0.305223 \tabularnewline
\hline
\end{tabular}
%Source: https://freestatistics.org/blog/index.php?pk=225641&T=1

[TABLE]
[ROW][C]Autocorrelation Function[/C][/ROW]
[ROW][C]Time lag k[/C][C]ACF(k)[/C][C]T-STAT[/C][C]P-value[/C][/ROW]
[ROW][C]1[/C][C]-0.042723[/C][C]-0.3892[/C][C]0.349053[/C][/ROW]
[ROW][C]2[/C][C]-0.119555[/C][C]-1.0892[/C][C]0.13961[/C][/ROW]
[ROW][C]3[/C][C]-0.141813[/C][C]-1.292[/C][C]0.099975[/C][/ROW]
[ROW][C]4[/C][C]-0.089577[/C][C]-0.8161[/C][C]0.208394[/C][/ROW]
[ROW][C]5[/C][C]0.015576[/C][C]0.1419[/C][C]0.443749[/C][/ROW]
[ROW][C]6[/C][C]0.319345[/C][C]2.9094[/C][C]0.002323[/C][/ROW]
[ROW][C]7[/C][C]0.100242[/C][C]0.9133[/C][C]0.181878[/C][/ROW]
[ROW][C]8[/C][C]-0.101626[/C][C]-0.9259[/C][C]0.178603[/C][/ROW]
[ROW][C]9[/C][C]-0.157718[/C][C]-1.4369[/C][C]0.077256[/C][/ROW]
[ROW][C]10[/C][C]-0.034335[/C][C]-0.3128[/C][C]0.377606[/C][/ROW]
[ROW][C]11[/C][C]0.040573[/C][C]0.3696[/C][C]0.356298[/C][/ROW]
[ROW][C]12[/C][C]0.275882[/C][C]2.5134[/C][C]0.006945[/C][/ROW]
[ROW][C]13[/C][C]0.123668[/C][C]1.1267[/C][C]0.131564[/C][/ROW]
[ROW][C]14[/C][C]-0.154955[/C][C]-1.4117[/C][C]0.080888[/C][/ROW]
[ROW][C]15[/C][C]-0.083978[/C][C]-0.7651[/C][C]0.223198[/C][/ROW]
[ROW][C]16[/C][C]-0.118407[/C][C]-1.0787[/C][C]0.141915[/C][/ROW]
[ROW][C]17[/C][C]-0.004443[/C][C]-0.0405[/C][C]0.483904[/C][/ROW]
[ROW][C]18[/C][C]0.203458[/C][C]1.8536[/C][C]0.033675[/C][/ROW]
[ROW][C]19[/C][C]0.13515[/C][C]1.2313[/C][C]0.110849[/C][/ROW]
[ROW][C]20[/C][C]-0.080836[/C][C]-0.7365[/C][C]0.231766[/C][/ROW]
[ROW][C]21[/C][C]-0.1745[/C][C]-1.5898[/C][C]0.057844[/C][/ROW]
[ROW][C]22[/C][C]-0.139624[/C][C]-1.272[/C][C]0.103456[/C][/ROW]
[ROW][C]23[/C][C]0.02063[/C][C]0.1879[/C][C]0.425688[/C][/ROW]
[ROW][C]24[/C][C]0.125376[/C][C]1.1422[/C][C]0.128322[/C][/ROW]
[ROW][C]25[/C][C]0.055703[/C][C]0.5075[/C][C]0.306584[/C][/ROW]
[ROW][C]26[/C][C]-0.150694[/C][C]-1.3729[/C][C]0.086743[/C][/ROW]
[ROW][C]27[/C][C]-0.099683[/C][C]-0.9082[/C][C]0.183212[/C][/ROW]
[ROW][C]28[/C][C]-0.08955[/C][C]-0.8158[/C][C]0.208465[/C][/ROW]
[ROW][C]29[/C][C]8.3e-05[/C][C]8e-04[/C][C]0.499699[/C][/ROW]
[ROW][C]30[/C][C]0.097478[/C][C]0.8881[/C][C]0.188535[/C][/ROW]
[ROW][C]31[/C][C]0.071949[/C][C]0.6555[/C][C]0.256984[/C][/ROW]
[ROW][C]32[/C][C]-0.069681[/C][C]-0.6348[/C][C]0.263644[/C][/ROW]
[ROW][C]33[/C][C]-0.165303[/C][C]-1.506[/C][C]0.067934[/C][/ROW]
[ROW][C]34[/C][C]-0.145738[/C][C]-1.3277[/C][C]0.093953[/C][/ROW]
[ROW][C]35[/C][C]-0.032211[/C][C]-0.2935[/C][C]0.384954[/C][/ROW]
[ROW][C]36[/C][C]0.099267[/C][C]0.9044[/C][C]0.184211[/C][/ROW]
[ROW][C]37[/C][C]0.052304[/C][C]0.4765[/C][C]0.317482[/C][/ROW]
[ROW][C]38[/C][C]-0.113511[/C][C]-1.0341[/C][C]0.152039[/C][/ROW]
[ROW][C]39[/C][C]-0.062707[/C][C]-0.5713[/C][C]0.284674[/C][/ROW]
[ROW][C]40[/C][C]-0.042001[/C][C]-0.3826[/C][C]0.351481[/C][/ROW]
[ROW][C]41[/C][C]-0.06191[/C][C]-0.564[/C][C]0.287129[/C][/ROW]
[ROW][C]42[/C][C]0.124021[/C][C]1.1299[/C][C]0.13089[/C][/ROW]
[ROW][C]43[/C][C]0.109483[/C][C]0.9974[/C][C]0.160725[/C][/ROW]
[ROW][C]44[/C][C]-0.069589[/C][C]-0.634[/C][C]0.263917[/C][/ROW]
[ROW][C]45[/C][C]-0.06195[/C][C]-0.5644[/C][C]0.287005[/C][/ROW]
[ROW][C]46[/C][C]-0.0753[/C][C]-0.686[/C][C]0.247307[/C][/ROW]
[ROW][C]47[/C][C]0.005392[/C][C]0.0491[/C][C]0.480469[/C][/ROW]
[ROW][C]48[/C][C]0.056131[/C][C]0.5114[/C][C]0.305223[/C][/ROW]
[/TABLE]
Source: https://freestatistics.org/blog/index.php?pk=225641&T=1

Globally Unique Identifier (entire table): ba.freestatistics.org/blog/index.php?pk=225641&T=1

As an alternative you can also use a QR Code:  

The GUIDs for individual cells are displayed in the table below:

Autocorrelation Function
Time lag kACF(k)T-STATP-value
1-0.042723-0.38920.349053
2-0.119555-1.08920.13961
3-0.141813-1.2920.099975
4-0.089577-0.81610.208394
50.0155760.14190.443749
60.3193452.90940.002323
70.1002420.91330.181878
8-0.101626-0.92590.178603
9-0.157718-1.43690.077256
10-0.034335-0.31280.377606
110.0405730.36960.356298
120.2758822.51340.006945
130.1236681.12670.131564
14-0.154955-1.41170.080888
15-0.083978-0.76510.223198
16-0.118407-1.07870.141915
17-0.004443-0.04050.483904
180.2034581.85360.033675
190.135151.23130.110849
20-0.080836-0.73650.231766
21-0.1745-1.58980.057844
22-0.139624-1.2720.103456
230.020630.18790.425688
240.1253761.14220.128322
250.0557030.50750.306584
26-0.150694-1.37290.086743
27-0.099683-0.90820.183212
28-0.08955-0.81580.208465
298.3e-058e-040.499699
300.0974780.88810.188535
310.0719490.65550.256984
32-0.069681-0.63480.263644
33-0.165303-1.5060.067934
34-0.145738-1.32770.093953
35-0.032211-0.29350.384954
360.0992670.90440.184211
370.0523040.47650.317482
38-0.113511-1.03410.152039
39-0.062707-0.57130.284674
40-0.042001-0.38260.351481
41-0.06191-0.5640.287129
420.1240211.12990.13089
430.1094830.99740.160725
44-0.069589-0.6340.263917
45-0.06195-0.56440.287005
46-0.0753-0.6860.247307
470.0053920.04910.480469
480.0561310.51140.305223


Partial Autocorrelation Function
Time lag kPACF(k)T-STATP-value
1-0.042723-0.38920.349053
2-0.121602-1.10780.135564
3-0.155313-1.4150.080409
4-0.126201-1.14970.126776
5-0.039963-0.36410.358362
60.2820152.56930.00599
70.1322491.20480.115844
8-0.020471-0.18650.426254
9-0.078104-0.71160.239366
100.0058830.05360.478693
110.0180740.16470.434805
120.1811611.65050.051314
130.1109841.01110.15745
14-0.074097-0.67510.250758
150.0354540.3230.373754
16-0.085723-0.7810.21852
17-0.072984-0.66490.253974
180.0352770.32140.374361
190.0486810.44350.329277
200.010360.09440.462515
21-0.087005-0.79270.215121
22-0.116894-1.0650.144992
23-0.035541-0.32380.373453
24-0.028494-0.25960.397912
25-0.097814-0.89110.187719
26-0.155564-1.41730.080076
27-0.020719-0.18880.425373
28-0.014755-0.13440.446696
29-0.018221-0.1660.434279
30-0.053986-0.49180.312067
31-0.022919-0.20880.417556
320.0268240.24440.403769
33-0.064388-0.58660.279531
34-0.111152-1.01260.157086
35-0.093395-0.85090.198646
360.0046080.0420.483307
37-0.020236-0.18440.42709
38-0.126235-1.15010.126713
390.000690.00630.4975
400.0695770.63390.263952
41-0.025952-0.23640.406839
420.0103730.09450.462467
430.0539620.49160.312143
440.0423140.38550.350426
450.0866060.7890.216175
46-0.014884-0.13560.446232
470.0024260.02210.491208
48-0.005049-0.0460.481712

\begin{tabular}{lllllllll}
\hline
Partial Autocorrelation Function \tabularnewline
Time lag k & PACF(k) & T-STAT & P-value \tabularnewline
1 & -0.042723 & -0.3892 & 0.349053 \tabularnewline
2 & -0.121602 & -1.1078 & 0.135564 \tabularnewline
3 & -0.155313 & -1.415 & 0.080409 \tabularnewline
4 & -0.126201 & -1.1497 & 0.126776 \tabularnewline
5 & -0.039963 & -0.3641 & 0.358362 \tabularnewline
6 & 0.282015 & 2.5693 & 0.00599 \tabularnewline
7 & 0.132249 & 1.2048 & 0.115844 \tabularnewline
8 & -0.020471 & -0.1865 & 0.426254 \tabularnewline
9 & -0.078104 & -0.7116 & 0.239366 \tabularnewline
10 & 0.005883 & 0.0536 & 0.478693 \tabularnewline
11 & 0.018074 & 0.1647 & 0.434805 \tabularnewline
12 & 0.181161 & 1.6505 & 0.051314 \tabularnewline
13 & 0.110984 & 1.0111 & 0.15745 \tabularnewline
14 & -0.074097 & -0.6751 & 0.250758 \tabularnewline
15 & 0.035454 & 0.323 & 0.373754 \tabularnewline
16 & -0.085723 & -0.781 & 0.21852 \tabularnewline
17 & -0.072984 & -0.6649 & 0.253974 \tabularnewline
18 & 0.035277 & 0.3214 & 0.374361 \tabularnewline
19 & 0.048681 & 0.4435 & 0.329277 \tabularnewline
20 & 0.01036 & 0.0944 & 0.462515 \tabularnewline
21 & -0.087005 & -0.7927 & 0.215121 \tabularnewline
22 & -0.116894 & -1.065 & 0.144992 \tabularnewline
23 & -0.035541 & -0.3238 & 0.373453 \tabularnewline
24 & -0.028494 & -0.2596 & 0.397912 \tabularnewline
25 & -0.097814 & -0.8911 & 0.187719 \tabularnewline
26 & -0.155564 & -1.4173 & 0.080076 \tabularnewline
27 & -0.020719 & -0.1888 & 0.425373 \tabularnewline
28 & -0.014755 & -0.1344 & 0.446696 \tabularnewline
29 & -0.018221 & -0.166 & 0.434279 \tabularnewline
30 & -0.053986 & -0.4918 & 0.312067 \tabularnewline
31 & -0.022919 & -0.2088 & 0.417556 \tabularnewline
32 & 0.026824 & 0.2444 & 0.403769 \tabularnewline
33 & -0.064388 & -0.5866 & 0.279531 \tabularnewline
34 & -0.111152 & -1.0126 & 0.157086 \tabularnewline
35 & -0.093395 & -0.8509 & 0.198646 \tabularnewline
36 & 0.004608 & 0.042 & 0.483307 \tabularnewline
37 & -0.020236 & -0.1844 & 0.42709 \tabularnewline
38 & -0.126235 & -1.1501 & 0.126713 \tabularnewline
39 & 0.00069 & 0.0063 & 0.4975 \tabularnewline
40 & 0.069577 & 0.6339 & 0.263952 \tabularnewline
41 & -0.025952 & -0.2364 & 0.406839 \tabularnewline
42 & 0.010373 & 0.0945 & 0.462467 \tabularnewline
43 & 0.053962 & 0.4916 & 0.312143 \tabularnewline
44 & 0.042314 & 0.3855 & 0.350426 \tabularnewline
45 & 0.086606 & 0.789 & 0.216175 \tabularnewline
46 & -0.014884 & -0.1356 & 0.446232 \tabularnewline
47 & 0.002426 & 0.0221 & 0.491208 \tabularnewline
48 & -0.005049 & -0.046 & 0.481712 \tabularnewline
\hline
\end{tabular}
%Source: https://freestatistics.org/blog/index.php?pk=225641&T=2

[TABLE]
[ROW][C]Partial Autocorrelation Function[/C][/ROW]
[ROW][C]Time lag k[/C][C]PACF(k)[/C][C]T-STAT[/C][C]P-value[/C][/ROW]
[ROW][C]1[/C][C]-0.042723[/C][C]-0.3892[/C][C]0.349053[/C][/ROW]
[ROW][C]2[/C][C]-0.121602[/C][C]-1.1078[/C][C]0.135564[/C][/ROW]
[ROW][C]3[/C][C]-0.155313[/C][C]-1.415[/C][C]0.080409[/C][/ROW]
[ROW][C]4[/C][C]-0.126201[/C][C]-1.1497[/C][C]0.126776[/C][/ROW]
[ROW][C]5[/C][C]-0.039963[/C][C]-0.3641[/C][C]0.358362[/C][/ROW]
[ROW][C]6[/C][C]0.282015[/C][C]2.5693[/C][C]0.00599[/C][/ROW]
[ROW][C]7[/C][C]0.132249[/C][C]1.2048[/C][C]0.115844[/C][/ROW]
[ROW][C]8[/C][C]-0.020471[/C][C]-0.1865[/C][C]0.426254[/C][/ROW]
[ROW][C]9[/C][C]-0.078104[/C][C]-0.7116[/C][C]0.239366[/C][/ROW]
[ROW][C]10[/C][C]0.005883[/C][C]0.0536[/C][C]0.478693[/C][/ROW]
[ROW][C]11[/C][C]0.018074[/C][C]0.1647[/C][C]0.434805[/C][/ROW]
[ROW][C]12[/C][C]0.181161[/C][C]1.6505[/C][C]0.051314[/C][/ROW]
[ROW][C]13[/C][C]0.110984[/C][C]1.0111[/C][C]0.15745[/C][/ROW]
[ROW][C]14[/C][C]-0.074097[/C][C]-0.6751[/C][C]0.250758[/C][/ROW]
[ROW][C]15[/C][C]0.035454[/C][C]0.323[/C][C]0.373754[/C][/ROW]
[ROW][C]16[/C][C]-0.085723[/C][C]-0.781[/C][C]0.21852[/C][/ROW]
[ROW][C]17[/C][C]-0.072984[/C][C]-0.6649[/C][C]0.253974[/C][/ROW]
[ROW][C]18[/C][C]0.035277[/C][C]0.3214[/C][C]0.374361[/C][/ROW]
[ROW][C]19[/C][C]0.048681[/C][C]0.4435[/C][C]0.329277[/C][/ROW]
[ROW][C]20[/C][C]0.01036[/C][C]0.0944[/C][C]0.462515[/C][/ROW]
[ROW][C]21[/C][C]-0.087005[/C][C]-0.7927[/C][C]0.215121[/C][/ROW]
[ROW][C]22[/C][C]-0.116894[/C][C]-1.065[/C][C]0.144992[/C][/ROW]
[ROW][C]23[/C][C]-0.035541[/C][C]-0.3238[/C][C]0.373453[/C][/ROW]
[ROW][C]24[/C][C]-0.028494[/C][C]-0.2596[/C][C]0.397912[/C][/ROW]
[ROW][C]25[/C][C]-0.097814[/C][C]-0.8911[/C][C]0.187719[/C][/ROW]
[ROW][C]26[/C][C]-0.155564[/C][C]-1.4173[/C][C]0.080076[/C][/ROW]
[ROW][C]27[/C][C]-0.020719[/C][C]-0.1888[/C][C]0.425373[/C][/ROW]
[ROW][C]28[/C][C]-0.014755[/C][C]-0.1344[/C][C]0.446696[/C][/ROW]
[ROW][C]29[/C][C]-0.018221[/C][C]-0.166[/C][C]0.434279[/C][/ROW]
[ROW][C]30[/C][C]-0.053986[/C][C]-0.4918[/C][C]0.312067[/C][/ROW]
[ROW][C]31[/C][C]-0.022919[/C][C]-0.2088[/C][C]0.417556[/C][/ROW]
[ROW][C]32[/C][C]0.026824[/C][C]0.2444[/C][C]0.403769[/C][/ROW]
[ROW][C]33[/C][C]-0.064388[/C][C]-0.5866[/C][C]0.279531[/C][/ROW]
[ROW][C]34[/C][C]-0.111152[/C][C]-1.0126[/C][C]0.157086[/C][/ROW]
[ROW][C]35[/C][C]-0.093395[/C][C]-0.8509[/C][C]0.198646[/C][/ROW]
[ROW][C]36[/C][C]0.004608[/C][C]0.042[/C][C]0.483307[/C][/ROW]
[ROW][C]37[/C][C]-0.020236[/C][C]-0.1844[/C][C]0.42709[/C][/ROW]
[ROW][C]38[/C][C]-0.126235[/C][C]-1.1501[/C][C]0.126713[/C][/ROW]
[ROW][C]39[/C][C]0.00069[/C][C]0.0063[/C][C]0.4975[/C][/ROW]
[ROW][C]40[/C][C]0.069577[/C][C]0.6339[/C][C]0.263952[/C][/ROW]
[ROW][C]41[/C][C]-0.025952[/C][C]-0.2364[/C][C]0.406839[/C][/ROW]
[ROW][C]42[/C][C]0.010373[/C][C]0.0945[/C][C]0.462467[/C][/ROW]
[ROW][C]43[/C][C]0.053962[/C][C]0.4916[/C][C]0.312143[/C][/ROW]
[ROW][C]44[/C][C]0.042314[/C][C]0.3855[/C][C]0.350426[/C][/ROW]
[ROW][C]45[/C][C]0.086606[/C][C]0.789[/C][C]0.216175[/C][/ROW]
[ROW][C]46[/C][C]-0.014884[/C][C]-0.1356[/C][C]0.446232[/C][/ROW]
[ROW][C]47[/C][C]0.002426[/C][C]0.0221[/C][C]0.491208[/C][/ROW]
[ROW][C]48[/C][C]-0.005049[/C][C]-0.046[/C][C]0.481712[/C][/ROW]
[/TABLE]
Source: https://freestatistics.org/blog/index.php?pk=225641&T=2

Globally Unique Identifier (entire table): ba.freestatistics.org/blog/index.php?pk=225641&T=2

As an alternative you can also use a QR Code:  

The GUIDs for individual cells are displayed in the table below:

Partial Autocorrelation Function
Time lag kPACF(k)T-STATP-value
1-0.042723-0.38920.349053
2-0.121602-1.10780.135564
3-0.155313-1.4150.080409
4-0.126201-1.14970.126776
5-0.039963-0.36410.358362
60.2820152.56930.00599
70.1322491.20480.115844
8-0.020471-0.18650.426254
9-0.078104-0.71160.239366
100.0058830.05360.478693
110.0180740.16470.434805
120.1811611.65050.051314
130.1109841.01110.15745
14-0.074097-0.67510.250758
150.0354540.3230.373754
16-0.085723-0.7810.21852
17-0.072984-0.66490.253974
180.0352770.32140.374361
190.0486810.44350.329277
200.010360.09440.462515
21-0.087005-0.79270.215121
22-0.116894-1.0650.144992
23-0.035541-0.32380.373453
24-0.028494-0.25960.397912
25-0.097814-0.89110.187719
26-0.155564-1.41730.080076
27-0.020719-0.18880.425373
28-0.014755-0.13440.446696
29-0.018221-0.1660.434279
30-0.053986-0.49180.312067
31-0.022919-0.20880.417556
320.0268240.24440.403769
33-0.064388-0.58660.279531
34-0.111152-1.01260.157086
35-0.093395-0.85090.198646
360.0046080.0420.483307
37-0.020236-0.18440.42709
38-0.126235-1.15010.126713
390.000690.00630.4975
400.0695770.63390.263952
41-0.025952-0.23640.406839
420.0103730.09450.462467
430.0539620.49160.312143
440.0423140.38550.350426
450.0866060.7890.216175
46-0.014884-0.13560.446232
470.0024260.02210.491208
48-0.005049-0.0460.481712


Parameters (Session):
par1 = 48 ; par2 = 1 ; par3 = 1 ; par4 = 0 ; par5 = 12 ; par6 = White Noise ; par7 = 0.95 ;
Parameters (R input):
par1 = 48 ; par2 = 1 ; par3 = 1 ; par4 = 0 ; par5 = 12 ; par6 = White Noise ; par7 = 0.95 ; par8 = ;
R code (references can be found in the software module):
par8 <- ''
par7 <- '0.95'
par6 <- 'White Noise'
par5 <- '12'
par4 <- '0'
par3 <- '0'
par2 <- '1'
par1 <- '48'
if (par1 == 'Default') {
par1 = 10*log10(length(x))
} else {
par1 <- as.numeric(par1)
}
par2 <- as.numeric(par2)
par3 <- as.numeric(par3)
par4 <- as.numeric(par4)
par5 <- as.numeric(par5)
if (par6 == 'White Noise') par6 <- 'white' else par6 <- 'ma'
par7 <- as.numeric(par7)
if (par8 != '') par8 <- as.numeric(par8)
ox <- x
if (par8 == '') {
if (par2 == 0) {
x <- log(x)
} else {
x <- (x ^ par2 - 1) / par2
}
} else {
x <- log(x,base=par8)
}
if (par3 > 0) x <- diff(x,lag=1,difference=par3)
if (par4 > 0) x <- diff(x,lag=par5,difference=par4)
bitmap(file='picts.png')
op <- par(mfrow=c(2,1))
plot(ox,type='l',main='Original Time Series',xlab='time',ylab='value')
if (par8=='') {
mytitle <- paste('Working Time Series (lambda=',par2,', d=',par3,', D=',par4,')',sep='')
mysub <- paste('(lambda=',par2,', d=',par3,', D=',par4,', CI=', par7, ', CI type=',par6,')',sep='')
} else {
mytitle <- paste('Working Time Series (base=',par8,', d=',par3,', D=',par4,')',sep='')
mysub <- paste('(base=',par8,', d=',par3,', D=',par4,', CI=', par7, ', CI type=',par6,')',sep='')
}
plot(x,type='l', main=mytitle,xlab='time',ylab='value')
par(op)
dev.off()
bitmap(file='pic1.png')
racf <- acf(x, par1, main='Autocorrelation', xlab='time lag', ylab='ACF', ci.type=par6, ci=par7, sub=mysub)
dev.off()
bitmap(file='pic2.png')
rpacf <- pacf(x,par1,main='Partial Autocorrelation',xlab='lags',ylab='PACF',sub=mysub)
dev.off()
(myacf <- c(racf$acf))
(mypacf <- c(rpacf$acf))
lengthx <- length(x)
sqrtn <- sqrt(lengthx)
load(file='createtable')
a<-table.start()
a<-table.row.start(a)
a<-table.element(a,'Autocorrelation Function',4,TRUE)
a<-table.row.end(a)
a<-table.row.start(a)
a<-table.element(a,'Time lag k',header=TRUE)
a<-table.element(a,hyperlink('basics.htm','ACF(k)','click here for more information about the Autocorrelation Function'),header=TRUE)
a<-table.element(a,'T-STAT',header=TRUE)
a<-table.element(a,'P-value',header=TRUE)
a<-table.row.end(a)
for (i in 2:(par1+1)) {
a<-table.row.start(a)
a<-table.element(a,i-1,header=TRUE)
a<-table.element(a,round(myacf[i],6))
mytstat <- myacf[i]*sqrtn
a<-table.element(a,round(mytstat,4))
a<-table.element(a,round(1-pt(abs(mytstat),lengthx),6))
a<-table.row.end(a)
}
a<-table.end(a)
table.save(a,file='mytable.tab')
a<-table.start()
a<-table.row.start(a)
a<-table.element(a,'Partial Autocorrelation Function',4,TRUE)
a<-table.row.end(a)
a<-table.row.start(a)
a<-table.element(a,'Time lag k',header=TRUE)
a<-table.element(a,hyperlink('basics.htm','PACF(k)','click here for more information about the Partial Autocorrelation Function'),header=TRUE)
a<-table.element(a,'T-STAT',header=TRUE)
a<-table.element(a,'P-value',header=TRUE)
a<-table.row.end(a)
for (i in 1:par1) {
a<-table.row.start(a)
a<-table.element(a,i,header=TRUE)
a<-table.element(a,round(mypacf[i],6))
mytstat <- mypacf[i]*sqrtn
a<-table.element(a,round(mytstat,4))
a<-table.element(a,round(1-pt(abs(mytstat),lengthx),6))
a<-table.row.end(a)
}
a<-table.end(a)
table.save(a,file='mytable1.tab')