Free Statistics

of Irreproducible Research!

Author's title

Author*Unverified author*
R Software Modulerwasp_autocorrelation.wasp
Title produced by software(Partial) Autocorrelation Function
Date of computationFri, 15 Nov 2013 10:37:26 -0500
Cite this page as followsStatistical Computations at FreeStatistics.org, Office for Research Development and Education, URL https://freestatistics.org/blog/index.php?v=date/2013/Nov/15/t1384529882zc21s9ct9w1r8hy.htm/, Retrieved Tue, 30 Apr 2024 17:41:46 +0000
Statistical Computations at FreeStatistics.org, Office for Research Development and Education, URL https://freestatistics.org/blog/index.php?pk=225505, Retrieved Tue, 30 Apr 2024 17:41:46 +0000
QR Codes:

Original text written by user:
IsPrivate?No (this computation is public)
User-defined keywords
Estimated Impact52
Family? (F = Feedback message, R = changed R code, M = changed R Module, P = changed Parameters, D = changed Data)
-       [(Partial) Autocorrelation Function] [] [2013-11-15 15:37:26] [17b6b1d507219cce54aa3edb43843a55] [Current]
Feedback Forum

Post a new message
Dataseries X:
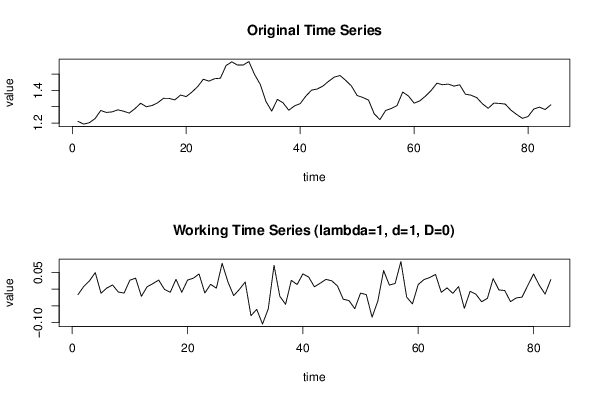
1,2103
1,1938
1,202
1,2271
1,277
1,265
1,2684
1,2811
1,2727
1,2611
1,2881
1,3213
1,2999
1,3074
1,3242
1,3516
1,3511
1,3419
1,3716
1,3622
1,3896
1,4227
1,4684
1,457
1,4718
1,4748
1,5527
1,5751
1,5557
1,5553
1,577
1,4975
1,4369
1,3322
1,2732
1,3449
1,3239
1,2785
1,305
1,319
1,365
1,4016
1,4088
1,4268
1,4562
1,4816
1,4914
1,4614
1,4272
1,3686
1,3569
1,3406
1,2565
1,2209
1,277
1,2894
1,3067
1,3898
1,3661
1,322
1,336
1,3649
1,3999
1,4442
1,4349
1,4388
1,4264
1,4343
1,377
1,3706
1,3556
1,3179
1,2905
1,3224
1,3201
1,3162
1,2789
1,2526
1,2288
1,24
1,2856
1,2974
1,2828
1,3119


Summary of computational transaction
Raw Inputview raw input (R code)
Raw Outputview raw output of R engine
Computing time3 seconds
R Server'Gertrude Mary Cox' @ cox.wessa.net

\begin{tabular}{lllllllll}
\hline
Summary of computational transaction \tabularnewline
Raw Input & view raw input (R code)  \tabularnewline
Raw Output & view raw output of R engine  \tabularnewline
Computing time & 3 seconds \tabularnewline
R Server & 'Gertrude Mary Cox' @ cox.wessa.net \tabularnewline
\hline
\end{tabular}
%Source: https://freestatistics.org/blog/index.php?pk=225505&T=0

[TABLE]
[ROW][C]Summary of computational transaction[/C][/ROW]
[ROW][C]Raw Input[/C][C]view raw input (R code) [/C][/ROW]
[ROW][C]Raw Output[/C][C]view raw output of R engine [/C][/ROW]
[ROW][C]Computing time[/C][C]3 seconds[/C][/ROW]
[ROW][C]R Server[/C][C]'Gertrude Mary Cox' @ cox.wessa.net[/C][/ROW]
[/TABLE]
Source: https://freestatistics.org/blog/index.php?pk=225505&T=0

Globally Unique Identifier (entire table): ba.freestatistics.org/blog/index.php?pk=225505&T=0

As an alternative you can also use a QR Code:  

The GUIDs for individual cells are displayed in the table below:

Summary of computational transaction
Raw Inputview raw input (R code)
Raw Outputview raw output of R engine
Computing time3 seconds
R Server'Gertrude Mary Cox' @ cox.wessa.net


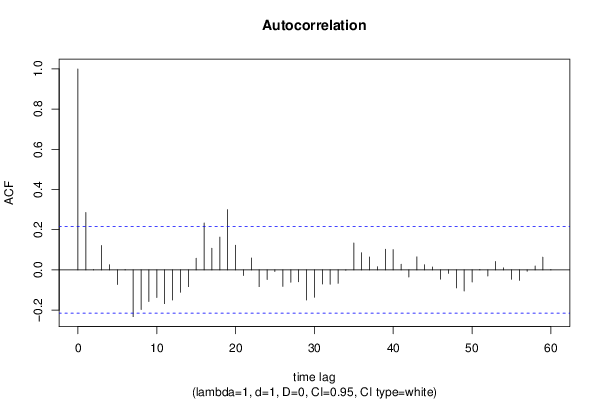
Autocorrelation Function
Time lag kACF(k)T-STATP-value
10.2855192.60120.005499
2-0.000702-0.00640.497458
30.1216371.10820.135495
40.0254140.23150.408735
5-0.072568-0.66110.255181
60.0014230.0130.494842
7-0.232704-2.120.018495
8-0.196975-1.79450.038185
9-0.157627-1.4360.077373
10-0.137808-1.25550.106411
11-0.168012-1.53070.064827
12-0.150141-1.36790.087525
13-0.111531-1.01610.156269
14-0.083363-0.75950.22486
150.0576110.52490.300538
160.2337162.12930.018098
170.1079070.98310.164212
180.1632521.48730.070362
190.3000492.73360.003828
200.1228861.11950.133068
21-0.027982-0.25490.399705
220.0592920.54020.295261
23-0.083223-0.75820.225241
24-0.047665-0.43420.332618
25-0.008163-0.07440.470449
26-0.082017-0.74720.228523
27-0.061488-0.56020.288432
28-0.059202-0.53940.295543
29-0.149683-1.36370.088179
30-0.136013-1.23910.109393
31-0.070165-0.63920.262215
32-0.071397-0.65050.258596
33-0.066978-0.61020.2717
34-0.002231-0.02030.491918
350.1341431.22210.112564
360.0849420.77390.220606
370.0637850.58110.28137
380.0155010.14120.444019
390.1026920.93560.176105
400.1007740.91810.180614
410.0279430.25460.39984
42-0.035351-0.32210.374108
430.0647930.59030.278298
440.025890.23590.407058
450.0140730.12820.449146
46-0.046154-0.42050.33761
47-0.017347-0.1580.437404
48-0.089652-0.81680.2082
49-0.1053-0.95930.170089
50-0.060072-0.54730.292826
510.0023790.02170.491379
52-0.030113-0.27430.392252
530.0421690.38420.350915
540.0100280.09140.463714
55-0.046814-0.42650.335424
56-0.052341-0.47690.31736
57-0.006461-0.05890.4766
580.0194250.1770.42998
590.063410.57770.282518
60-0.000971-0.00890.49648

\begin{tabular}{lllllllll}
\hline
Autocorrelation Function \tabularnewline
Time lag k & ACF(k) & T-STAT & P-value \tabularnewline
1 & 0.285519 & 2.6012 & 0.005499 \tabularnewline
2 & -0.000702 & -0.0064 & 0.497458 \tabularnewline
3 & 0.121637 & 1.1082 & 0.135495 \tabularnewline
4 & 0.025414 & 0.2315 & 0.408735 \tabularnewline
5 & -0.072568 & -0.6611 & 0.255181 \tabularnewline
6 & 0.001423 & 0.013 & 0.494842 \tabularnewline
7 & -0.232704 & -2.12 & 0.018495 \tabularnewline
8 & -0.196975 & -1.7945 & 0.038185 \tabularnewline
9 & -0.157627 & -1.436 & 0.077373 \tabularnewline
10 & -0.137808 & -1.2555 & 0.106411 \tabularnewline
11 & -0.168012 & -1.5307 & 0.064827 \tabularnewline
12 & -0.150141 & -1.3679 & 0.087525 \tabularnewline
13 & -0.111531 & -1.0161 & 0.156269 \tabularnewline
14 & -0.083363 & -0.7595 & 0.22486 \tabularnewline
15 & 0.057611 & 0.5249 & 0.300538 \tabularnewline
16 & 0.233716 & 2.1293 & 0.018098 \tabularnewline
17 & 0.107907 & 0.9831 & 0.164212 \tabularnewline
18 & 0.163252 & 1.4873 & 0.070362 \tabularnewline
19 & 0.300049 & 2.7336 & 0.003828 \tabularnewline
20 & 0.122886 & 1.1195 & 0.133068 \tabularnewline
21 & -0.027982 & -0.2549 & 0.399705 \tabularnewline
22 & 0.059292 & 0.5402 & 0.295261 \tabularnewline
23 & -0.083223 & -0.7582 & 0.225241 \tabularnewline
24 & -0.047665 & -0.4342 & 0.332618 \tabularnewline
25 & -0.008163 & -0.0744 & 0.470449 \tabularnewline
26 & -0.082017 & -0.7472 & 0.228523 \tabularnewline
27 & -0.061488 & -0.5602 & 0.288432 \tabularnewline
28 & -0.059202 & -0.5394 & 0.295543 \tabularnewline
29 & -0.149683 & -1.3637 & 0.088179 \tabularnewline
30 & -0.136013 & -1.2391 & 0.109393 \tabularnewline
31 & -0.070165 & -0.6392 & 0.262215 \tabularnewline
32 & -0.071397 & -0.6505 & 0.258596 \tabularnewline
33 & -0.066978 & -0.6102 & 0.2717 \tabularnewline
34 & -0.002231 & -0.0203 & 0.491918 \tabularnewline
35 & 0.134143 & 1.2221 & 0.112564 \tabularnewline
36 & 0.084942 & 0.7739 & 0.220606 \tabularnewline
37 & 0.063785 & 0.5811 & 0.28137 \tabularnewline
38 & 0.015501 & 0.1412 & 0.444019 \tabularnewline
39 & 0.102692 & 0.9356 & 0.176105 \tabularnewline
40 & 0.100774 & 0.9181 & 0.180614 \tabularnewline
41 & 0.027943 & 0.2546 & 0.39984 \tabularnewline
42 & -0.035351 & -0.3221 & 0.374108 \tabularnewline
43 & 0.064793 & 0.5903 & 0.278298 \tabularnewline
44 & 0.02589 & 0.2359 & 0.407058 \tabularnewline
45 & 0.014073 & 0.1282 & 0.449146 \tabularnewline
46 & -0.046154 & -0.4205 & 0.33761 \tabularnewline
47 & -0.017347 & -0.158 & 0.437404 \tabularnewline
48 & -0.089652 & -0.8168 & 0.2082 \tabularnewline
49 & -0.1053 & -0.9593 & 0.170089 \tabularnewline
50 & -0.060072 & -0.5473 & 0.292826 \tabularnewline
51 & 0.002379 & 0.0217 & 0.491379 \tabularnewline
52 & -0.030113 & -0.2743 & 0.392252 \tabularnewline
53 & 0.042169 & 0.3842 & 0.350915 \tabularnewline
54 & 0.010028 & 0.0914 & 0.463714 \tabularnewline
55 & -0.046814 & -0.4265 & 0.335424 \tabularnewline
56 & -0.052341 & -0.4769 & 0.31736 \tabularnewline
57 & -0.006461 & -0.0589 & 0.4766 \tabularnewline
58 & 0.019425 & 0.177 & 0.42998 \tabularnewline
59 & 0.06341 & 0.5777 & 0.282518 \tabularnewline
60 & -0.000971 & -0.0089 & 0.49648 \tabularnewline
\hline
\end{tabular}
%Source: https://freestatistics.org/blog/index.php?pk=225505&T=1

[TABLE]
[ROW][C]Autocorrelation Function[/C][/ROW]
[ROW][C]Time lag k[/C][C]ACF(k)[/C][C]T-STAT[/C][C]P-value[/C][/ROW]
[ROW][C]1[/C][C]0.285519[/C][C]2.6012[/C][C]0.005499[/C][/ROW]
[ROW][C]2[/C][C]-0.000702[/C][C]-0.0064[/C][C]0.497458[/C][/ROW]
[ROW][C]3[/C][C]0.121637[/C][C]1.1082[/C][C]0.135495[/C][/ROW]
[ROW][C]4[/C][C]0.025414[/C][C]0.2315[/C][C]0.408735[/C][/ROW]
[ROW][C]5[/C][C]-0.072568[/C][C]-0.6611[/C][C]0.255181[/C][/ROW]
[ROW][C]6[/C][C]0.001423[/C][C]0.013[/C][C]0.494842[/C][/ROW]
[ROW][C]7[/C][C]-0.232704[/C][C]-2.12[/C][C]0.018495[/C][/ROW]
[ROW][C]8[/C][C]-0.196975[/C][C]-1.7945[/C][C]0.038185[/C][/ROW]
[ROW][C]9[/C][C]-0.157627[/C][C]-1.436[/C][C]0.077373[/C][/ROW]
[ROW][C]10[/C][C]-0.137808[/C][C]-1.2555[/C][C]0.106411[/C][/ROW]
[ROW][C]11[/C][C]-0.168012[/C][C]-1.5307[/C][C]0.064827[/C][/ROW]
[ROW][C]12[/C][C]-0.150141[/C][C]-1.3679[/C][C]0.087525[/C][/ROW]
[ROW][C]13[/C][C]-0.111531[/C][C]-1.0161[/C][C]0.156269[/C][/ROW]
[ROW][C]14[/C][C]-0.083363[/C][C]-0.7595[/C][C]0.22486[/C][/ROW]
[ROW][C]15[/C][C]0.057611[/C][C]0.5249[/C][C]0.300538[/C][/ROW]
[ROW][C]16[/C][C]0.233716[/C][C]2.1293[/C][C]0.018098[/C][/ROW]
[ROW][C]17[/C][C]0.107907[/C][C]0.9831[/C][C]0.164212[/C][/ROW]
[ROW][C]18[/C][C]0.163252[/C][C]1.4873[/C][C]0.070362[/C][/ROW]
[ROW][C]19[/C][C]0.300049[/C][C]2.7336[/C][C]0.003828[/C][/ROW]
[ROW][C]20[/C][C]0.122886[/C][C]1.1195[/C][C]0.133068[/C][/ROW]
[ROW][C]21[/C][C]-0.027982[/C][C]-0.2549[/C][C]0.399705[/C][/ROW]
[ROW][C]22[/C][C]0.059292[/C][C]0.5402[/C][C]0.295261[/C][/ROW]
[ROW][C]23[/C][C]-0.083223[/C][C]-0.7582[/C][C]0.225241[/C][/ROW]
[ROW][C]24[/C][C]-0.047665[/C][C]-0.4342[/C][C]0.332618[/C][/ROW]
[ROW][C]25[/C][C]-0.008163[/C][C]-0.0744[/C][C]0.470449[/C][/ROW]
[ROW][C]26[/C][C]-0.082017[/C][C]-0.7472[/C][C]0.228523[/C][/ROW]
[ROW][C]27[/C][C]-0.061488[/C][C]-0.5602[/C][C]0.288432[/C][/ROW]
[ROW][C]28[/C][C]-0.059202[/C][C]-0.5394[/C][C]0.295543[/C][/ROW]
[ROW][C]29[/C][C]-0.149683[/C][C]-1.3637[/C][C]0.088179[/C][/ROW]
[ROW][C]30[/C][C]-0.136013[/C][C]-1.2391[/C][C]0.109393[/C][/ROW]
[ROW][C]31[/C][C]-0.070165[/C][C]-0.6392[/C][C]0.262215[/C][/ROW]
[ROW][C]32[/C][C]-0.071397[/C][C]-0.6505[/C][C]0.258596[/C][/ROW]
[ROW][C]33[/C][C]-0.066978[/C][C]-0.6102[/C][C]0.2717[/C][/ROW]
[ROW][C]34[/C][C]-0.002231[/C][C]-0.0203[/C][C]0.491918[/C][/ROW]
[ROW][C]35[/C][C]0.134143[/C][C]1.2221[/C][C]0.112564[/C][/ROW]
[ROW][C]36[/C][C]0.084942[/C][C]0.7739[/C][C]0.220606[/C][/ROW]
[ROW][C]37[/C][C]0.063785[/C][C]0.5811[/C][C]0.28137[/C][/ROW]
[ROW][C]38[/C][C]0.015501[/C][C]0.1412[/C][C]0.444019[/C][/ROW]
[ROW][C]39[/C][C]0.102692[/C][C]0.9356[/C][C]0.176105[/C][/ROW]
[ROW][C]40[/C][C]0.100774[/C][C]0.9181[/C][C]0.180614[/C][/ROW]
[ROW][C]41[/C][C]0.027943[/C][C]0.2546[/C][C]0.39984[/C][/ROW]
[ROW][C]42[/C][C]-0.035351[/C][C]-0.3221[/C][C]0.374108[/C][/ROW]
[ROW][C]43[/C][C]0.064793[/C][C]0.5903[/C][C]0.278298[/C][/ROW]
[ROW][C]44[/C][C]0.02589[/C][C]0.2359[/C][C]0.407058[/C][/ROW]
[ROW][C]45[/C][C]0.014073[/C][C]0.1282[/C][C]0.449146[/C][/ROW]
[ROW][C]46[/C][C]-0.046154[/C][C]-0.4205[/C][C]0.33761[/C][/ROW]
[ROW][C]47[/C][C]-0.017347[/C][C]-0.158[/C][C]0.437404[/C][/ROW]
[ROW][C]48[/C][C]-0.089652[/C][C]-0.8168[/C][C]0.2082[/C][/ROW]
[ROW][C]49[/C][C]-0.1053[/C][C]-0.9593[/C][C]0.170089[/C][/ROW]
[ROW][C]50[/C][C]-0.060072[/C][C]-0.5473[/C][C]0.292826[/C][/ROW]
[ROW][C]51[/C][C]0.002379[/C][C]0.0217[/C][C]0.491379[/C][/ROW]
[ROW][C]52[/C][C]-0.030113[/C][C]-0.2743[/C][C]0.392252[/C][/ROW]
[ROW][C]53[/C][C]0.042169[/C][C]0.3842[/C][C]0.350915[/C][/ROW]
[ROW][C]54[/C][C]0.010028[/C][C]0.0914[/C][C]0.463714[/C][/ROW]
[ROW][C]55[/C][C]-0.046814[/C][C]-0.4265[/C][C]0.335424[/C][/ROW]
[ROW][C]56[/C][C]-0.052341[/C][C]-0.4769[/C][C]0.31736[/C][/ROW]
[ROW][C]57[/C][C]-0.006461[/C][C]-0.0589[/C][C]0.4766[/C][/ROW]
[ROW][C]58[/C][C]0.019425[/C][C]0.177[/C][C]0.42998[/C][/ROW]
[ROW][C]59[/C][C]0.06341[/C][C]0.5777[/C][C]0.282518[/C][/ROW]
[ROW][C]60[/C][C]-0.000971[/C][C]-0.0089[/C][C]0.49648[/C][/ROW]
[/TABLE]
Source: https://freestatistics.org/blog/index.php?pk=225505&T=1

Globally Unique Identifier (entire table): ba.freestatistics.org/blog/index.php?pk=225505&T=1

As an alternative you can also use a QR Code:  

The GUIDs for individual cells are displayed in the table below:

Autocorrelation Function
Time lag kACF(k)T-STATP-value
10.2855192.60120.005499
2-0.000702-0.00640.497458
30.1216371.10820.135495
40.0254140.23150.408735
5-0.072568-0.66110.255181
60.0014230.0130.494842
7-0.232704-2.120.018495
8-0.196975-1.79450.038185
9-0.157627-1.4360.077373
10-0.137808-1.25550.106411
11-0.168012-1.53070.064827
12-0.150141-1.36790.087525
13-0.111531-1.01610.156269
14-0.083363-0.75950.22486
150.0576110.52490.300538
160.2337162.12930.018098
170.1079070.98310.164212
180.1632521.48730.070362
190.3000492.73360.003828
200.1228861.11950.133068
21-0.027982-0.25490.399705
220.0592920.54020.295261
23-0.083223-0.75820.225241
24-0.047665-0.43420.332618
25-0.008163-0.07440.470449
26-0.082017-0.74720.228523
27-0.061488-0.56020.288432
28-0.059202-0.53940.295543
29-0.149683-1.36370.088179
30-0.136013-1.23910.109393
31-0.070165-0.63920.262215
32-0.071397-0.65050.258596
33-0.066978-0.61020.2717
34-0.002231-0.02030.491918
350.1341431.22210.112564
360.0849420.77390.220606
370.0637850.58110.28137
380.0155010.14120.444019
390.1026920.93560.176105
400.1007740.91810.180614
410.0279430.25460.39984
42-0.035351-0.32210.374108
430.0647930.59030.278298
440.025890.23590.407058
450.0140730.12820.449146
46-0.046154-0.42050.33761
47-0.017347-0.1580.437404
48-0.089652-0.81680.2082
49-0.1053-0.95930.170089
50-0.060072-0.54730.292826
510.0023790.02170.491379
52-0.030113-0.27430.392252
530.0421690.38420.350915
540.0100280.09140.463714
55-0.046814-0.42650.335424
56-0.052341-0.47690.31736
57-0.006461-0.05890.4766
580.0194250.1770.42998
590.063410.57770.282518
60-0.000971-0.00890.49648


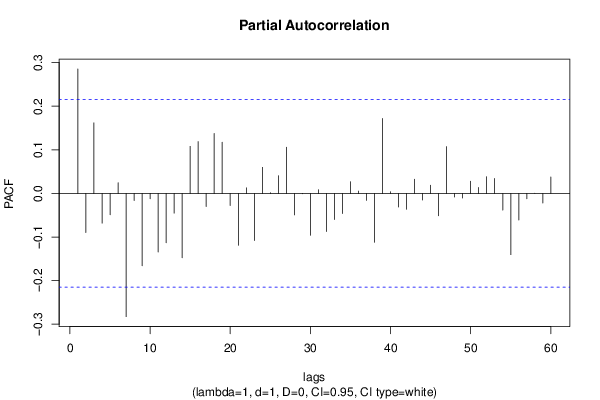
Partial Autocorrelation Function
Time lag kPACF(k)T-STATP-value
10.2855192.60120.005499
2-0.089521-0.81560.208539
30.1617961.4740.072128
4-0.068165-0.6210.268146
5-0.049097-0.44730.327913
60.0245940.22410.411631
7-0.282633-2.57490.0059
8-0.016385-0.14930.44085
9-0.166018-1.51250.067103
10-0.01212-0.11040.456172
11-0.134258-1.22320.112367
12-0.113261-1.03190.152568
13-0.045258-0.41230.340584
14-0.147368-1.34260.091534
150.1079950.98390.164016
160.1188791.0830.140964
17-0.030049-0.27380.392474
180.1374581.25230.106989
190.1173851.06940.143988
20-0.027573-0.25120.401139
21-0.119064-1.08470.140593
220.0128440.1170.453566
23-0.107987-0.98380.164034
240.0598710.54550.293452
250.0017390.01580.4937
260.0405990.36990.356208
270.1059050.96480.168715
28-0.049265-0.44880.327362
29-0.000615-0.00560.497771
30-0.095989-0.87450.192184
310.0084930.07740.469255
32-0.087281-0.79520.214393
33-0.059632-0.54330.294198
34-0.046102-0.420.337781
350.0269680.24570.403266
360.0053920.04910.480469
37-0.015893-0.14480.442614
38-0.112049-1.02080.155155
390.1719671.56670.060496
400.0039250.03580.485779
41-0.03127-0.28490.388222
42-0.036285-0.33060.370901
430.0323810.2950.384364
44-0.015106-0.13760.445435
450.0187540.17090.432375
46-0.051386-0.46820.320451
470.1073320.97780.165497
48-0.008249-0.07520.470136
49-0.010555-0.09620.461813
500.0279050.25420.399974
510.0135560.12350.451004
520.0383960.34980.363685
530.0343040.31250.377714
54-0.038244-0.34840.364203
55-0.140338-1.27850.102311
56-0.061065-0.55630.289741
57-0.012033-0.10960.456487
580.0002570.00230.499067
59-0.021853-0.19910.421339
600.0376540.3430.366217

\begin{tabular}{lllllllll}
\hline
Partial Autocorrelation Function \tabularnewline
Time lag k & PACF(k) & T-STAT & P-value \tabularnewline
1 & 0.285519 & 2.6012 & 0.005499 \tabularnewline
2 & -0.089521 & -0.8156 & 0.208539 \tabularnewline
3 & 0.161796 & 1.474 & 0.072128 \tabularnewline
4 & -0.068165 & -0.621 & 0.268146 \tabularnewline
5 & -0.049097 & -0.4473 & 0.327913 \tabularnewline
6 & 0.024594 & 0.2241 & 0.411631 \tabularnewline
7 & -0.282633 & -2.5749 & 0.0059 \tabularnewline
8 & -0.016385 & -0.1493 & 0.44085 \tabularnewline
9 & -0.166018 & -1.5125 & 0.067103 \tabularnewline
10 & -0.01212 & -0.1104 & 0.456172 \tabularnewline
11 & -0.134258 & -1.2232 & 0.112367 \tabularnewline
12 & -0.113261 & -1.0319 & 0.152568 \tabularnewline
13 & -0.045258 & -0.4123 & 0.340584 \tabularnewline
14 & -0.147368 & -1.3426 & 0.091534 \tabularnewline
15 & 0.107995 & 0.9839 & 0.164016 \tabularnewline
16 & 0.118879 & 1.083 & 0.140964 \tabularnewline
17 & -0.030049 & -0.2738 & 0.392474 \tabularnewline
18 & 0.137458 & 1.2523 & 0.106989 \tabularnewline
19 & 0.117385 & 1.0694 & 0.143988 \tabularnewline
20 & -0.027573 & -0.2512 & 0.401139 \tabularnewline
21 & -0.119064 & -1.0847 & 0.140593 \tabularnewline
22 & 0.012844 & 0.117 & 0.453566 \tabularnewline
23 & -0.107987 & -0.9838 & 0.164034 \tabularnewline
24 & 0.059871 & 0.5455 & 0.293452 \tabularnewline
25 & 0.001739 & 0.0158 & 0.4937 \tabularnewline
26 & 0.040599 & 0.3699 & 0.356208 \tabularnewline
27 & 0.105905 & 0.9648 & 0.168715 \tabularnewline
28 & -0.049265 & -0.4488 & 0.327362 \tabularnewline
29 & -0.000615 & -0.0056 & 0.497771 \tabularnewline
30 & -0.095989 & -0.8745 & 0.192184 \tabularnewline
31 & 0.008493 & 0.0774 & 0.469255 \tabularnewline
32 & -0.087281 & -0.7952 & 0.214393 \tabularnewline
33 & -0.059632 & -0.5433 & 0.294198 \tabularnewline
34 & -0.046102 & -0.42 & 0.337781 \tabularnewline
35 & 0.026968 & 0.2457 & 0.403266 \tabularnewline
36 & 0.005392 & 0.0491 & 0.480469 \tabularnewline
37 & -0.015893 & -0.1448 & 0.442614 \tabularnewline
38 & -0.112049 & -1.0208 & 0.155155 \tabularnewline
39 & 0.171967 & 1.5667 & 0.060496 \tabularnewline
40 & 0.003925 & 0.0358 & 0.485779 \tabularnewline
41 & -0.03127 & -0.2849 & 0.388222 \tabularnewline
42 & -0.036285 & -0.3306 & 0.370901 \tabularnewline
43 & 0.032381 & 0.295 & 0.384364 \tabularnewline
44 & -0.015106 & -0.1376 & 0.445435 \tabularnewline
45 & 0.018754 & 0.1709 & 0.432375 \tabularnewline
46 & -0.051386 & -0.4682 & 0.320451 \tabularnewline
47 & 0.107332 & 0.9778 & 0.165497 \tabularnewline
48 & -0.008249 & -0.0752 & 0.470136 \tabularnewline
49 & -0.010555 & -0.0962 & 0.461813 \tabularnewline
50 & 0.027905 & 0.2542 & 0.399974 \tabularnewline
51 & 0.013556 & 0.1235 & 0.451004 \tabularnewline
52 & 0.038396 & 0.3498 & 0.363685 \tabularnewline
53 & 0.034304 & 0.3125 & 0.377714 \tabularnewline
54 & -0.038244 & -0.3484 & 0.364203 \tabularnewline
55 & -0.140338 & -1.2785 & 0.102311 \tabularnewline
56 & -0.061065 & -0.5563 & 0.289741 \tabularnewline
57 & -0.012033 & -0.1096 & 0.456487 \tabularnewline
58 & 0.000257 & 0.0023 & 0.499067 \tabularnewline
59 & -0.021853 & -0.1991 & 0.421339 \tabularnewline
60 & 0.037654 & 0.343 & 0.366217 \tabularnewline
\hline
\end{tabular}
%Source: https://freestatistics.org/blog/index.php?pk=225505&T=2

[TABLE]
[ROW][C]Partial Autocorrelation Function[/C][/ROW]
[ROW][C]Time lag k[/C][C]PACF(k)[/C][C]T-STAT[/C][C]P-value[/C][/ROW]
[ROW][C]1[/C][C]0.285519[/C][C]2.6012[/C][C]0.005499[/C][/ROW]
[ROW][C]2[/C][C]-0.089521[/C][C]-0.8156[/C][C]0.208539[/C][/ROW]
[ROW][C]3[/C][C]0.161796[/C][C]1.474[/C][C]0.072128[/C][/ROW]
[ROW][C]4[/C][C]-0.068165[/C][C]-0.621[/C][C]0.268146[/C][/ROW]
[ROW][C]5[/C][C]-0.049097[/C][C]-0.4473[/C][C]0.327913[/C][/ROW]
[ROW][C]6[/C][C]0.024594[/C][C]0.2241[/C][C]0.411631[/C][/ROW]
[ROW][C]7[/C][C]-0.282633[/C][C]-2.5749[/C][C]0.0059[/C][/ROW]
[ROW][C]8[/C][C]-0.016385[/C][C]-0.1493[/C][C]0.44085[/C][/ROW]
[ROW][C]9[/C][C]-0.166018[/C][C]-1.5125[/C][C]0.067103[/C][/ROW]
[ROW][C]10[/C][C]-0.01212[/C][C]-0.1104[/C][C]0.456172[/C][/ROW]
[ROW][C]11[/C][C]-0.134258[/C][C]-1.2232[/C][C]0.112367[/C][/ROW]
[ROW][C]12[/C][C]-0.113261[/C][C]-1.0319[/C][C]0.152568[/C][/ROW]
[ROW][C]13[/C][C]-0.045258[/C][C]-0.4123[/C][C]0.340584[/C][/ROW]
[ROW][C]14[/C][C]-0.147368[/C][C]-1.3426[/C][C]0.091534[/C][/ROW]
[ROW][C]15[/C][C]0.107995[/C][C]0.9839[/C][C]0.164016[/C][/ROW]
[ROW][C]16[/C][C]0.118879[/C][C]1.083[/C][C]0.140964[/C][/ROW]
[ROW][C]17[/C][C]-0.030049[/C][C]-0.2738[/C][C]0.392474[/C][/ROW]
[ROW][C]18[/C][C]0.137458[/C][C]1.2523[/C][C]0.106989[/C][/ROW]
[ROW][C]19[/C][C]0.117385[/C][C]1.0694[/C][C]0.143988[/C][/ROW]
[ROW][C]20[/C][C]-0.027573[/C][C]-0.2512[/C][C]0.401139[/C][/ROW]
[ROW][C]21[/C][C]-0.119064[/C][C]-1.0847[/C][C]0.140593[/C][/ROW]
[ROW][C]22[/C][C]0.012844[/C][C]0.117[/C][C]0.453566[/C][/ROW]
[ROW][C]23[/C][C]-0.107987[/C][C]-0.9838[/C][C]0.164034[/C][/ROW]
[ROW][C]24[/C][C]0.059871[/C][C]0.5455[/C][C]0.293452[/C][/ROW]
[ROW][C]25[/C][C]0.001739[/C][C]0.0158[/C][C]0.4937[/C][/ROW]
[ROW][C]26[/C][C]0.040599[/C][C]0.3699[/C][C]0.356208[/C][/ROW]
[ROW][C]27[/C][C]0.105905[/C][C]0.9648[/C][C]0.168715[/C][/ROW]
[ROW][C]28[/C][C]-0.049265[/C][C]-0.4488[/C][C]0.327362[/C][/ROW]
[ROW][C]29[/C][C]-0.000615[/C][C]-0.0056[/C][C]0.497771[/C][/ROW]
[ROW][C]30[/C][C]-0.095989[/C][C]-0.8745[/C][C]0.192184[/C][/ROW]
[ROW][C]31[/C][C]0.008493[/C][C]0.0774[/C][C]0.469255[/C][/ROW]
[ROW][C]32[/C][C]-0.087281[/C][C]-0.7952[/C][C]0.214393[/C][/ROW]
[ROW][C]33[/C][C]-0.059632[/C][C]-0.5433[/C][C]0.294198[/C][/ROW]
[ROW][C]34[/C][C]-0.046102[/C][C]-0.42[/C][C]0.337781[/C][/ROW]
[ROW][C]35[/C][C]0.026968[/C][C]0.2457[/C][C]0.403266[/C][/ROW]
[ROW][C]36[/C][C]0.005392[/C][C]0.0491[/C][C]0.480469[/C][/ROW]
[ROW][C]37[/C][C]-0.015893[/C][C]-0.1448[/C][C]0.442614[/C][/ROW]
[ROW][C]38[/C][C]-0.112049[/C][C]-1.0208[/C][C]0.155155[/C][/ROW]
[ROW][C]39[/C][C]0.171967[/C][C]1.5667[/C][C]0.060496[/C][/ROW]
[ROW][C]40[/C][C]0.003925[/C][C]0.0358[/C][C]0.485779[/C][/ROW]
[ROW][C]41[/C][C]-0.03127[/C][C]-0.2849[/C][C]0.388222[/C][/ROW]
[ROW][C]42[/C][C]-0.036285[/C][C]-0.3306[/C][C]0.370901[/C][/ROW]
[ROW][C]43[/C][C]0.032381[/C][C]0.295[/C][C]0.384364[/C][/ROW]
[ROW][C]44[/C][C]-0.015106[/C][C]-0.1376[/C][C]0.445435[/C][/ROW]
[ROW][C]45[/C][C]0.018754[/C][C]0.1709[/C][C]0.432375[/C][/ROW]
[ROW][C]46[/C][C]-0.051386[/C][C]-0.4682[/C][C]0.320451[/C][/ROW]
[ROW][C]47[/C][C]0.107332[/C][C]0.9778[/C][C]0.165497[/C][/ROW]
[ROW][C]48[/C][C]-0.008249[/C][C]-0.0752[/C][C]0.470136[/C][/ROW]
[ROW][C]49[/C][C]-0.010555[/C][C]-0.0962[/C][C]0.461813[/C][/ROW]
[ROW][C]50[/C][C]0.027905[/C][C]0.2542[/C][C]0.399974[/C][/ROW]
[ROW][C]51[/C][C]0.013556[/C][C]0.1235[/C][C]0.451004[/C][/ROW]
[ROW][C]52[/C][C]0.038396[/C][C]0.3498[/C][C]0.363685[/C][/ROW]
[ROW][C]53[/C][C]0.034304[/C][C]0.3125[/C][C]0.377714[/C][/ROW]
[ROW][C]54[/C][C]-0.038244[/C][C]-0.3484[/C][C]0.364203[/C][/ROW]
[ROW][C]55[/C][C]-0.140338[/C][C]-1.2785[/C][C]0.102311[/C][/ROW]
[ROW][C]56[/C][C]-0.061065[/C][C]-0.5563[/C][C]0.289741[/C][/ROW]
[ROW][C]57[/C][C]-0.012033[/C][C]-0.1096[/C][C]0.456487[/C][/ROW]
[ROW][C]58[/C][C]0.000257[/C][C]0.0023[/C][C]0.499067[/C][/ROW]
[ROW][C]59[/C][C]-0.021853[/C][C]-0.1991[/C][C]0.421339[/C][/ROW]
[ROW][C]60[/C][C]0.037654[/C][C]0.343[/C][C]0.366217[/C][/ROW]
[/TABLE]
Source: https://freestatistics.org/blog/index.php?pk=225505&T=2

Globally Unique Identifier (entire table): ba.freestatistics.org/blog/index.php?pk=225505&T=2

As an alternative you can also use a QR Code:  

The GUIDs for individual cells are displayed in the table below:

Partial Autocorrelation Function
Time lag kPACF(k)T-STATP-value
10.2855192.60120.005499
2-0.089521-0.81560.208539
30.1617961.4740.072128
4-0.068165-0.6210.268146
5-0.049097-0.44730.327913
60.0245940.22410.411631
7-0.282633-2.57490.0059
8-0.016385-0.14930.44085
9-0.166018-1.51250.067103
10-0.01212-0.11040.456172
11-0.134258-1.22320.112367
12-0.113261-1.03190.152568
13-0.045258-0.41230.340584
14-0.147368-1.34260.091534
150.1079950.98390.164016
160.1188791.0830.140964
17-0.030049-0.27380.392474
180.1374581.25230.106989
190.1173851.06940.143988
20-0.027573-0.25120.401139
21-0.119064-1.08470.140593
220.0128440.1170.453566
23-0.107987-0.98380.164034
240.0598710.54550.293452
250.0017390.01580.4937
260.0405990.36990.356208
270.1059050.96480.168715
28-0.049265-0.44880.327362
29-0.000615-0.00560.497771
30-0.095989-0.87450.192184
310.0084930.07740.469255
32-0.087281-0.79520.214393
33-0.059632-0.54330.294198
34-0.046102-0.420.337781
350.0269680.24570.403266
360.0053920.04910.480469
37-0.015893-0.14480.442614
38-0.112049-1.02080.155155
390.1719671.56670.060496
400.0039250.03580.485779
41-0.03127-0.28490.388222
42-0.036285-0.33060.370901
430.0323810.2950.384364
44-0.015106-0.13760.445435
450.0187540.17090.432375
46-0.051386-0.46820.320451
470.1073320.97780.165497
48-0.008249-0.07520.470136
49-0.010555-0.09620.461813
500.0279050.25420.399974
510.0135560.12350.451004
520.0383960.34980.363685
530.0343040.31250.377714
54-0.038244-0.34840.364203
55-0.140338-1.27850.102311
56-0.061065-0.55630.289741
57-0.012033-0.10960.456487
580.0002570.00230.499067
59-0.021853-0.19910.421339
600.0376540.3430.366217


Parameters (Session):
par1 = 60 ; par2 = 1 ; par3 = 1 ; par4 = 0 ; par5 = 12 ; par6 = White Noise ; par7 = 0.95 ;
Parameters (R input):
par1 = 60 ; par2 = 1 ; par3 = 1 ; par4 = 0 ; par5 = 12 ; par6 = White Noise ; par7 = 0.95 ; par8 = ;
R code (references can be found in the software module):
if (par1 == 'Default') {
par1 = 10*log10(length(x))
} else {
par1 <- as.numeric(par1)
}
par2 <- as.numeric(par2)
par3 <- as.numeric(par3)
par4 <- as.numeric(par4)
par5 <- as.numeric(par5)
if (par6 == 'White Noise') par6 <- 'white' else par6 <- 'ma'
par7 <- as.numeric(par7)
if (par8 != '') par8 <- as.numeric(par8)
ox <- x
if (par8 == '') {
if (par2 == 0) {
x <- log(x)
} else {
x <- (x ^ par2 - 1) / par2
}
} else {
x <- log(x,base=par8)
}
if (par3 > 0) x <- diff(x,lag=1,difference=par3)
if (par4 > 0) x <- diff(x,lag=par5,difference=par4)
bitmap(file='picts.png')
op <- par(mfrow=c(2,1))
plot(ox,type='l',main='Original Time Series',xlab='time',ylab='value')
if (par8=='') {
mytitle <- paste('Working Time Series (lambda=',par2,', d=',par3,', D=',par4,')',sep='')
mysub <- paste('(lambda=',par2,', d=',par3,', D=',par4,', CI=', par7, ', CI type=',par6,')',sep='')
} else {
mytitle <- paste('Working Time Series (base=',par8,', d=',par3,', D=',par4,')',sep='')
mysub <- paste('(base=',par8,', d=',par3,', D=',par4,', CI=', par7, ', CI type=',par6,')',sep='')
}
plot(x,type='l', main=mytitle,xlab='time',ylab='value')
par(op)
dev.off()
bitmap(file='pic1.png')
racf <- acf(x, par1, main='Autocorrelation', xlab='time lag', ylab='ACF', ci.type=par6, ci=par7, sub=mysub)
dev.off()
bitmap(file='pic2.png')
rpacf <- pacf(x,par1,main='Partial Autocorrelation',xlab='lags',ylab='PACF',sub=mysub)
dev.off()
(myacf <- c(racf$acf))
(mypacf <- c(rpacf$acf))
lengthx <- length(x)
sqrtn <- sqrt(lengthx)
load(file='createtable')
a<-table.start()
a<-table.row.start(a)
a<-table.element(a,'Autocorrelation Function',4,TRUE)
a<-table.row.end(a)
a<-table.row.start(a)
a<-table.element(a,'Time lag k',header=TRUE)
a<-table.element(a,hyperlink('basics.htm','ACF(k)','click here for more information about the Autocorrelation Function'),header=TRUE)
a<-table.element(a,'T-STAT',header=TRUE)
a<-table.element(a,'P-value',header=TRUE)
a<-table.row.end(a)
for (i in 2:(par1+1)) {
a<-table.row.start(a)
a<-table.element(a,i-1,header=TRUE)
a<-table.element(a,round(myacf[i],6))
mytstat <- myacf[i]*sqrtn
a<-table.element(a,round(mytstat,4))
a<-table.element(a,round(1-pt(abs(mytstat),lengthx),6))
a<-table.row.end(a)
}
a<-table.end(a)
table.save(a,file='mytable.tab')
a<-table.start()
a<-table.row.start(a)
a<-table.element(a,'Partial Autocorrelation Function',4,TRUE)
a<-table.row.end(a)
a<-table.row.start(a)
a<-table.element(a,'Time lag k',header=TRUE)
a<-table.element(a,hyperlink('basics.htm','PACF(k)','click here for more information about the Partial Autocorrelation Function'),header=TRUE)
a<-table.element(a,'T-STAT',header=TRUE)
a<-table.element(a,'P-value',header=TRUE)
a<-table.row.end(a)
for (i in 1:par1) {
a<-table.row.start(a)
a<-table.element(a,i,header=TRUE)
a<-table.element(a,round(mypacf[i],6))
mytstat <- mypacf[i]*sqrtn
a<-table.element(a,round(mytstat,4))
a<-table.element(a,round(1-pt(abs(mytstat),lengthx),6))
a<-table.row.end(a)
}
a<-table.end(a)
table.save(a,file='mytable1.tab')