Free Statistics

of Irreproducible Research!

Author's title

Author*Unverified author*
R Software Modulerwasp_autocorrelation.wasp
Title produced by software(Partial) Autocorrelation Function
Date of computationFri, 15 Nov 2013 09:56:15 -0500
Cite this page as followsStatistical Computations at FreeStatistics.org, Office for Research Development and Education, URL https://freestatistics.org/blog/index.php?v=date/2013/Nov/15/t13845274368smx5g2w366p52n.htm/, Retrieved Tue, 30 Apr 2024 13:35:16 +0000
Statistical Computations at FreeStatistics.org, Office for Research Development and Education, URL https://freestatistics.org/blog/index.php?pk=225500, Retrieved Tue, 30 Apr 2024 13:35:16 +0000
QR Codes:

Original text written by user:
IsPrivate?No (this computation is public)
User-defined keywords
Estimated Impact53
Family? (F = Feedback message, R = changed R code, M = changed R Module, P = changed Parameters, D = changed Data)
-       [(Partial) Autocorrelation Function] [] [2013-11-15 14:56:15] [a51ebb1a550b3d5f2cc4b9cf02171f8b] [Current]
Feedback Forum

Post a new message
Dataseries X:
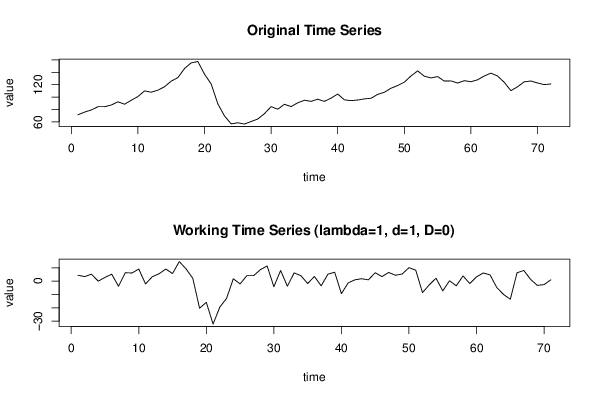
71.4
75.8
79.2
84.4
84.4
87.2
92.4
88.5
94.8
100.9
110
107.9
111.2
116.7
125.8
131.5
146.2
155.4
157.5
137.2
121.3
89.1
69.6
56.7
58.5
56.4
60.5
64.6
73.2
84.6
80.4
88.4
84.6
90.8
94.9
93.1
96.6
93.1
98.3
105
95.6
94.3
95.3
97.1
98.1
104.4
107.8
114.3
118.7
124.1
134.2
142.4
133.8
131
133.2
125.9
126.2
122.7
126.6
124.8
128
134.1
138.8
134
124
110.4
116.7
124.7
126
122.8
120.2
121.2


Summary of computational transaction
Raw Inputview raw input (R code)
Raw Outputview raw output of R engine
Computing time3 seconds
R Server'George Udny Yule' @ yule.wessa.net

\begin{tabular}{lllllllll}
\hline
Summary of computational transaction \tabularnewline
Raw Input & view raw input (R code)  \tabularnewline
Raw Output & view raw output of R engine  \tabularnewline
Computing time & 3 seconds \tabularnewline
R Server & 'George Udny Yule' @ yule.wessa.net \tabularnewline
\hline
\end{tabular}
%Source: https://freestatistics.org/blog/index.php?pk=225500&T=0

[TABLE]
[ROW][C]Summary of computational transaction[/C][/ROW]
[ROW][C]Raw Input[/C][C]view raw input (R code) [/C][/ROW]
[ROW][C]Raw Output[/C][C]view raw output of R engine [/C][/ROW]
[ROW][C]Computing time[/C][C]3 seconds[/C][/ROW]
[ROW][C]R Server[/C][C]'George Udny Yule' @ yule.wessa.net[/C][/ROW]
[/TABLE]
Source: https://freestatistics.org/blog/index.php?pk=225500&T=0

Globally Unique Identifier (entire table): ba.freestatistics.org/blog/index.php?pk=225500&T=0

As an alternative you can also use a QR Code:  

The GUIDs for individual cells are displayed in the table below:

Summary of computational transaction
Raw Inputview raw input (R code)
Raw Outputview raw output of R engine
Computing time3 seconds
R Server'George Udny Yule' @ yule.wessa.net


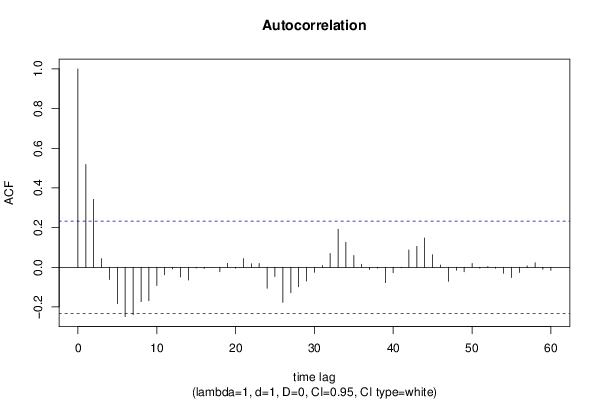
Autocorrelation Function
Time lag kACF(k)T-STATP-value
10.5181464.3662.1e-05
20.342282.88410.002596
30.0436230.36760.357143
4-0.061831-0.5210.301996
5-0.183698-1.54790.06305
6-0.24907-2.09870.019701
7-0.239871-2.02120.023516
8-0.173288-1.46020.07433
9-0.168544-1.42020.079966
10-0.092415-0.77870.219372
11-0.037964-0.31990.374994
12-0.008062-0.06790.473016
13-0.049425-0.41650.339165
14-0.064221-0.54110.295053
15-0.003641-0.03070.487806
16-0.005565-0.04690.481365
178e-061e-040.499972
18-0.022324-0.18810.425667
190.0195960.16510.434659
20-0.005146-0.04340.482767
210.0435670.36710.357316
220.0180110.15180.439901
230.0188160.15850.437239
24-0.105928-0.89260.187552
25-0.046395-0.39090.348508
26-0.17698-1.49130.070162
27-0.128182-1.08010.14188
28-0.098611-0.83090.204406
29-0.069429-0.5850.280194
30-0.024911-0.20990.417171
310.0090390.07620.469753
320.0693930.58470.280296
330.1921011.61870.054976
340.1261181.06270.145762
350.0593560.50010.30926
360.0152210.12830.449155
37-0.011353-0.09570.462028
38-0.00423-0.03560.485835
39-0.077583-0.65370.257701
40-0.027627-0.23280.408297
41-0.002891-0.02440.490317
420.0866550.73020.233844
430.1053340.88760.188887
440.147181.24020.1095
450.0627590.52880.29929
460.0114740.09670.461625
47-0.071111-0.59920.275477
48-0.015284-0.12880.448946
49-0.022948-0.19340.423615
500.0193770.16330.435384
51-0.005293-0.04460.482277
520.0035370.02980.488154
53-0.005224-0.0440.482506
54-0.030161-0.25410.400059
55-0.051567-0.43450.332617
56-0.026368-0.22220.412404
570.0070160.05910.476513
580.0231440.1950.422968
59-0.010073-0.08490.466298
60-0.01574-0.13260.447432

\begin{tabular}{lllllllll}
\hline
Autocorrelation Function \tabularnewline
Time lag k & ACF(k) & T-STAT & P-value \tabularnewline
1 & 0.518146 & 4.366 & 2.1e-05 \tabularnewline
2 & 0.34228 & 2.8841 & 0.002596 \tabularnewline
3 & 0.043623 & 0.3676 & 0.357143 \tabularnewline
4 & -0.061831 & -0.521 & 0.301996 \tabularnewline
5 & -0.183698 & -1.5479 & 0.06305 \tabularnewline
6 & -0.24907 & -2.0987 & 0.019701 \tabularnewline
7 & -0.239871 & -2.0212 & 0.023516 \tabularnewline
8 & -0.173288 & -1.4602 & 0.07433 \tabularnewline
9 & -0.168544 & -1.4202 & 0.079966 \tabularnewline
10 & -0.092415 & -0.7787 & 0.219372 \tabularnewline
11 & -0.037964 & -0.3199 & 0.374994 \tabularnewline
12 & -0.008062 & -0.0679 & 0.473016 \tabularnewline
13 & -0.049425 & -0.4165 & 0.339165 \tabularnewline
14 & -0.064221 & -0.5411 & 0.295053 \tabularnewline
15 & -0.003641 & -0.0307 & 0.487806 \tabularnewline
16 & -0.005565 & -0.0469 & 0.481365 \tabularnewline
17 & 8e-06 & 1e-04 & 0.499972 \tabularnewline
18 & -0.022324 & -0.1881 & 0.425667 \tabularnewline
19 & 0.019596 & 0.1651 & 0.434659 \tabularnewline
20 & -0.005146 & -0.0434 & 0.482767 \tabularnewline
21 & 0.043567 & 0.3671 & 0.357316 \tabularnewline
22 & 0.018011 & 0.1518 & 0.439901 \tabularnewline
23 & 0.018816 & 0.1585 & 0.437239 \tabularnewline
24 & -0.105928 & -0.8926 & 0.187552 \tabularnewline
25 & -0.046395 & -0.3909 & 0.348508 \tabularnewline
26 & -0.17698 & -1.4913 & 0.070162 \tabularnewline
27 & -0.128182 & -1.0801 & 0.14188 \tabularnewline
28 & -0.098611 & -0.8309 & 0.204406 \tabularnewline
29 & -0.069429 & -0.585 & 0.280194 \tabularnewline
30 & -0.024911 & -0.2099 & 0.417171 \tabularnewline
31 & 0.009039 & 0.0762 & 0.469753 \tabularnewline
32 & 0.069393 & 0.5847 & 0.280296 \tabularnewline
33 & 0.192101 & 1.6187 & 0.054976 \tabularnewline
34 & 0.126118 & 1.0627 & 0.145762 \tabularnewline
35 & 0.059356 & 0.5001 & 0.30926 \tabularnewline
36 & 0.015221 & 0.1283 & 0.449155 \tabularnewline
37 & -0.011353 & -0.0957 & 0.462028 \tabularnewline
38 & -0.00423 & -0.0356 & 0.485835 \tabularnewline
39 & -0.077583 & -0.6537 & 0.257701 \tabularnewline
40 & -0.027627 & -0.2328 & 0.408297 \tabularnewline
41 & -0.002891 & -0.0244 & 0.490317 \tabularnewline
42 & 0.086655 & 0.7302 & 0.233844 \tabularnewline
43 & 0.105334 & 0.8876 & 0.188887 \tabularnewline
44 & 0.14718 & 1.2402 & 0.1095 \tabularnewline
45 & 0.062759 & 0.5288 & 0.29929 \tabularnewline
46 & 0.011474 & 0.0967 & 0.461625 \tabularnewline
47 & -0.071111 & -0.5992 & 0.275477 \tabularnewline
48 & -0.015284 & -0.1288 & 0.448946 \tabularnewline
49 & -0.022948 & -0.1934 & 0.423615 \tabularnewline
50 & 0.019377 & 0.1633 & 0.435384 \tabularnewline
51 & -0.005293 & -0.0446 & 0.482277 \tabularnewline
52 & 0.003537 & 0.0298 & 0.488154 \tabularnewline
53 & -0.005224 & -0.044 & 0.482506 \tabularnewline
54 & -0.030161 & -0.2541 & 0.400059 \tabularnewline
55 & -0.051567 & -0.4345 & 0.332617 \tabularnewline
56 & -0.026368 & -0.2222 & 0.412404 \tabularnewline
57 & 0.007016 & 0.0591 & 0.476513 \tabularnewline
58 & 0.023144 & 0.195 & 0.422968 \tabularnewline
59 & -0.010073 & -0.0849 & 0.466298 \tabularnewline
60 & -0.01574 & -0.1326 & 0.447432 \tabularnewline
\hline
\end{tabular}
%Source: https://freestatistics.org/blog/index.php?pk=225500&T=1

[TABLE]
[ROW][C]Autocorrelation Function[/C][/ROW]
[ROW][C]Time lag k[/C][C]ACF(k)[/C][C]T-STAT[/C][C]P-value[/C][/ROW]
[ROW][C]1[/C][C]0.518146[/C][C]4.366[/C][C]2.1e-05[/C][/ROW]
[ROW][C]2[/C][C]0.34228[/C][C]2.8841[/C][C]0.002596[/C][/ROW]
[ROW][C]3[/C][C]0.043623[/C][C]0.3676[/C][C]0.357143[/C][/ROW]
[ROW][C]4[/C][C]-0.061831[/C][C]-0.521[/C][C]0.301996[/C][/ROW]
[ROW][C]5[/C][C]-0.183698[/C][C]-1.5479[/C][C]0.06305[/C][/ROW]
[ROW][C]6[/C][C]-0.24907[/C][C]-2.0987[/C][C]0.019701[/C][/ROW]
[ROW][C]7[/C][C]-0.239871[/C][C]-2.0212[/C][C]0.023516[/C][/ROW]
[ROW][C]8[/C][C]-0.173288[/C][C]-1.4602[/C][C]0.07433[/C][/ROW]
[ROW][C]9[/C][C]-0.168544[/C][C]-1.4202[/C][C]0.079966[/C][/ROW]
[ROW][C]10[/C][C]-0.092415[/C][C]-0.7787[/C][C]0.219372[/C][/ROW]
[ROW][C]11[/C][C]-0.037964[/C][C]-0.3199[/C][C]0.374994[/C][/ROW]
[ROW][C]12[/C][C]-0.008062[/C][C]-0.0679[/C][C]0.473016[/C][/ROW]
[ROW][C]13[/C][C]-0.049425[/C][C]-0.4165[/C][C]0.339165[/C][/ROW]
[ROW][C]14[/C][C]-0.064221[/C][C]-0.5411[/C][C]0.295053[/C][/ROW]
[ROW][C]15[/C][C]-0.003641[/C][C]-0.0307[/C][C]0.487806[/C][/ROW]
[ROW][C]16[/C][C]-0.005565[/C][C]-0.0469[/C][C]0.481365[/C][/ROW]
[ROW][C]17[/C][C]8e-06[/C][C]1e-04[/C][C]0.499972[/C][/ROW]
[ROW][C]18[/C][C]-0.022324[/C][C]-0.1881[/C][C]0.425667[/C][/ROW]
[ROW][C]19[/C][C]0.019596[/C][C]0.1651[/C][C]0.434659[/C][/ROW]
[ROW][C]20[/C][C]-0.005146[/C][C]-0.0434[/C][C]0.482767[/C][/ROW]
[ROW][C]21[/C][C]0.043567[/C][C]0.3671[/C][C]0.357316[/C][/ROW]
[ROW][C]22[/C][C]0.018011[/C][C]0.1518[/C][C]0.439901[/C][/ROW]
[ROW][C]23[/C][C]0.018816[/C][C]0.1585[/C][C]0.437239[/C][/ROW]
[ROW][C]24[/C][C]-0.105928[/C][C]-0.8926[/C][C]0.187552[/C][/ROW]
[ROW][C]25[/C][C]-0.046395[/C][C]-0.3909[/C][C]0.348508[/C][/ROW]
[ROW][C]26[/C][C]-0.17698[/C][C]-1.4913[/C][C]0.070162[/C][/ROW]
[ROW][C]27[/C][C]-0.128182[/C][C]-1.0801[/C][C]0.14188[/C][/ROW]
[ROW][C]28[/C][C]-0.098611[/C][C]-0.8309[/C][C]0.204406[/C][/ROW]
[ROW][C]29[/C][C]-0.069429[/C][C]-0.585[/C][C]0.280194[/C][/ROW]
[ROW][C]30[/C][C]-0.024911[/C][C]-0.2099[/C][C]0.417171[/C][/ROW]
[ROW][C]31[/C][C]0.009039[/C][C]0.0762[/C][C]0.469753[/C][/ROW]
[ROW][C]32[/C][C]0.069393[/C][C]0.5847[/C][C]0.280296[/C][/ROW]
[ROW][C]33[/C][C]0.192101[/C][C]1.6187[/C][C]0.054976[/C][/ROW]
[ROW][C]34[/C][C]0.126118[/C][C]1.0627[/C][C]0.145762[/C][/ROW]
[ROW][C]35[/C][C]0.059356[/C][C]0.5001[/C][C]0.30926[/C][/ROW]
[ROW][C]36[/C][C]0.015221[/C][C]0.1283[/C][C]0.449155[/C][/ROW]
[ROW][C]37[/C][C]-0.011353[/C][C]-0.0957[/C][C]0.462028[/C][/ROW]
[ROW][C]38[/C][C]-0.00423[/C][C]-0.0356[/C][C]0.485835[/C][/ROW]
[ROW][C]39[/C][C]-0.077583[/C][C]-0.6537[/C][C]0.257701[/C][/ROW]
[ROW][C]40[/C][C]-0.027627[/C][C]-0.2328[/C][C]0.408297[/C][/ROW]
[ROW][C]41[/C][C]-0.002891[/C][C]-0.0244[/C][C]0.490317[/C][/ROW]
[ROW][C]42[/C][C]0.086655[/C][C]0.7302[/C][C]0.233844[/C][/ROW]
[ROW][C]43[/C][C]0.105334[/C][C]0.8876[/C][C]0.188887[/C][/ROW]
[ROW][C]44[/C][C]0.14718[/C][C]1.2402[/C][C]0.1095[/C][/ROW]
[ROW][C]45[/C][C]0.062759[/C][C]0.5288[/C][C]0.29929[/C][/ROW]
[ROW][C]46[/C][C]0.011474[/C][C]0.0967[/C][C]0.461625[/C][/ROW]
[ROW][C]47[/C][C]-0.071111[/C][C]-0.5992[/C][C]0.275477[/C][/ROW]
[ROW][C]48[/C][C]-0.015284[/C][C]-0.1288[/C][C]0.448946[/C][/ROW]
[ROW][C]49[/C][C]-0.022948[/C][C]-0.1934[/C][C]0.423615[/C][/ROW]
[ROW][C]50[/C][C]0.019377[/C][C]0.1633[/C][C]0.435384[/C][/ROW]
[ROW][C]51[/C][C]-0.005293[/C][C]-0.0446[/C][C]0.482277[/C][/ROW]
[ROW][C]52[/C][C]0.003537[/C][C]0.0298[/C][C]0.488154[/C][/ROW]
[ROW][C]53[/C][C]-0.005224[/C][C]-0.044[/C][C]0.482506[/C][/ROW]
[ROW][C]54[/C][C]-0.030161[/C][C]-0.2541[/C][C]0.400059[/C][/ROW]
[ROW][C]55[/C][C]-0.051567[/C][C]-0.4345[/C][C]0.332617[/C][/ROW]
[ROW][C]56[/C][C]-0.026368[/C][C]-0.2222[/C][C]0.412404[/C][/ROW]
[ROW][C]57[/C][C]0.007016[/C][C]0.0591[/C][C]0.476513[/C][/ROW]
[ROW][C]58[/C][C]0.023144[/C][C]0.195[/C][C]0.422968[/C][/ROW]
[ROW][C]59[/C][C]-0.010073[/C][C]-0.0849[/C][C]0.466298[/C][/ROW]
[ROW][C]60[/C][C]-0.01574[/C][C]-0.1326[/C][C]0.447432[/C][/ROW]
[/TABLE]
Source: https://freestatistics.org/blog/index.php?pk=225500&T=1

Globally Unique Identifier (entire table): ba.freestatistics.org/blog/index.php?pk=225500&T=1

As an alternative you can also use a QR Code:  

The GUIDs for individual cells are displayed in the table below:

Autocorrelation Function
Time lag kACF(k)T-STATP-value
10.5181464.3662.1e-05
20.342282.88410.002596
30.0436230.36760.357143
4-0.061831-0.5210.301996
5-0.183698-1.54790.06305
6-0.24907-2.09870.019701
7-0.239871-2.02120.023516
8-0.173288-1.46020.07433
9-0.168544-1.42020.079966
10-0.092415-0.77870.219372
11-0.037964-0.31990.374994
12-0.008062-0.06790.473016
13-0.049425-0.41650.339165
14-0.064221-0.54110.295053
15-0.003641-0.03070.487806
16-0.005565-0.04690.481365
178e-061e-040.499972
18-0.022324-0.18810.425667
190.0195960.16510.434659
20-0.005146-0.04340.482767
210.0435670.36710.357316
220.0180110.15180.439901
230.0188160.15850.437239
24-0.105928-0.89260.187552
25-0.046395-0.39090.348508
26-0.17698-1.49130.070162
27-0.128182-1.08010.14188
28-0.098611-0.83090.204406
29-0.069429-0.5850.280194
30-0.024911-0.20990.417171
310.0090390.07620.469753
320.0693930.58470.280296
330.1921011.61870.054976
340.1261181.06270.145762
350.0593560.50010.30926
360.0152210.12830.449155
37-0.011353-0.09570.462028
38-0.00423-0.03560.485835
39-0.077583-0.65370.257701
40-0.027627-0.23280.408297
41-0.002891-0.02440.490317
420.0866550.73020.233844
430.1053340.88760.188887
440.147181.24020.1095
450.0627590.52880.29929
460.0114740.09670.461625
47-0.071111-0.59920.275477
48-0.015284-0.12880.448946
49-0.022948-0.19340.423615
500.0193770.16330.435384
51-0.005293-0.04460.482277
520.0035370.02980.488154
53-0.005224-0.0440.482506
54-0.030161-0.25410.400059
55-0.051567-0.43450.332617
56-0.026368-0.22220.412404
570.0070160.05910.476513
580.0231440.1950.422968
59-0.010073-0.08490.466298
60-0.01574-0.13260.447432


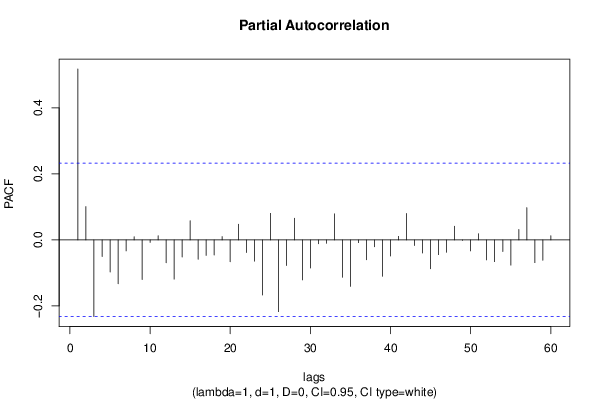
Partial Autocorrelation Function
Time lag kPACF(k)T-STATP-value
10.5181464.3662.1e-05
20.1008910.85010.199058
3-0.232173-1.95630.027181
4-0.05026-0.42350.336607
5-0.097541-0.82190.206944
6-0.13296-1.12030.133171
7-0.033252-0.28020.390073
80.0094420.07960.468407
9-0.120083-1.01180.157525
10-0.007594-0.0640.474579
110.0125960.10610.457888
12-0.069242-0.58340.280723
13-0.11881-1.00110.160086
14-0.051766-0.43620.332011
150.0582890.49120.312417
16-0.058567-0.49350.311594
17-0.046924-0.39540.346871
18-0.045837-0.38620.35024
190.0100820.0850.466268
20-0.06598-0.5560.289993
210.0476910.40190.3445
22-0.03807-0.32080.37466
23-0.064348-0.54220.294687
24-0.167134-1.40830.081703
250.0803890.67740.250186
26-0.217493-1.83260.035525
27-0.077714-0.65480.257347
280.0658380.55480.290402
29-0.121127-1.02060.155447
30-0.085222-0.71810.237528
31-0.011498-0.09690.461544
32-0.009994-0.08420.466562
330.0788360.66430.254331
34-0.113378-0.95530.171323
35-0.140858-1.18690.119614
36-0.008238-0.06940.472426
37-0.05993-0.5050.307569
38-0.020675-0.17420.431099
39-0.110431-0.93050.17763
40-0.048597-0.40950.341708
410.0108330.09130.463762
420.0799140.67340.251451
43-0.016952-0.14280.443411
44-0.039469-0.33260.370217
45-0.087557-0.73780.231544
46-0.044715-0.37680.353731
47-0.037258-0.31390.377243
480.0414560.34930.363944
49-0.001421-0.0120.495241
50-0.033245-0.28010.390097
510.0185860.15660.437998
52-0.060537-0.51010.305783
53-0.065935-0.55560.290122
54-0.035452-0.29870.383013
55-0.076481-0.64440.260685
560.0316860.2670.395125
570.0977580.82370.206427
58-0.068891-0.58050.281711
59-0.06173-0.52010.302289
600.0124050.10450.458523

\begin{tabular}{lllllllll}
\hline
Partial Autocorrelation Function \tabularnewline
Time lag k & PACF(k) & T-STAT & P-value \tabularnewline
1 & 0.518146 & 4.366 & 2.1e-05 \tabularnewline
2 & 0.100891 & 0.8501 & 0.199058 \tabularnewline
3 & -0.232173 & -1.9563 & 0.027181 \tabularnewline
4 & -0.05026 & -0.4235 & 0.336607 \tabularnewline
5 & -0.097541 & -0.8219 & 0.206944 \tabularnewline
6 & -0.13296 & -1.1203 & 0.133171 \tabularnewline
7 & -0.033252 & -0.2802 & 0.390073 \tabularnewline
8 & 0.009442 & 0.0796 & 0.468407 \tabularnewline
9 & -0.120083 & -1.0118 & 0.157525 \tabularnewline
10 & -0.007594 & -0.064 & 0.474579 \tabularnewline
11 & 0.012596 & 0.1061 & 0.457888 \tabularnewline
12 & -0.069242 & -0.5834 & 0.280723 \tabularnewline
13 & -0.11881 & -1.0011 & 0.160086 \tabularnewline
14 & -0.051766 & -0.4362 & 0.332011 \tabularnewline
15 & 0.058289 & 0.4912 & 0.312417 \tabularnewline
16 & -0.058567 & -0.4935 & 0.311594 \tabularnewline
17 & -0.046924 & -0.3954 & 0.346871 \tabularnewline
18 & -0.045837 & -0.3862 & 0.35024 \tabularnewline
19 & 0.010082 & 0.085 & 0.466268 \tabularnewline
20 & -0.06598 & -0.556 & 0.289993 \tabularnewline
21 & 0.047691 & 0.4019 & 0.3445 \tabularnewline
22 & -0.03807 & -0.3208 & 0.37466 \tabularnewline
23 & -0.064348 & -0.5422 & 0.294687 \tabularnewline
24 & -0.167134 & -1.4083 & 0.081703 \tabularnewline
25 & 0.080389 & 0.6774 & 0.250186 \tabularnewline
26 & -0.217493 & -1.8326 & 0.035525 \tabularnewline
27 & -0.077714 & -0.6548 & 0.257347 \tabularnewline
28 & 0.065838 & 0.5548 & 0.290402 \tabularnewline
29 & -0.121127 & -1.0206 & 0.155447 \tabularnewline
30 & -0.085222 & -0.7181 & 0.237528 \tabularnewline
31 & -0.011498 & -0.0969 & 0.461544 \tabularnewline
32 & -0.009994 & -0.0842 & 0.466562 \tabularnewline
33 & 0.078836 & 0.6643 & 0.254331 \tabularnewline
34 & -0.113378 & -0.9553 & 0.171323 \tabularnewline
35 & -0.140858 & -1.1869 & 0.119614 \tabularnewline
36 & -0.008238 & -0.0694 & 0.472426 \tabularnewline
37 & -0.05993 & -0.505 & 0.307569 \tabularnewline
38 & -0.020675 & -0.1742 & 0.431099 \tabularnewline
39 & -0.110431 & -0.9305 & 0.17763 \tabularnewline
40 & -0.048597 & -0.4095 & 0.341708 \tabularnewline
41 & 0.010833 & 0.0913 & 0.463762 \tabularnewline
42 & 0.079914 & 0.6734 & 0.251451 \tabularnewline
43 & -0.016952 & -0.1428 & 0.443411 \tabularnewline
44 & -0.039469 & -0.3326 & 0.370217 \tabularnewline
45 & -0.087557 & -0.7378 & 0.231544 \tabularnewline
46 & -0.044715 & -0.3768 & 0.353731 \tabularnewline
47 & -0.037258 & -0.3139 & 0.377243 \tabularnewline
48 & 0.041456 & 0.3493 & 0.363944 \tabularnewline
49 & -0.001421 & -0.012 & 0.495241 \tabularnewline
50 & -0.033245 & -0.2801 & 0.390097 \tabularnewline
51 & 0.018586 & 0.1566 & 0.437998 \tabularnewline
52 & -0.060537 & -0.5101 & 0.305783 \tabularnewline
53 & -0.065935 & -0.5556 & 0.290122 \tabularnewline
54 & -0.035452 & -0.2987 & 0.383013 \tabularnewline
55 & -0.076481 & -0.6444 & 0.260685 \tabularnewline
56 & 0.031686 & 0.267 & 0.395125 \tabularnewline
57 & 0.097758 & 0.8237 & 0.206427 \tabularnewline
58 & -0.068891 & -0.5805 & 0.281711 \tabularnewline
59 & -0.06173 & -0.5201 & 0.302289 \tabularnewline
60 & 0.012405 & 0.1045 & 0.458523 \tabularnewline
\hline
\end{tabular}
%Source: https://freestatistics.org/blog/index.php?pk=225500&T=2

[TABLE]
[ROW][C]Partial Autocorrelation Function[/C][/ROW]
[ROW][C]Time lag k[/C][C]PACF(k)[/C][C]T-STAT[/C][C]P-value[/C][/ROW]
[ROW][C]1[/C][C]0.518146[/C][C]4.366[/C][C]2.1e-05[/C][/ROW]
[ROW][C]2[/C][C]0.100891[/C][C]0.8501[/C][C]0.199058[/C][/ROW]
[ROW][C]3[/C][C]-0.232173[/C][C]-1.9563[/C][C]0.027181[/C][/ROW]
[ROW][C]4[/C][C]-0.05026[/C][C]-0.4235[/C][C]0.336607[/C][/ROW]
[ROW][C]5[/C][C]-0.097541[/C][C]-0.8219[/C][C]0.206944[/C][/ROW]
[ROW][C]6[/C][C]-0.13296[/C][C]-1.1203[/C][C]0.133171[/C][/ROW]
[ROW][C]7[/C][C]-0.033252[/C][C]-0.2802[/C][C]0.390073[/C][/ROW]
[ROW][C]8[/C][C]0.009442[/C][C]0.0796[/C][C]0.468407[/C][/ROW]
[ROW][C]9[/C][C]-0.120083[/C][C]-1.0118[/C][C]0.157525[/C][/ROW]
[ROW][C]10[/C][C]-0.007594[/C][C]-0.064[/C][C]0.474579[/C][/ROW]
[ROW][C]11[/C][C]0.012596[/C][C]0.1061[/C][C]0.457888[/C][/ROW]
[ROW][C]12[/C][C]-0.069242[/C][C]-0.5834[/C][C]0.280723[/C][/ROW]
[ROW][C]13[/C][C]-0.11881[/C][C]-1.0011[/C][C]0.160086[/C][/ROW]
[ROW][C]14[/C][C]-0.051766[/C][C]-0.4362[/C][C]0.332011[/C][/ROW]
[ROW][C]15[/C][C]0.058289[/C][C]0.4912[/C][C]0.312417[/C][/ROW]
[ROW][C]16[/C][C]-0.058567[/C][C]-0.4935[/C][C]0.311594[/C][/ROW]
[ROW][C]17[/C][C]-0.046924[/C][C]-0.3954[/C][C]0.346871[/C][/ROW]
[ROW][C]18[/C][C]-0.045837[/C][C]-0.3862[/C][C]0.35024[/C][/ROW]
[ROW][C]19[/C][C]0.010082[/C][C]0.085[/C][C]0.466268[/C][/ROW]
[ROW][C]20[/C][C]-0.06598[/C][C]-0.556[/C][C]0.289993[/C][/ROW]
[ROW][C]21[/C][C]0.047691[/C][C]0.4019[/C][C]0.3445[/C][/ROW]
[ROW][C]22[/C][C]-0.03807[/C][C]-0.3208[/C][C]0.37466[/C][/ROW]
[ROW][C]23[/C][C]-0.064348[/C][C]-0.5422[/C][C]0.294687[/C][/ROW]
[ROW][C]24[/C][C]-0.167134[/C][C]-1.4083[/C][C]0.081703[/C][/ROW]
[ROW][C]25[/C][C]0.080389[/C][C]0.6774[/C][C]0.250186[/C][/ROW]
[ROW][C]26[/C][C]-0.217493[/C][C]-1.8326[/C][C]0.035525[/C][/ROW]
[ROW][C]27[/C][C]-0.077714[/C][C]-0.6548[/C][C]0.257347[/C][/ROW]
[ROW][C]28[/C][C]0.065838[/C][C]0.5548[/C][C]0.290402[/C][/ROW]
[ROW][C]29[/C][C]-0.121127[/C][C]-1.0206[/C][C]0.155447[/C][/ROW]
[ROW][C]30[/C][C]-0.085222[/C][C]-0.7181[/C][C]0.237528[/C][/ROW]
[ROW][C]31[/C][C]-0.011498[/C][C]-0.0969[/C][C]0.461544[/C][/ROW]
[ROW][C]32[/C][C]-0.009994[/C][C]-0.0842[/C][C]0.466562[/C][/ROW]
[ROW][C]33[/C][C]0.078836[/C][C]0.6643[/C][C]0.254331[/C][/ROW]
[ROW][C]34[/C][C]-0.113378[/C][C]-0.9553[/C][C]0.171323[/C][/ROW]
[ROW][C]35[/C][C]-0.140858[/C][C]-1.1869[/C][C]0.119614[/C][/ROW]
[ROW][C]36[/C][C]-0.008238[/C][C]-0.0694[/C][C]0.472426[/C][/ROW]
[ROW][C]37[/C][C]-0.05993[/C][C]-0.505[/C][C]0.307569[/C][/ROW]
[ROW][C]38[/C][C]-0.020675[/C][C]-0.1742[/C][C]0.431099[/C][/ROW]
[ROW][C]39[/C][C]-0.110431[/C][C]-0.9305[/C][C]0.17763[/C][/ROW]
[ROW][C]40[/C][C]-0.048597[/C][C]-0.4095[/C][C]0.341708[/C][/ROW]
[ROW][C]41[/C][C]0.010833[/C][C]0.0913[/C][C]0.463762[/C][/ROW]
[ROW][C]42[/C][C]0.079914[/C][C]0.6734[/C][C]0.251451[/C][/ROW]
[ROW][C]43[/C][C]-0.016952[/C][C]-0.1428[/C][C]0.443411[/C][/ROW]
[ROW][C]44[/C][C]-0.039469[/C][C]-0.3326[/C][C]0.370217[/C][/ROW]
[ROW][C]45[/C][C]-0.087557[/C][C]-0.7378[/C][C]0.231544[/C][/ROW]
[ROW][C]46[/C][C]-0.044715[/C][C]-0.3768[/C][C]0.353731[/C][/ROW]
[ROW][C]47[/C][C]-0.037258[/C][C]-0.3139[/C][C]0.377243[/C][/ROW]
[ROW][C]48[/C][C]0.041456[/C][C]0.3493[/C][C]0.363944[/C][/ROW]
[ROW][C]49[/C][C]-0.001421[/C][C]-0.012[/C][C]0.495241[/C][/ROW]
[ROW][C]50[/C][C]-0.033245[/C][C]-0.2801[/C][C]0.390097[/C][/ROW]
[ROW][C]51[/C][C]0.018586[/C][C]0.1566[/C][C]0.437998[/C][/ROW]
[ROW][C]52[/C][C]-0.060537[/C][C]-0.5101[/C][C]0.305783[/C][/ROW]
[ROW][C]53[/C][C]-0.065935[/C][C]-0.5556[/C][C]0.290122[/C][/ROW]
[ROW][C]54[/C][C]-0.035452[/C][C]-0.2987[/C][C]0.383013[/C][/ROW]
[ROW][C]55[/C][C]-0.076481[/C][C]-0.6444[/C][C]0.260685[/C][/ROW]
[ROW][C]56[/C][C]0.031686[/C][C]0.267[/C][C]0.395125[/C][/ROW]
[ROW][C]57[/C][C]0.097758[/C][C]0.8237[/C][C]0.206427[/C][/ROW]
[ROW][C]58[/C][C]-0.068891[/C][C]-0.5805[/C][C]0.281711[/C][/ROW]
[ROW][C]59[/C][C]-0.06173[/C][C]-0.5201[/C][C]0.302289[/C][/ROW]
[ROW][C]60[/C][C]0.012405[/C][C]0.1045[/C][C]0.458523[/C][/ROW]
[/TABLE]
Source: https://freestatistics.org/blog/index.php?pk=225500&T=2

Globally Unique Identifier (entire table): ba.freestatistics.org/blog/index.php?pk=225500&T=2

As an alternative you can also use a QR Code:  

The GUIDs for individual cells are displayed in the table below:

Partial Autocorrelation Function
Time lag kPACF(k)T-STATP-value
10.5181464.3662.1e-05
20.1008910.85010.199058
3-0.232173-1.95630.027181
4-0.05026-0.42350.336607
5-0.097541-0.82190.206944
6-0.13296-1.12030.133171
7-0.033252-0.28020.390073
80.0094420.07960.468407
9-0.120083-1.01180.157525
10-0.007594-0.0640.474579
110.0125960.10610.457888
12-0.069242-0.58340.280723
13-0.11881-1.00110.160086
14-0.051766-0.43620.332011
150.0582890.49120.312417
16-0.058567-0.49350.311594
17-0.046924-0.39540.346871
18-0.045837-0.38620.35024
190.0100820.0850.466268
20-0.06598-0.5560.289993
210.0476910.40190.3445
22-0.03807-0.32080.37466
23-0.064348-0.54220.294687
24-0.167134-1.40830.081703
250.0803890.67740.250186
26-0.217493-1.83260.035525
27-0.077714-0.65480.257347
280.0658380.55480.290402
29-0.121127-1.02060.155447
30-0.085222-0.71810.237528
31-0.011498-0.09690.461544
32-0.009994-0.08420.466562
330.0788360.66430.254331
34-0.113378-0.95530.171323
35-0.140858-1.18690.119614
36-0.008238-0.06940.472426
37-0.05993-0.5050.307569
38-0.020675-0.17420.431099
39-0.110431-0.93050.17763
40-0.048597-0.40950.341708
410.0108330.09130.463762
420.0799140.67340.251451
43-0.016952-0.14280.443411
44-0.039469-0.33260.370217
45-0.087557-0.73780.231544
46-0.044715-0.37680.353731
47-0.037258-0.31390.377243
480.0414560.34930.363944
49-0.001421-0.0120.495241
50-0.033245-0.28010.390097
510.0185860.15660.437998
52-0.060537-0.51010.305783
53-0.065935-0.55560.290122
54-0.035452-0.29870.383013
55-0.076481-0.64440.260685
560.0316860.2670.395125
570.0977580.82370.206427
58-0.068891-0.58050.281711
59-0.06173-0.52010.302289
600.0124050.10450.458523


Parameters (Session):
par1 = 60 ; par2 = 1 ; par3 = 1 ; par4 = 0 ; par5 = 12 ; par6 = White Noise ; par7 = 0.95 ;
Parameters (R input):
par1 = 60 ; par2 = 1 ; par3 = 1 ; par4 = 0 ; par5 = 12 ; par6 = White Noise ; par7 = 0.95 ; par8 = ;
R code (references can be found in the software module):
if (par1 == 'Default') {
par1 = 10*log10(length(x))
} else {
par1 <- as.numeric(par1)
}
par2 <- as.numeric(par2)
par3 <- as.numeric(par3)
par4 <- as.numeric(par4)
par5 <- as.numeric(par5)
if (par6 == 'White Noise') par6 <- 'white' else par6 <- 'ma'
par7 <- as.numeric(par7)
if (par8 != '') par8 <- as.numeric(par8)
ox <- x
if (par8 == '') {
if (par2 == 0) {
x <- log(x)
} else {
x <- (x ^ par2 - 1) / par2
}
} else {
x <- log(x,base=par8)
}
if (par3 > 0) x <- diff(x,lag=1,difference=par3)
if (par4 > 0) x <- diff(x,lag=par5,difference=par4)
bitmap(file='picts.png')
op <- par(mfrow=c(2,1))
plot(ox,type='l',main='Original Time Series',xlab='time',ylab='value')
if (par8=='') {
mytitle <- paste('Working Time Series (lambda=',par2,', d=',par3,', D=',par4,')',sep='')
mysub <- paste('(lambda=',par2,', d=',par3,', D=',par4,', CI=', par7, ', CI type=',par6,')',sep='')
} else {
mytitle <- paste('Working Time Series (base=',par8,', d=',par3,', D=',par4,')',sep='')
mysub <- paste('(base=',par8,', d=',par3,', D=',par4,', CI=', par7, ', CI type=',par6,')',sep='')
}
plot(x,type='l', main=mytitle,xlab='time',ylab='value')
par(op)
dev.off()
bitmap(file='pic1.png')
racf <- acf(x, par1, main='Autocorrelation', xlab='time lag', ylab='ACF', ci.type=par6, ci=par7, sub=mysub)
dev.off()
bitmap(file='pic2.png')
rpacf <- pacf(x,par1,main='Partial Autocorrelation',xlab='lags',ylab='PACF',sub=mysub)
dev.off()
(myacf <- c(racf$acf))
(mypacf <- c(rpacf$acf))
lengthx <- length(x)
sqrtn <- sqrt(lengthx)
load(file='createtable')
a<-table.start()
a<-table.row.start(a)
a<-table.element(a,'Autocorrelation Function',4,TRUE)
a<-table.row.end(a)
a<-table.row.start(a)
a<-table.element(a,'Time lag k',header=TRUE)
a<-table.element(a,hyperlink('basics.htm','ACF(k)','click here for more information about the Autocorrelation Function'),header=TRUE)
a<-table.element(a,'T-STAT',header=TRUE)
a<-table.element(a,'P-value',header=TRUE)
a<-table.row.end(a)
for (i in 2:(par1+1)) {
a<-table.row.start(a)
a<-table.element(a,i-1,header=TRUE)
a<-table.element(a,round(myacf[i],6))
mytstat <- myacf[i]*sqrtn
a<-table.element(a,round(mytstat,4))
a<-table.element(a,round(1-pt(abs(mytstat),lengthx),6))
a<-table.row.end(a)
}
a<-table.end(a)
table.save(a,file='mytable.tab')
a<-table.start()
a<-table.row.start(a)
a<-table.element(a,'Partial Autocorrelation Function',4,TRUE)
a<-table.row.end(a)
a<-table.row.start(a)
a<-table.element(a,'Time lag k',header=TRUE)
a<-table.element(a,hyperlink('basics.htm','PACF(k)','click here for more information about the Partial Autocorrelation Function'),header=TRUE)
a<-table.element(a,'T-STAT',header=TRUE)
a<-table.element(a,'P-value',header=TRUE)
a<-table.row.end(a)
for (i in 1:par1) {
a<-table.row.start(a)
a<-table.element(a,i,header=TRUE)
a<-table.element(a,round(mypacf[i],6))
mytstat <- mypacf[i]*sqrtn
a<-table.element(a,round(mytstat,4))
a<-table.element(a,round(1-pt(abs(mytstat),lengthx),6))
a<-table.row.end(a)
}
a<-table.end(a)
table.save(a,file='mytable1.tab')